Getting Started: Why Pay Attention to On-Chain Signals
This chapter helps investors understand the meaning of "on-chain signals," their main types, and their value in investment decision-making. Investors will learn to distinguish between "on-chain indicators" and "price noise," laying a solid foundation for subsequent data analysis and practical operations.
What Are “On-Chain Signals”?
In the 2024–2025 crypto market, price fluctuations are increasingly influenced by on-chain behavioral data (On-chain Data).
From whale portfolio adjustments, smart wallet tracking, airdrop hunter activities, to Meme craze and DeFi liquidity migration, almost every market hotspot can be traced on-chain before it ignites.
In the past, on-chain analysis was exclusive to quantitative traders and researchers, but now it is becoming an essential skill for ordinary users.
A retail investor who can read on-chain signals can:
- Detect trends early: For example, a new token flowing into a CEX wallet may indicate an imminent listing
- Judge capital direction: By tracking USDT flows, bridge volume, and locked value changes, understand “where the money is”
- Identify project activity: Increases in active addresses and contract interactions often signal emerging hype
Reading on-chain data is not just about “looking at numbers,” but training a market insight.
Three Key Dimensions: The Three Types of Signals Investors Must Read (Capital / User / Sentiment)
Breaking down massive data into three understandable dimensions helps turn “chart intuition” into “understanding”:
1. Capital Flow
What to watch: Large transfers, bridge inflows/outflows, DEX liquidity changes, TVL fluctuations.
Why it matters: Capital is the real force driving prices. Large, stable capital entering a chain or token means someone is buying and able to support the price.
Reference thresholds (experience-based): Short-term (24 hours) new large address buy volume exceeding 2–5% of circulating supply, or a single address buying more than 5% of initial liquidity in a short time, are signals worthy of attention (the higher, the more significant).
2. User Flow
What to watch: New active addresses, contract interaction counts, changes in holder numbers.
Why it matters: Capital drives short-term momentum; users determine sustainability. Continuous growth in active addresses indicates project diffusion, not just one-time speculation.
Reference thresholds: New active addresses growing more than 50% compared to the previous 7-day average indicates a “user influx.”
3. Social Sentiment
What to watch: X/Twitter mentions, Telegram/Discord group joining speed, hot posts and reposts.
Why it matters: Sentiment determines spread speed. High social media heat amplifies capital flow impact, creating rapid volume surges.
Note: If sentiment is high but on-chain capital and user flows don’t increase accordingly, it’s often “hype noise” — high risk.
When all three signals appear simultaneously (capital inflow + user growth + social media heat), the signal is most reliable; if only one dimension spikes, caution is advised.
From “Looking at Charts” to “Making Decisions”: A Reading Template for Ordinary Users
Source: https://web3.gate.com/en/memego/fourmeme
Investors don’t need to memorize all indicators but should develop a simple executable template (Discover → Verify → Test Order → Decide):
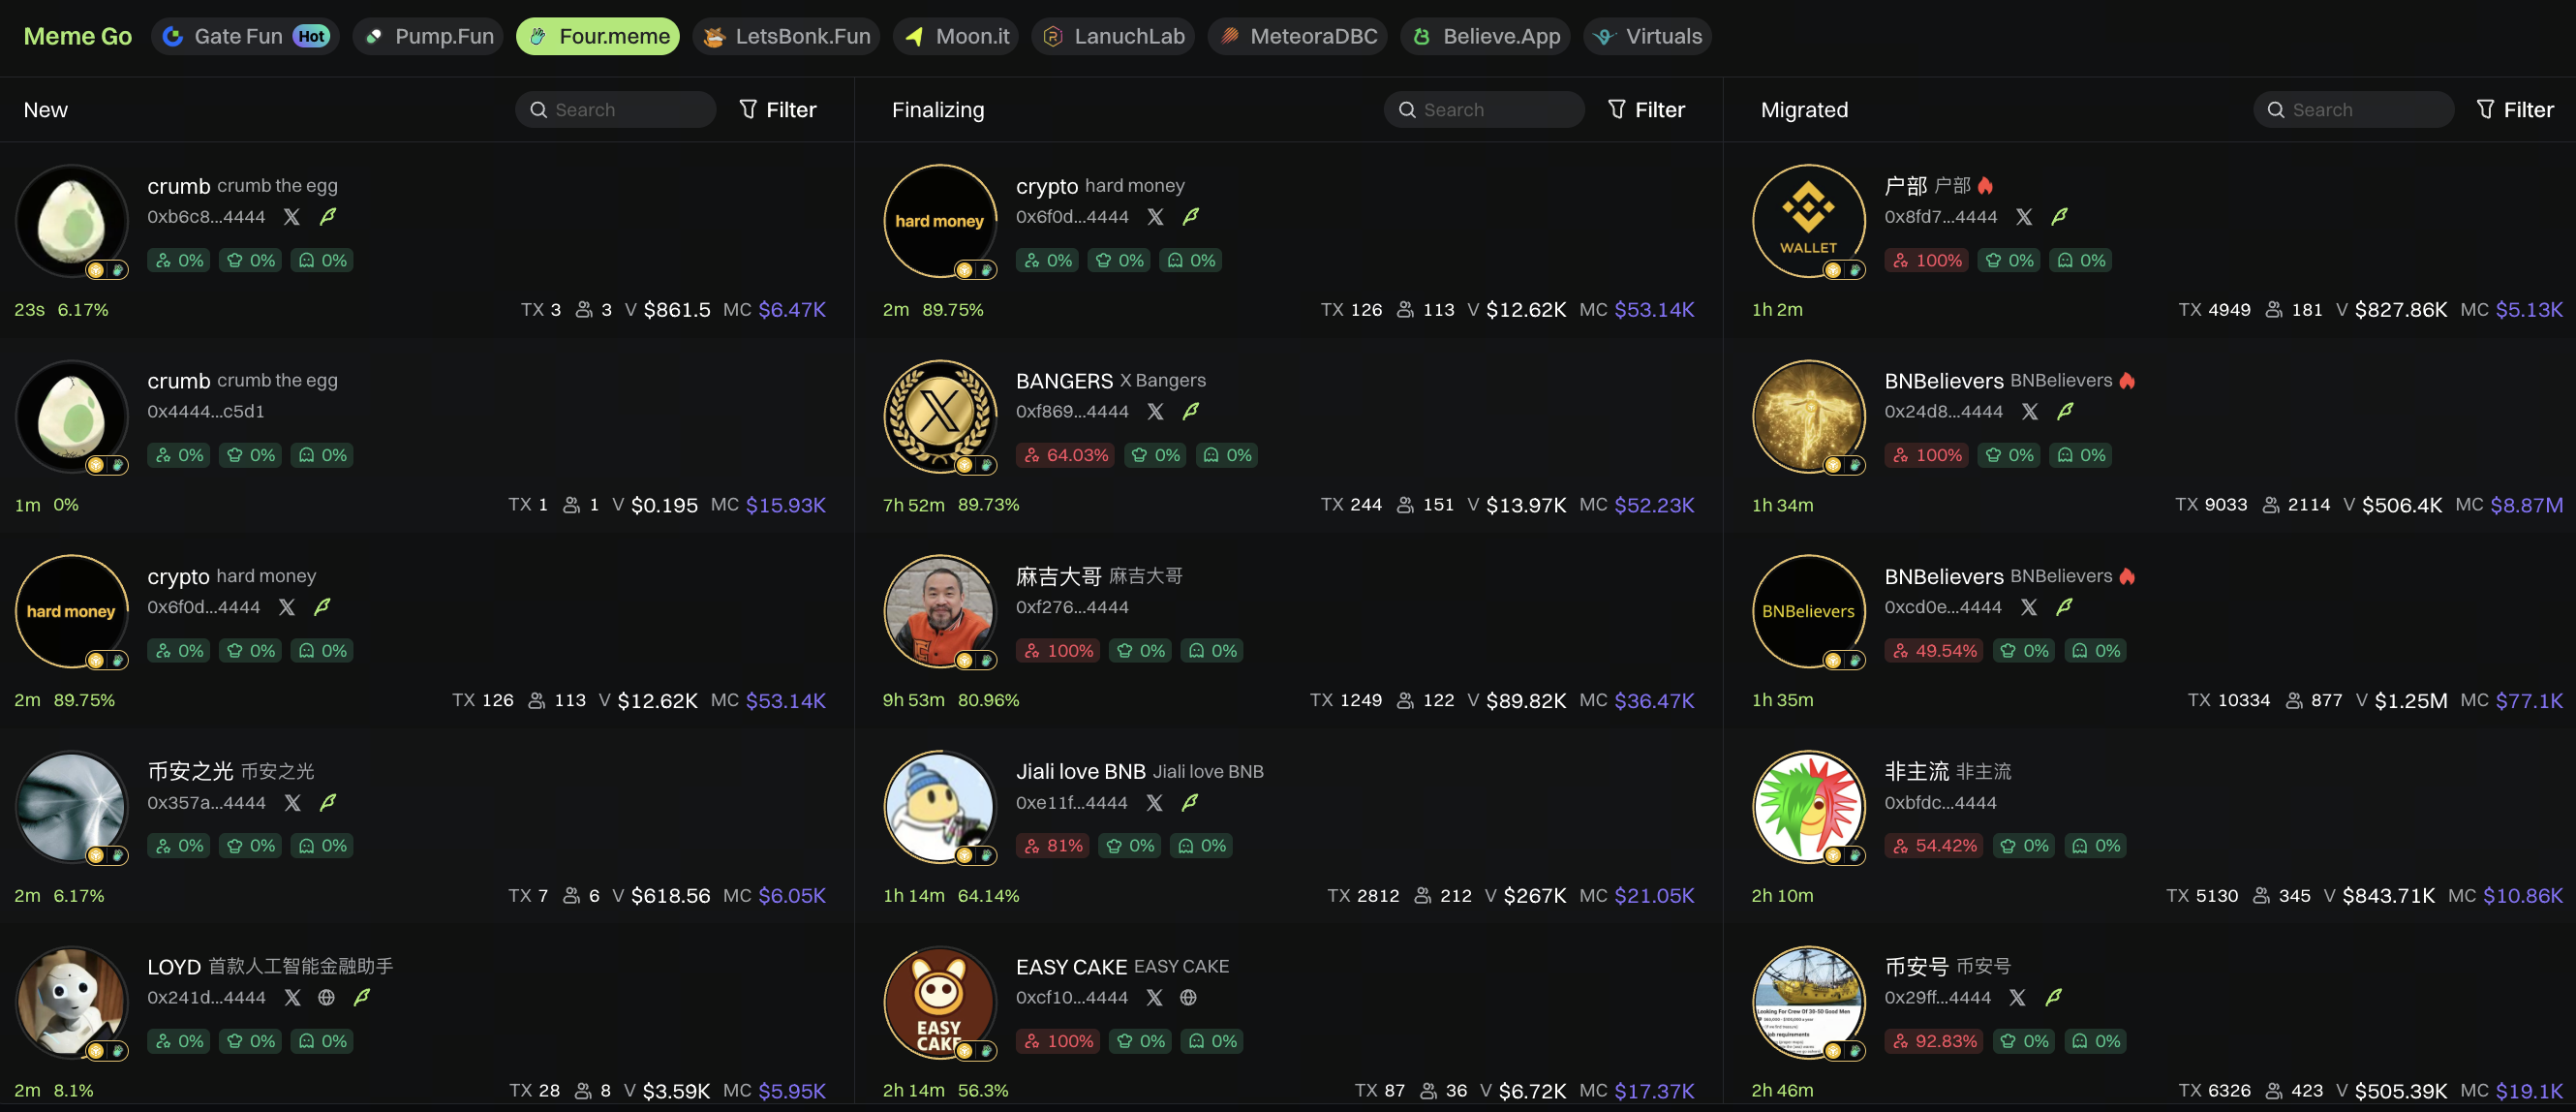
1. Discover: Use hot lists/aggregation panels (like Meme GO, Dexscreener hot lists) to quickly filter tokens with outstanding daily gains or trading volume.
2. Quick Verification:
- Is the contract verified (source code public)?
- What is the top 10 holders’ share? (>40% is high risk)
- Is there liquidity migration or locking mechanism? (No lock means high risk)
- Are there clear “whale buy” traces? (continuous large transfers)
3. Small Test Order: Set reasonable slippage (e.g., 1–3%, adjusted as prompted), make a small buy first, observe if the trade executes smoothly and actual slippage.
4. Scale Up or Exit: If the test order is normal and on-chain data remains robust (holder count rising, continuous buys), scale according to pre-set position rules; if on-chain capital withdraws, large transfers exit, or contract anomalies appear, exit immediately.
The core value of this template is to turn subjective impulses into structured steps, reducing emotional decision-making.
Case Demonstration: Discover → Verify → Test Order Using Meme GO
Suppose an investor sees a token rapidly climbing the Meme GO hot list with 24-hour volume up 180%.
The operation flow can be:
1. Open Meme GO, check the token’s progress bar and holder count changes.
- Continuous increase in active addresses indicates project diffusion
- High progress but stable holder count may indicate whale control
2. Copy the contract address to Etherscan to check:
- Is the contract public?
- Are there mint or owner privileges?
- Top 10 addresses’ share
3. Check liquidity pool info on Dexscreener:
- Thick buy order book means strong market support
- Concentrated sell orders and high slippage warnings require caution
4. Final decision:
- If verification is clean and heat persists, make a small test buy
- If large new sell orders or liquidity drops appear, avoid immediately
This is a standard “signal verification loop.”
Can On-Chain Trends Really “Predict Price”?
One of the most common questions among crypto beginners is: “Can on-chain data really see price changes in advance?” The answer is: on-chain trends do have “leading” characteristics, but they are not crystal balls—just a probabilistic advantage.
To help investors build correct understanding, this section approaches from three angles:
- Why on-chain trends have “foresight”
- Which on-chain indicators usually change before price
- Real case verification: on-chain → market timing gap
Why Does On-Chain Data Move Before Price?
The fundamental reason is simple: on-chain behavior happens “before trade execution,” while price is the “result after trade.”
Example: A whale deposits 5 million USDT into a CEX wallet (visible on-chain) before large buy orders and price rise appear on the exchange.
In other words: capital behavior happens on-chain, price behavior happens on the order book. Thus, on-chain “behavior changes” usually appear earlier, especially reflected in:
- Capital inflows (new inflows)
- Significant active address increases
- Contract interaction surges
- New wallets accumulating continuously
These actions occur before “price changes” and serve as clear leading signals.
Three Most Representative “Leading On-Chain Indicators”
Here are three top indicators investors should focus on and can easily use:
1. Capital Flow
- Watch: Stablecoin flows (USDT / USDC), exchange net inflows, whale transfers and accumulation
- Leading logic: Capital moves first, then buy/sell actions follow
- Beginners can check: DefiLlama’s “Stablecoin Netflows,” Etherscan large transfers (>100k)
2. User Flow
- Core indicators: New address count, active wallet count, new holders
- Leading logic: More users → more trading → price trends emerge
- Most memecoin surges see active addresses rising continuously for 5–7 days before breakout
3. Trading Activity
- Includes: Contract interaction spikes, rapid DEX liquidity growth, abnormal gas consumption increases
- Leading logic: On-chain heat comes from behavior itself, while market heat comes from final volume—thus on-chain heat appears earlier
- This is the most direct “fee signal” on-chain, usually reflecting rising sentiment
Case Study: How On-Chain Trends Appear Before Price?
Case: PEPE’s active addresses surged → price started rising in 2023

Source: https://www.gate.com/trade/PEPE_USDT
- April 15–18: PEPE’s active addresses increased for 4 consecutive days, from 2k to 12k, while price remained sideways
- April 19: DEX liquidity tripled in one day
- April 20–23: Price surged 15x
On-chain users moved first; price followed about 48–72 hours later. This is a common memecoin pattern: “heat rises first → capital follows → price explodes.”
Can On-Chain Trends Really Predict Price in Advance?
Conclusion: They can, but should not be the sole reference. On-chain data is not a prediction tool but lets investors see behavior earlier than others. Capital, users, and interactions are the three most reliable indicators. Sentiment and hype can be faked, but capital and behavior are hard to fake. Price is the result; on-chain is the process. Process always precedes result.
For ordinary users, investors don’t need to understand every chart—just remember: changes on-chain are the prelude to price; anomalies on-chain are the start of risk or opportunity.
Closing: Let Data Serve Investors, Not Let Emotions Drive Decisions
Learning on-chain signals is not about turning investors into analysts but helping them avoid detours in decision-making. Moving from “watching price moves” to “watching behavior” is the first step toward becoming a mature investor. In the future, when investors see market heat explode, pause and open on-chain tools to check if capital, users, and sentiment align. Because true trends are often already written on-chain.
Lesson 1:Getting Started: Why Pay Attention to On-Chain Signals
Lesson 2:Tools Section: Mainstream On-Chain Analysis and Visualization Tools
Lesson 3:Practical Guide: On-Chain Scanning Operation and Meme GO Tutorial
Lesson 4:Pattern Recognition of On-Chain Behavior: Understanding the True Intentions of Players and Funds
Lesson 5:Advanced Section – From Data Observation to Trend Judgment
Related Courses

Guide to Gate Dual Currency Products
Tools That Help You Trade Better: Moving Averages, Trend Lines, and Indicators

The Beginner's Guide to Blockchain-based Airdrops

Introduction to Meme Tokens

Learn about web3 data and analytics