Trade
Basic
Futures
Futures
Hundreds of contracts settled in USDT or BTC
TradFi
Gold
Trade global traditional assets with USDT in one place
Options
Hot
Trade European-style vanilla options
Unified Account
Maximize your capital efficiency
Demo Trading
Futures Kickoff
Get prepared for your futures trading
Futures Events
Participate in events to win generous rewards
Demo Trading
Use virtual funds to experience risk-free trading
Earn
Launch
CandyDrop
Collect candies to earn airdrops
Launchpool
Quick staking, earn potential new tokens
HODLer Airdrop
Hold GT and get massive airdrops for free
Launchpad
Be early to the next big token project
Alpha Points
Trade on-chain assets and enjoy airdrop rewards!
Futures Points
Earn futures points and claim airdrop rewards
Investment
Simple Earn
Earn interests with idle tokens
Auto-Invest
Auto-invest on a regular basis
Dual Investment
Buy low and sell high to take profits from price fluctuations
Soft Staking
Earn rewards with flexible staking
Crypto Loan
0 Fees
Pledge one crypto to borrow another
Lending Center
One-stop lending hub
VIP Wealth Hub
Customized wealth management empowers your assets growth
Private Wealth Management
Customized asset management to grow your digital assets
Quant Fund
Top asset management team helps you profit without hassle
Staking
Stake cryptos to earn in PoS products
Smart Leverage
New
No forced liquidation before maturity, worry-free leveraged gains
GUSD Minting
Use USDT/USDC to mint GUSD for treasury-level yields
More
KRYPTON_bit
About cryptocurrency — in simple words! Trader, investor 24/7 in CRYPTO. Streams and analytics. Charts, metrics, thoughts on the market.
KRYPTON_bit
#FOMC #CPI #USACryptoTrends $BTC $GT
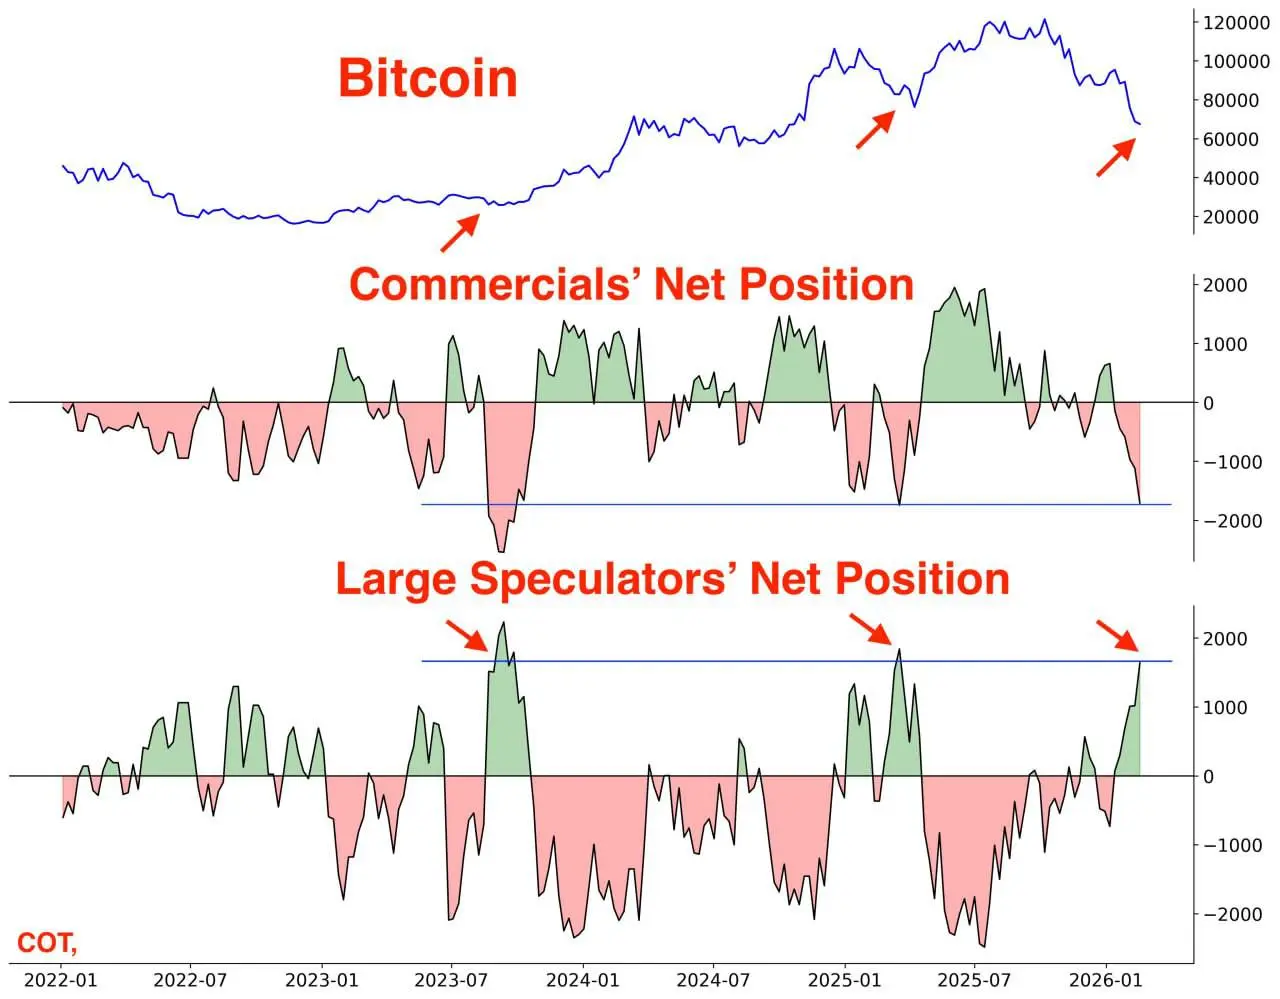
We have released some of the most important macro data for all markets — PPI (producer inflation). And the numbers turned out worse than expected. Let’s analyze what this means for crypto, the stock market, and BTC.
📊 Actual PPI data (January) Producer Price Index (YoY):▪️ Actual: 2.9%▪️ Forecast: 2.6%▪️ Previous: 3.0%PPI (MoM):▪️ Actual: 0.5%▪️ Forecast: 0.3%Core PPI (MoM):▪️ Actual: 0.8%▪️ Forecast: 0.3% ⚠️Core PPI (YoY):▪️ Actual: 3.6%▪️ Forecast: 3.0%
👉 The main issue — core inflation is significantly higher than expectations.⚠️ Why this is critic
View OriginalWe have released some of the most important macro data for all markets — PPI (producer inflation). And the numbers turned out worse than expected. Let’s analyze what this means for crypto, the stock market, and BTC.
📊 Actual PPI data (January) Producer Price Index (YoY):▪️ Actual: 2.9%▪️ Forecast: 2.6%▪️ Previous: 3.0%PPI (MoM):▪️ Actual: 0.5%▪️ Forecast: 0.3%Core PPI (MoM):▪️ Actual: 0.8%▪️ Forecast: 0.3% ⚠️Core PPI (YoY):▪️ Actual: 3.6%▪️ Forecast: 3.0%
👉 The main issue — core inflation is significantly higher than expectations.⚠️ Why this is critic
- Reward
- 1
- Comment
- Repost
- Share
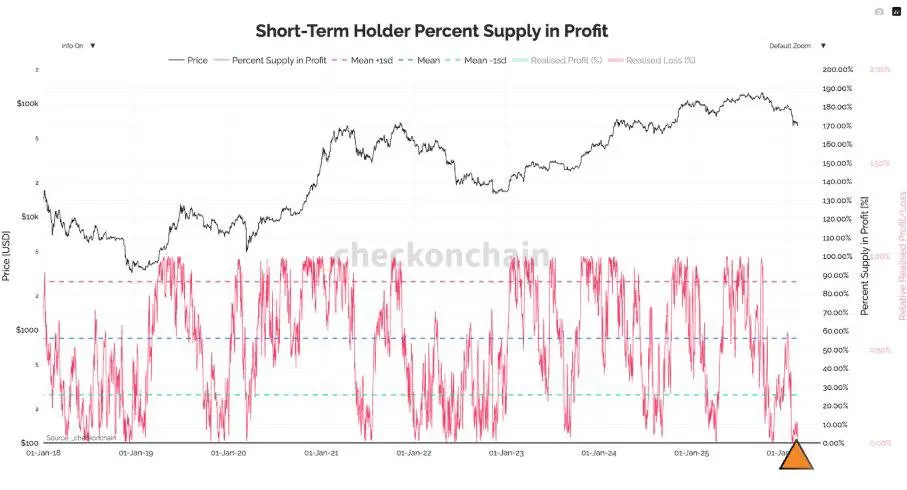
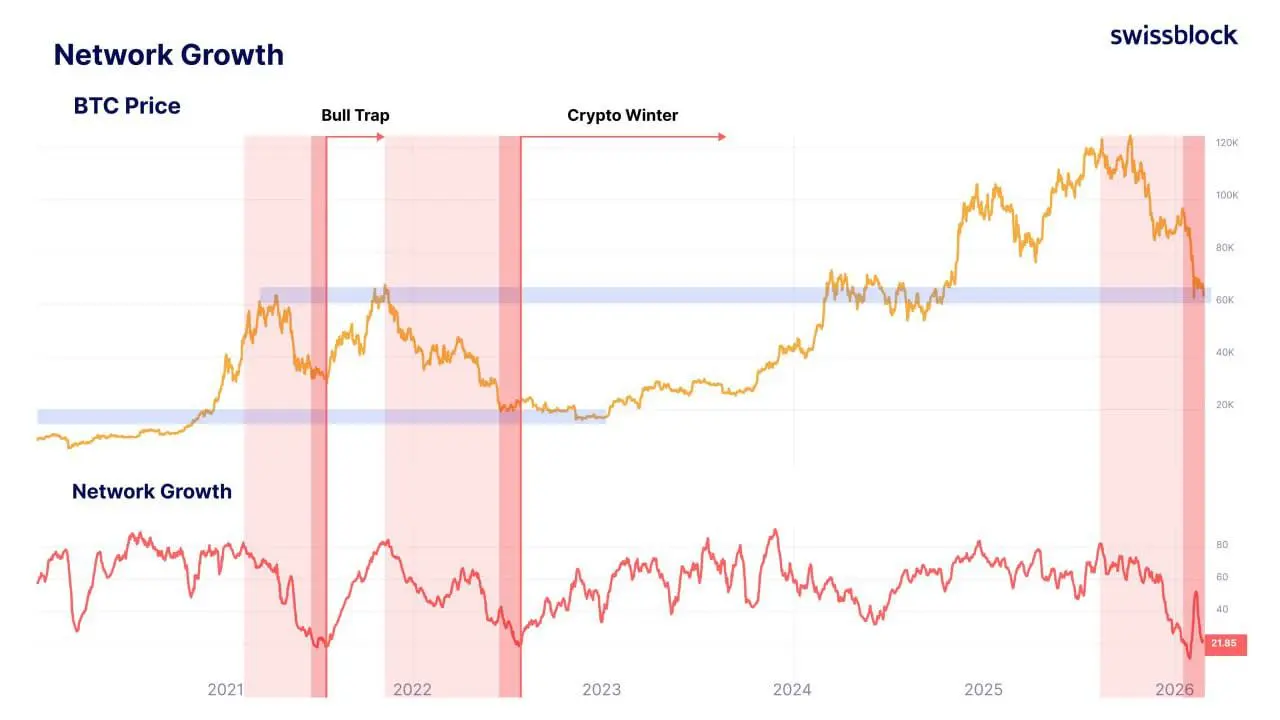
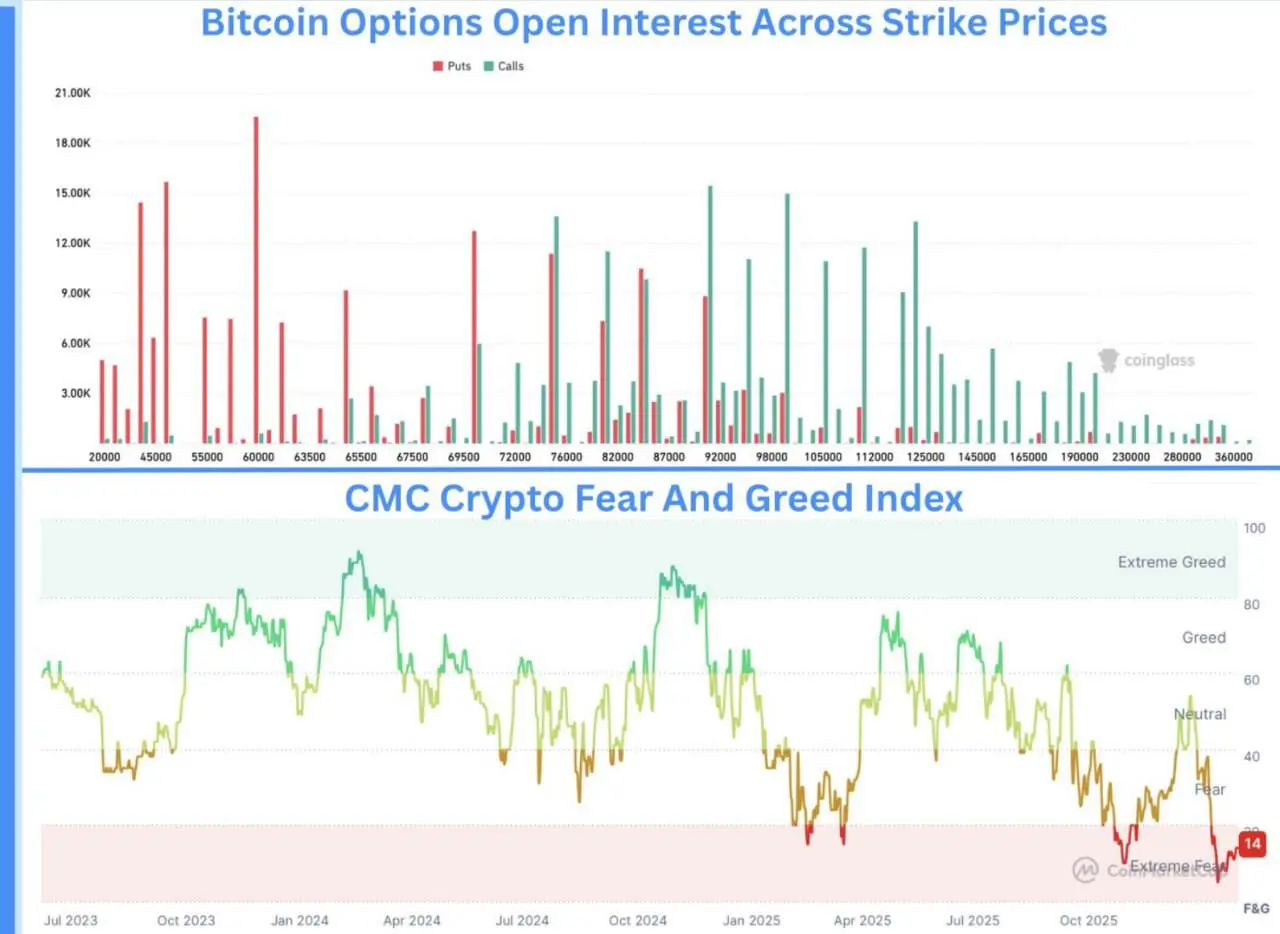
⚠️ THE MARKET HAS CLEARED OUT THE SHAKERS. 99% OF NEW INVESTORS ARE IN LOSS — WHAT DOES THIS MEAN FOR BTC
Currently, one of the most important phases of the cycle is forming, which most participants misunderstand.
Let's analyze the facts.
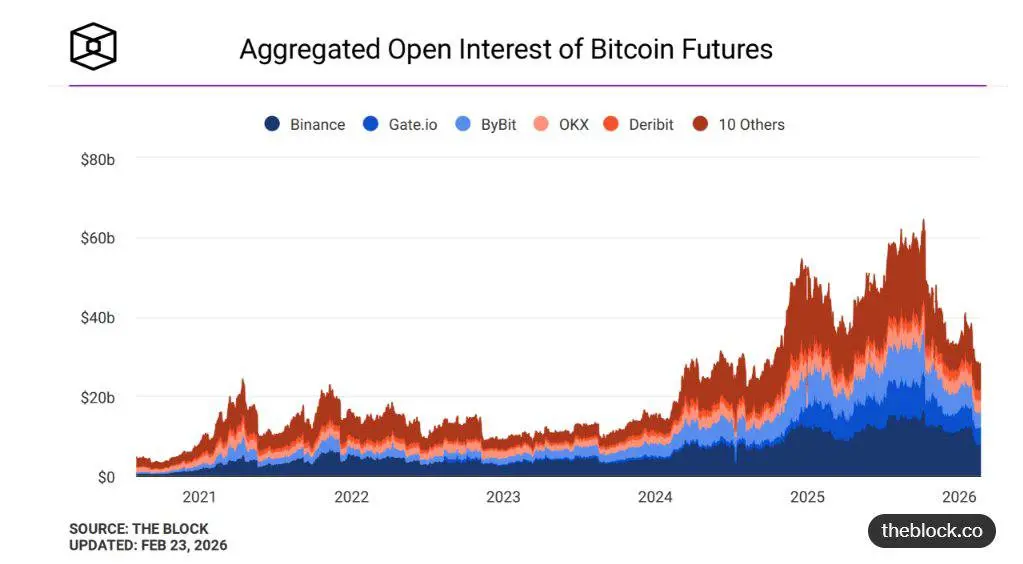
📉 1️⃣ Massive Margin Cleansing
Current BTC Open Interest: $44.8 billion
This is approximately –55% from the October 2025 peak.
What does this mean:
✅ The market is shedding overloaded leverage
✅ The number of forced liquidations is decreasing
✅ Price is once again starting to depend on real spot demand
Historically:
Major drops in Open Interest almost always
View OriginalCurrently, one of the most important phases of the cycle is forming, which most participants misunderstand.
Let's analyze the facts.
📉 1️⃣ Massive Margin Cleansing
Current BTC Open Interest: $44.8 billion
This is approximately –55% from the October 2025 peak.
What does this mean:
✅ The market is shedding overloaded leverage
✅ The number of forced liquidations is decreasing
✅ Price is once again starting to depend on real spot demand
Historically:
Major drops in Open Interest almost always
- Reward
- like
- Comment
- Repost
- Share
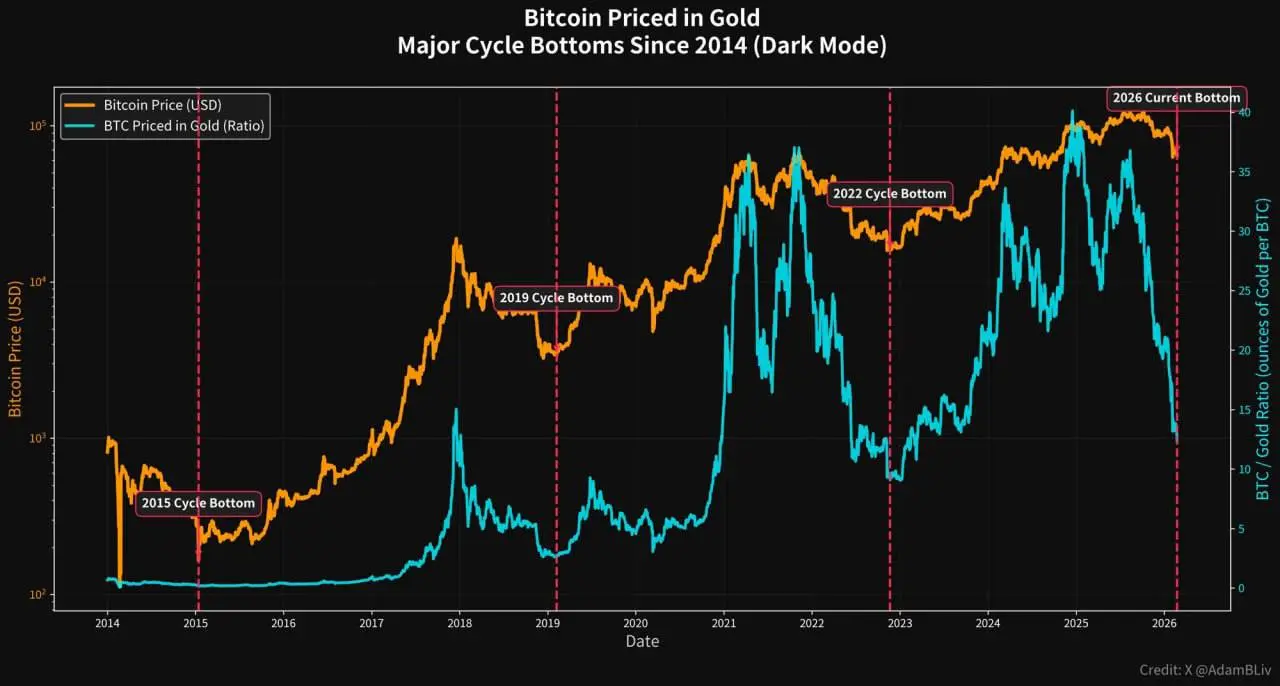
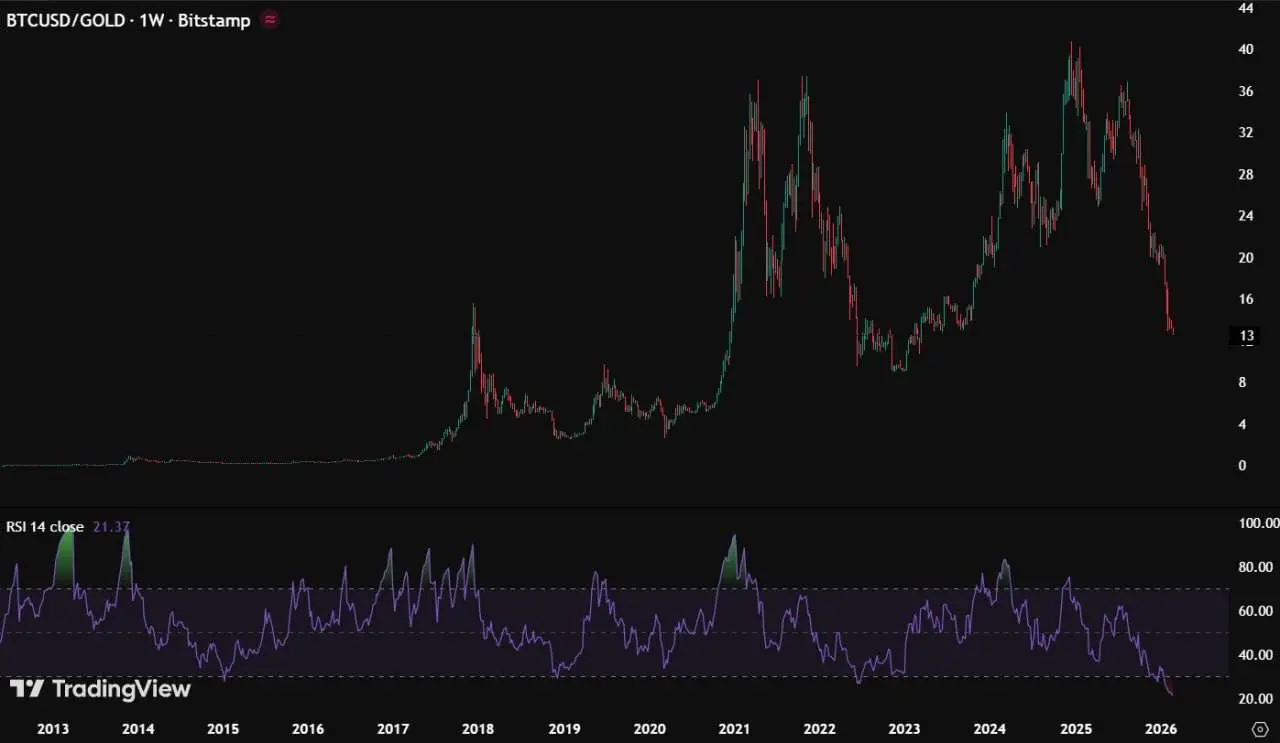
🚨 BTC AGAINST GOLD AT A HISTORIC LOW. LTH BROKEN. MARKET IN LOSS MODE
Several metrics indicate a deep phase of pressure.
📉 1️⃣ BTC / Gold — historic weakness
The weekly RSI of the BTC to gold pair has dropped to an all-time low.
Lower than:
— FTX collapse
— 2020 crash
— 2018 bear market
This indicates record relative weakness of BTC compared to the safe-haven asset.
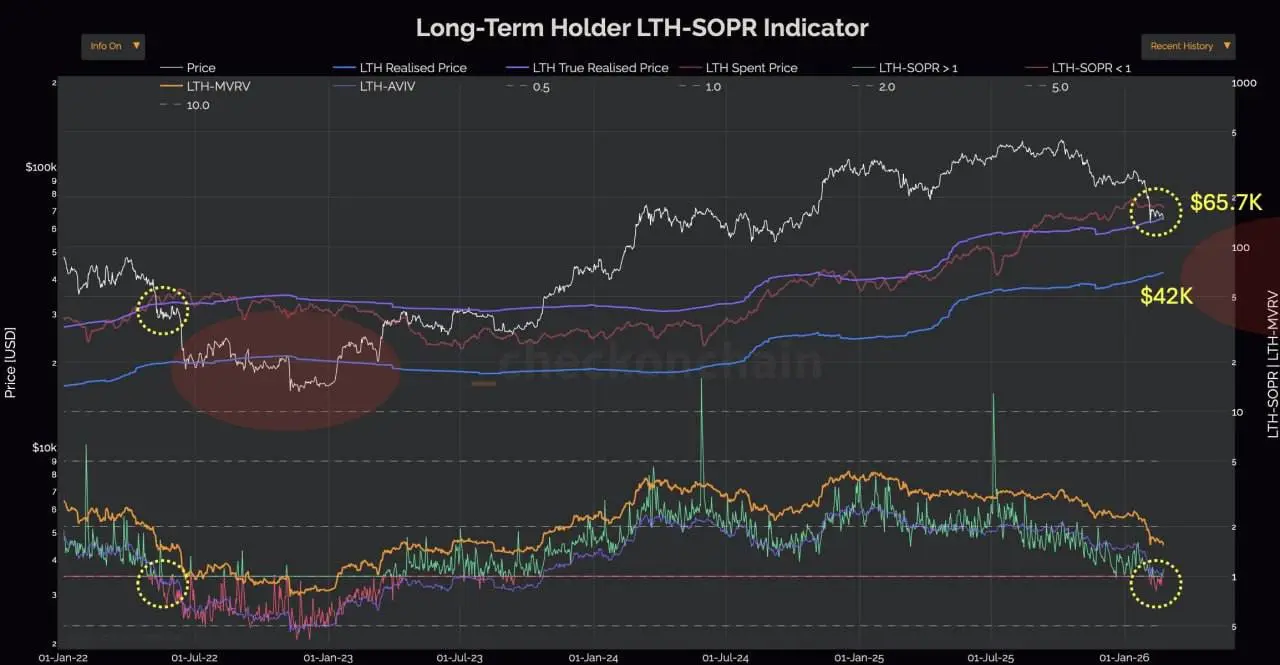
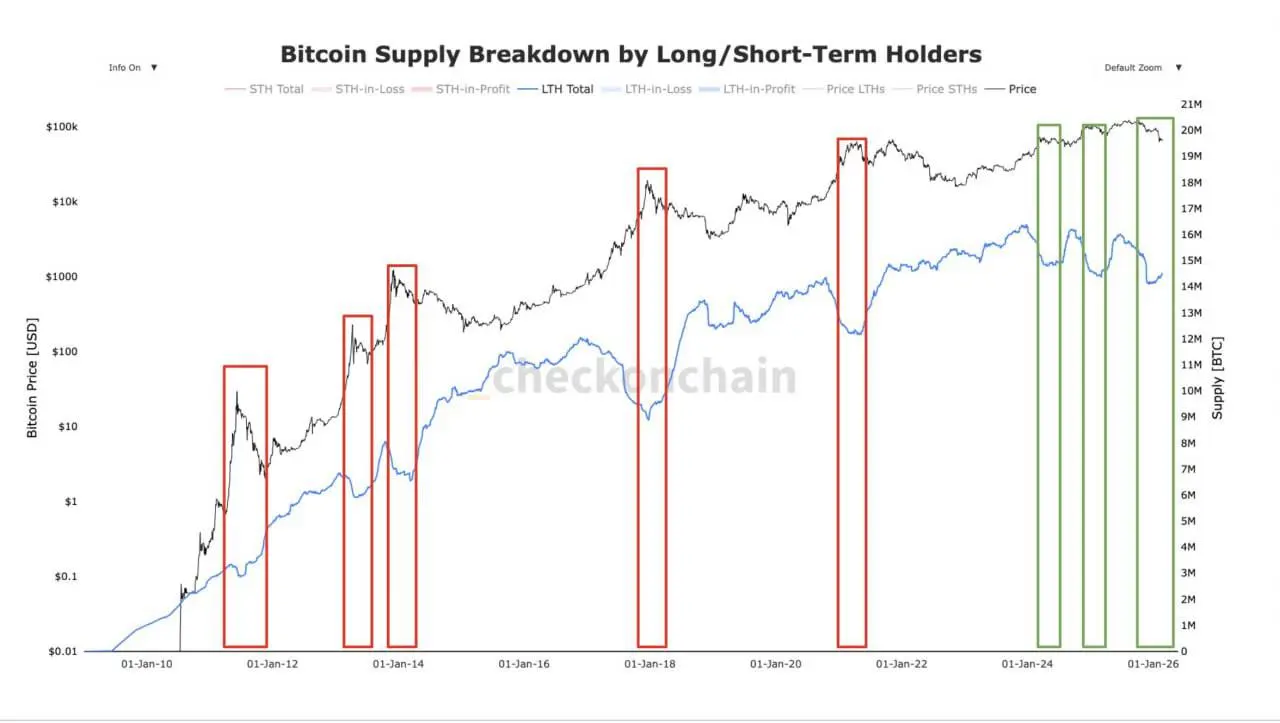
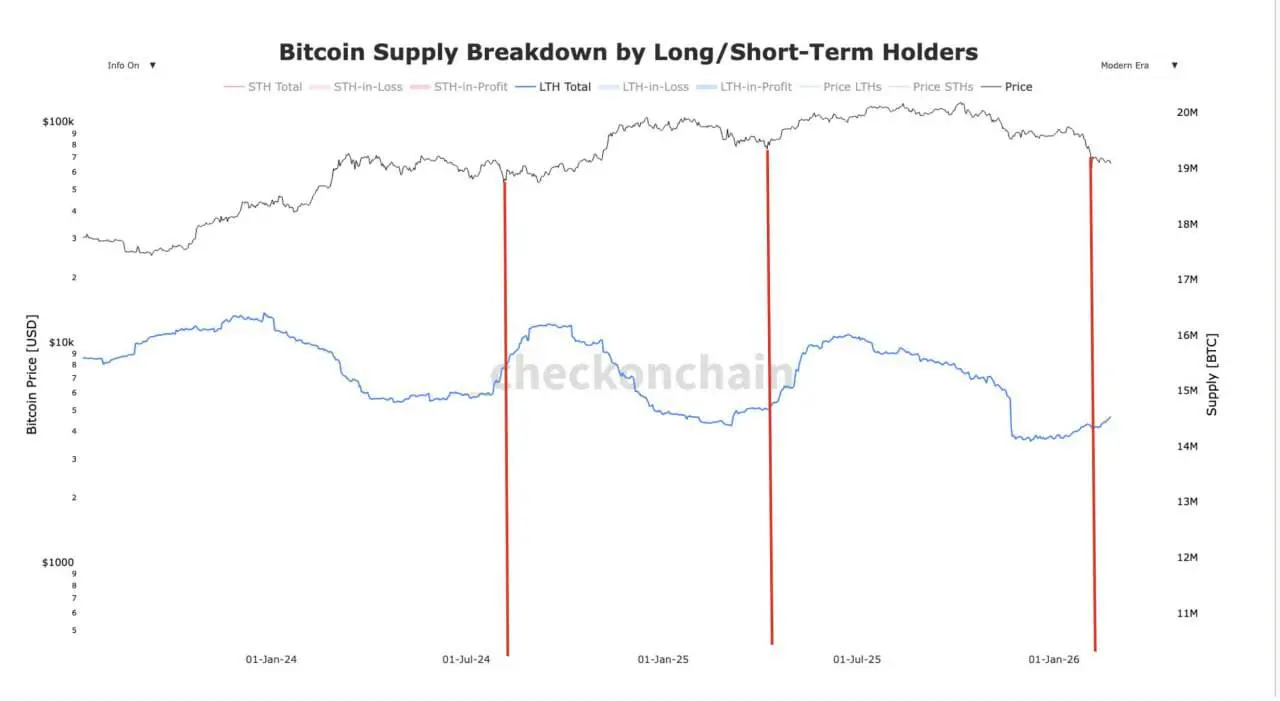
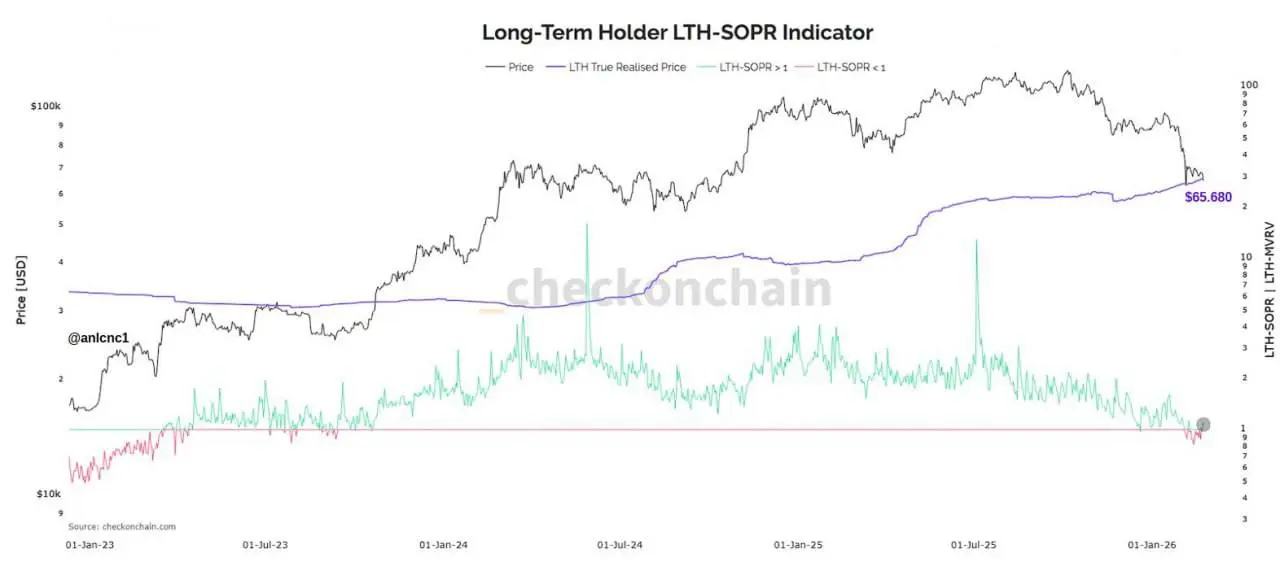
2️⃣ Long-term Holders' Level Broken
According to On-Chain College:
BTC has broken the realized price of long-term holders — ~$65.7k
and is now trying to regain this level.
Historically, holding below the LTH level often led to de
View OriginalSeveral metrics indicate a deep phase of pressure.
📉 1️⃣ BTC / Gold — historic weakness
The weekly RSI of the BTC to gold pair has dropped to an all-time low.
Lower than:
— FTX collapse
— 2020 crash
— 2018 bear market
This indicates record relative weakness of BTC compared to the safe-haven asset.
2️⃣ Long-term Holders' Level Broken
According to On-Chain College:
BTC has broken the realized price of long-term holders — ~$65.7k
and is now trying to regain this level.
Historically, holding below the LTH level often led to de
- Reward
- like
- Comment
- Repost
- Share
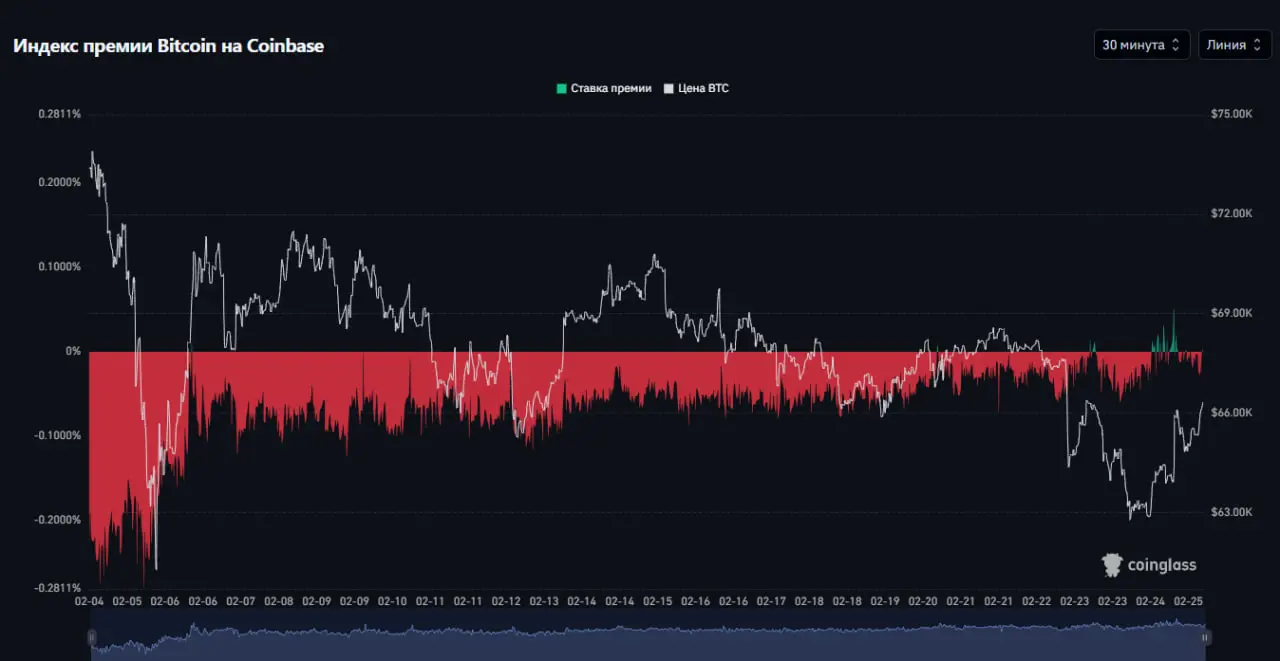
America yesterday transitioned into a phase of gradual selling from these levels. Wait for the American market to open very soon. I closed my long position earlier; you might consider taking partial profits✅ #bitcoin #americatrends $BTC
BTC-2.63%
- Reward
- like
- Comment
- Repost
- Share
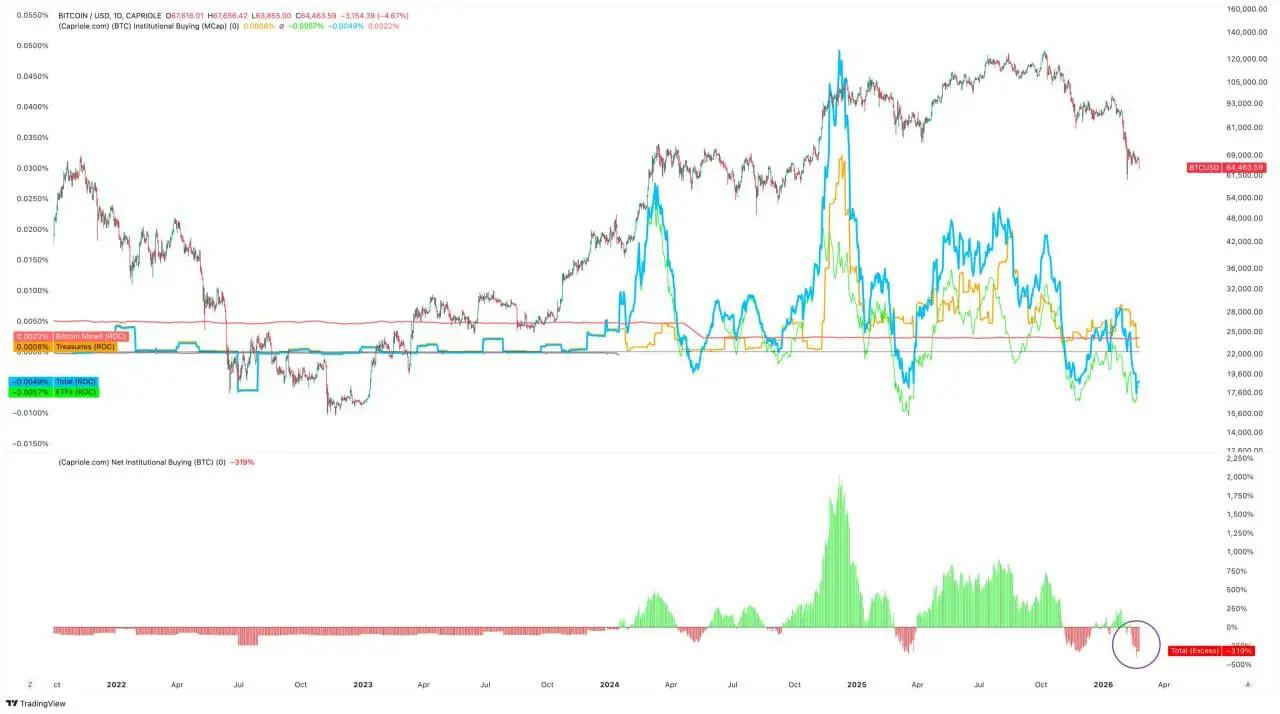
🚨 INSTITUTIONAL SELLING REACHED A RECORD HIGH. BUT LTH IS GATHERING AGAIN
The BTC market is in a contradictory phase: aggressive selling by funds and simultaneous strengthening of long-term accumulation.
📉 1️⃣ The Most Aggressive Institutional Sell-Off
According to Charles Edwards, last week saw the largest net BTC sell-off by institutions in recorded history.
This increases short-term pressure and explains the weak price dynamics.
Institutional flow now is a risk factor.
🧱 2️⃣ Long-term Holders (LTH) Are Changing Behavior
Since November 23, the LTH supply has increased by +400,000 BTC.
Tha
View OriginalThe BTC market is in a contradictory phase: aggressive selling by funds and simultaneous strengthening of long-term accumulation.
📉 1️⃣ The Most Aggressive Institutional Sell-Off
According to Charles Edwards, last week saw the largest net BTC sell-off by institutions in recorded history.
This increases short-term pressure and explains the weak price dynamics.
Institutional flow now is a risk factor.
🧱 2️⃣ Long-term Holders (LTH) Are Changing Behavior
Since November 23, the LTH supply has increased by +400,000 BTC.
Tha
- Reward
- 2
- Comment
- Repost
- Share
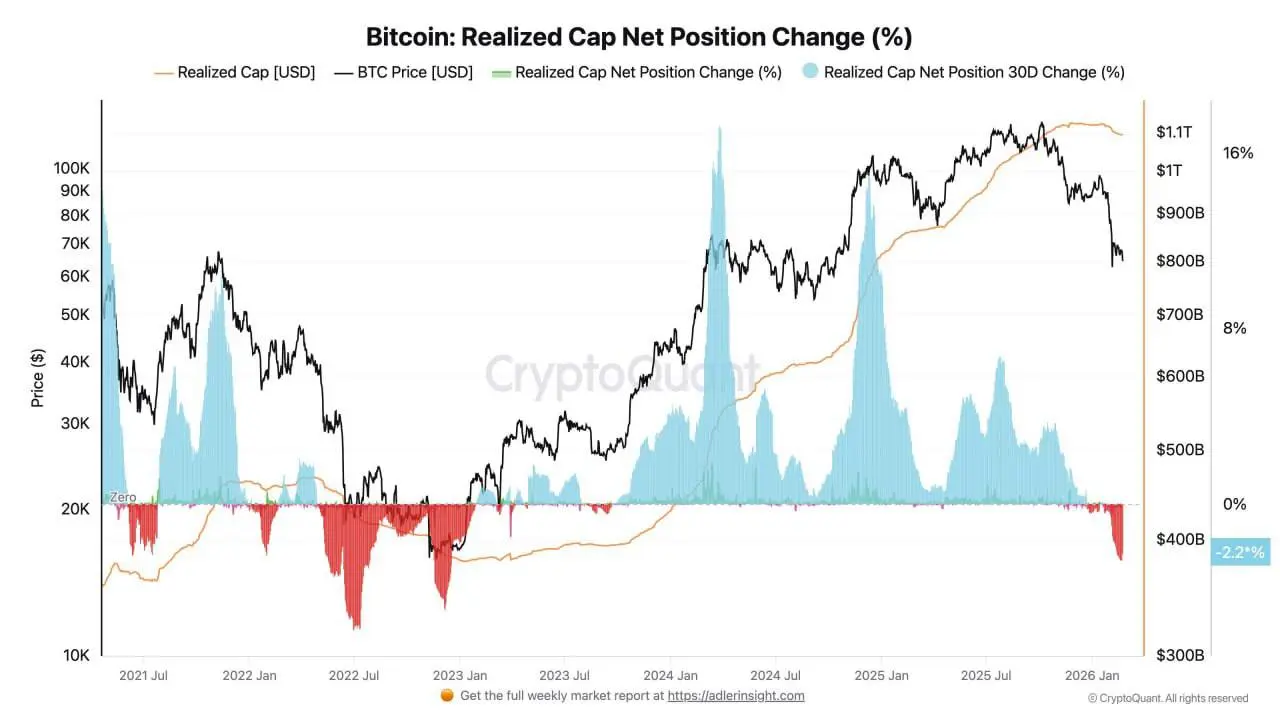
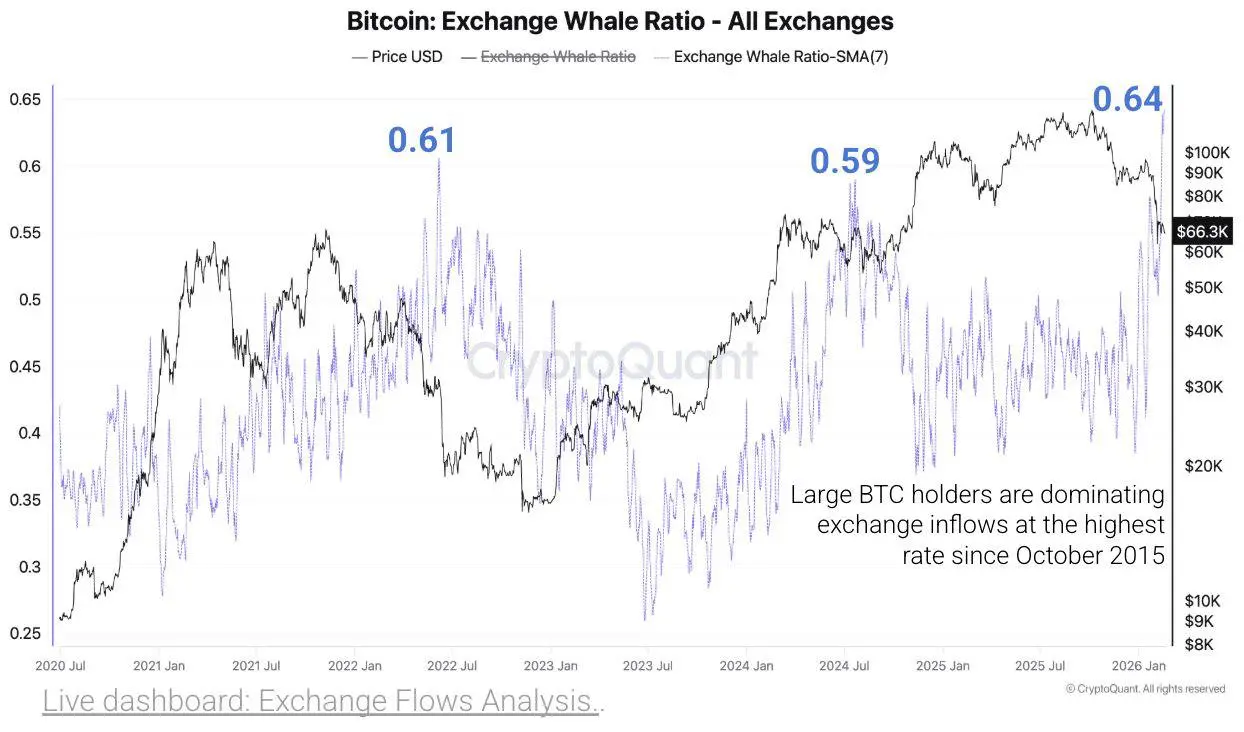
The #BTC market is entering a zone of structural pressure where on-chain and institutional signals converge.
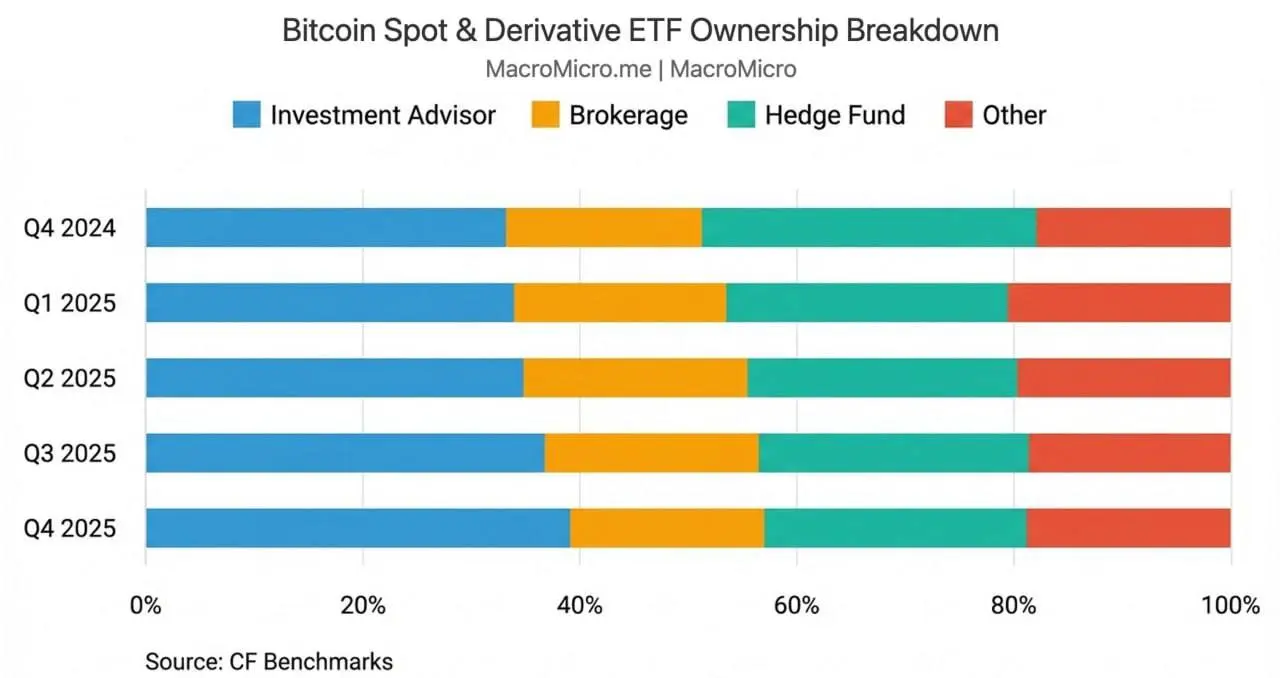
📉1️⃣ Major players increase inflow to exchanges According to #CryptoQuant : The exchange ratio of major players reached 0.64 — the highest since 2015. This means that the top 10 wallets account for 64% of BTC inflow to exchanges. Historically, this indicator signals potential supply pressure. 🏦 2️⃣ Hedge funds reduce BTC-ETF positions According to MacroMicro ( citing CF Benchmarks ): In Q4 2025, hedge funds reduced their BTC-ETF positions by 28% quarter-over-quarter. Reasons include:
📉1️⃣ Major players increase inflow to exchanges According to #CryptoQuant : The exchange ratio of major players reached 0.64 — the highest since 2015. This means that the top 10 wallets account for 64% of BTC inflow to exchanges. Historically, this indicator signals potential supply pressure. 🏦 2️⃣ Hedge funds reduce BTC-ETF positions According to MacroMicro ( citing CF Benchmarks ): In Q4 2025, hedge funds reduced their BTC-ETF positions by 28% quarter-over-quarter. Reasons include:
BTC-2.63%
- Reward
- 1
- Comment
- Repost
- Share
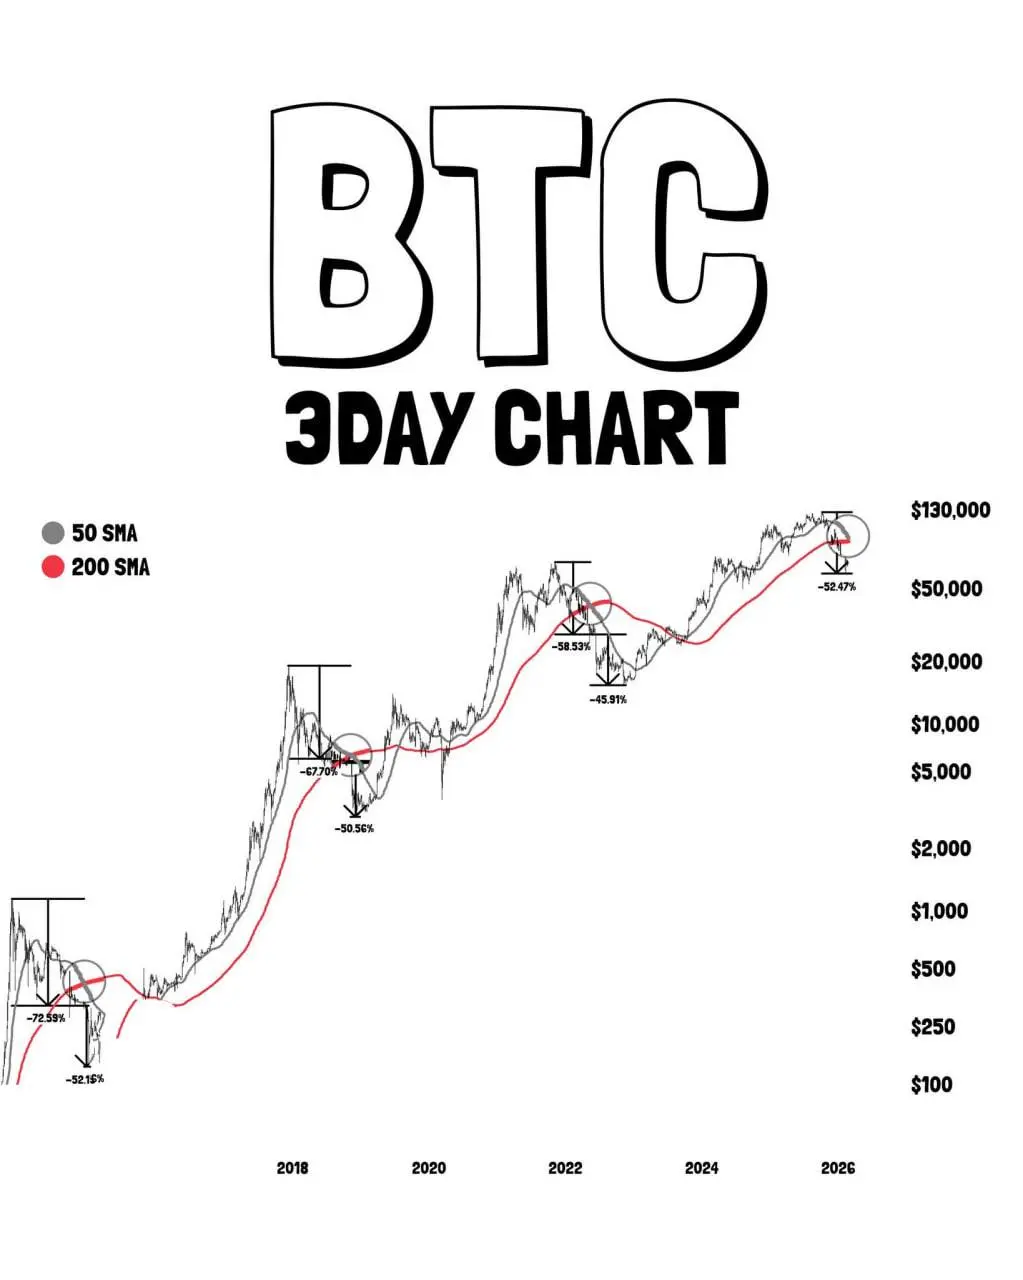
🚨 BTC AT THE EDGE: LTH LEVEL, 60K AND THE "DEATH CROSS"
The market has approached a zone where several critical metrics converge.
📊 1️⃣ Real Price of Long-Term Holders — $65 680
The average cost basis for those holding BTC for 155+ days is currently around $65 680.
This is the so-called Realized Price LTH — a historically strong balance level.
When the price is above → long-term holders are in profit.
When below → pressure and redistribution begin.
We are trading right at this boundary.
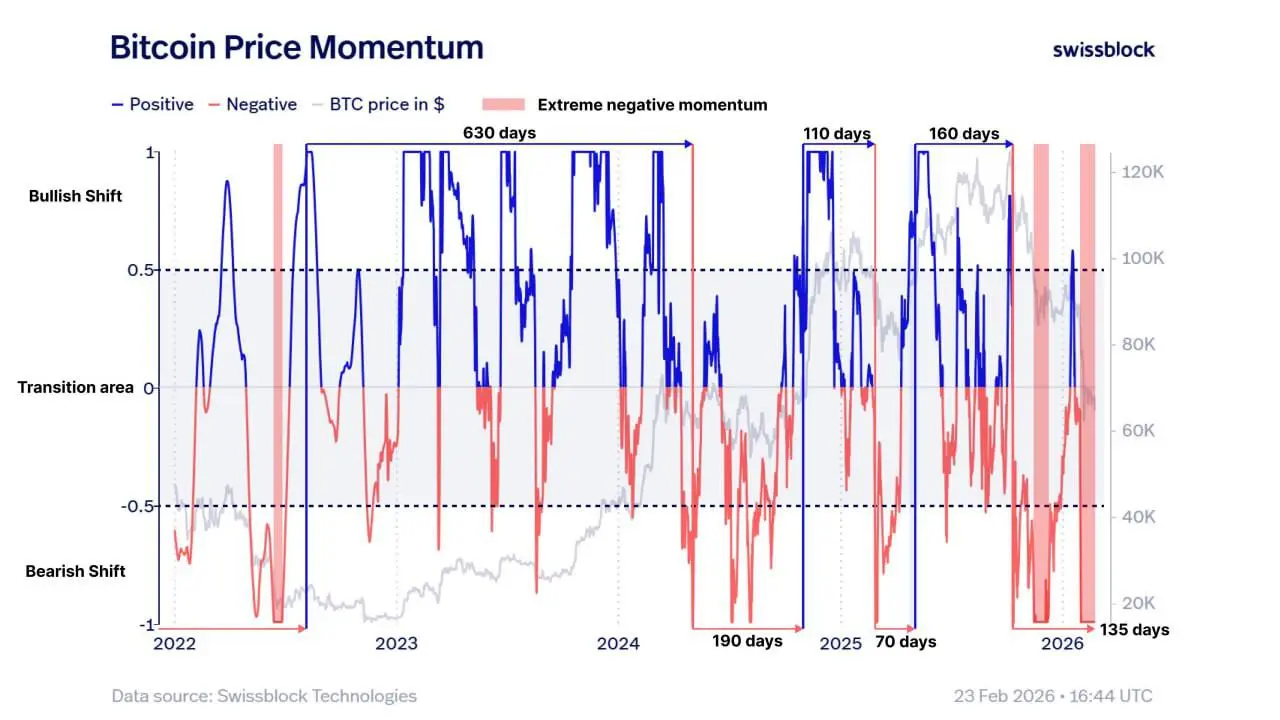
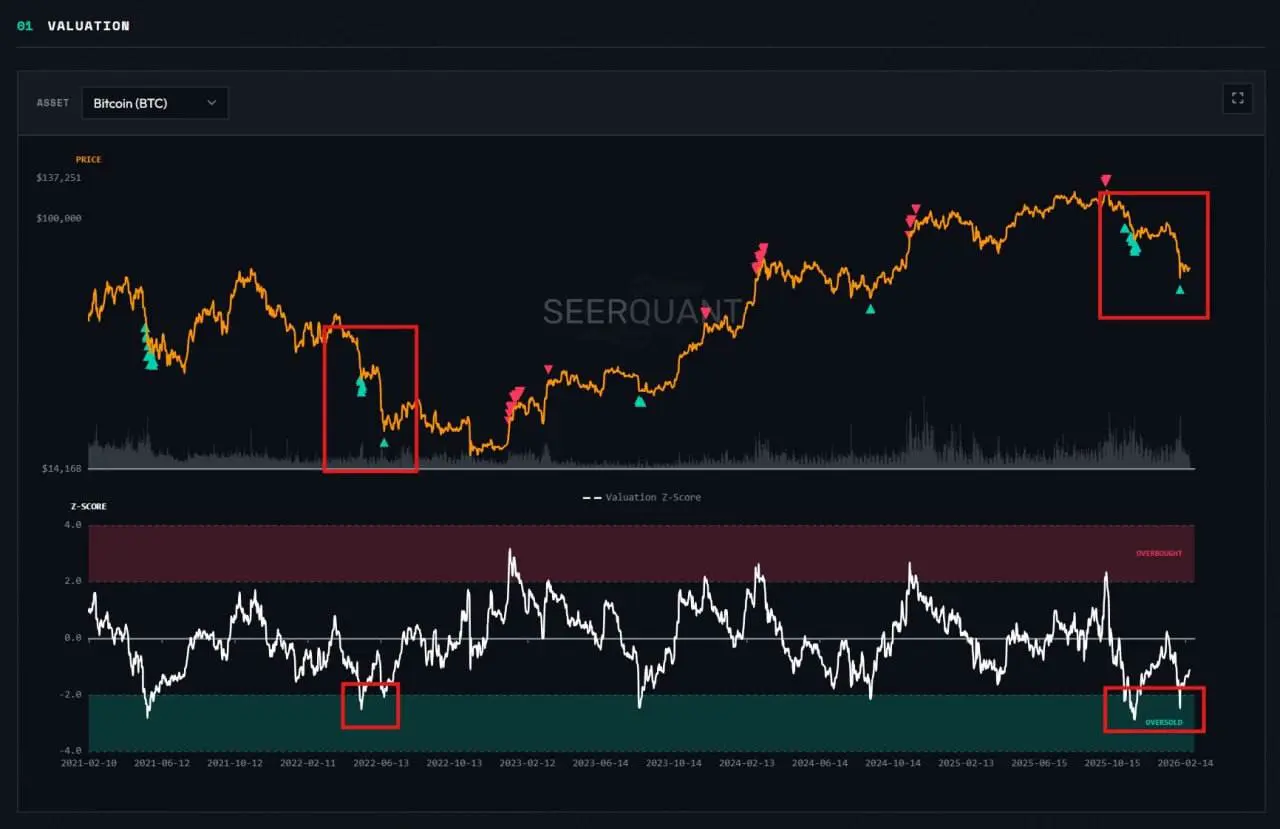
📉 2️⃣ Volatility is decreasing, the trend is weakening
According to SeerQuant:
— Volatility is declining
The market has approached a zone where several critical metrics converge.
📊 1️⃣ Real Price of Long-Term Holders — $65 680
The average cost basis for those holding BTC for 155+ days is currently around $65 680.
This is the so-called Realized Price LTH — a historically strong balance level.
When the price is above → long-term holders are in profit.
When below → pressure and redistribution begin.
We are trading right at this boundary.
📉 2️⃣ Volatility is decreasing, the trend is weakening
According to SeerQuant:
— Volatility is declining
BTC-2.63%
- Reward
- like
- 3
- Repost
- Share
Lexxx3113 :
:
Jump in 🚀View More