How the EMA Indicator Influences Crypto Market Trends: Latest Technical Analysis and BTC/ETH Price Interpretation

Beginner
Quick Reads
Last Updated 2026-03-25 19:56:51
Reading Time: 1m
A comprehensive examination of the EMA indicator's function within the cryptocurrency industry, incorporating the latest BTC and ETH price trends and technical signals. This article helps readers understand how EMA can be applied to trend analysis and trading strategies.

What Is the EMA Indicator?


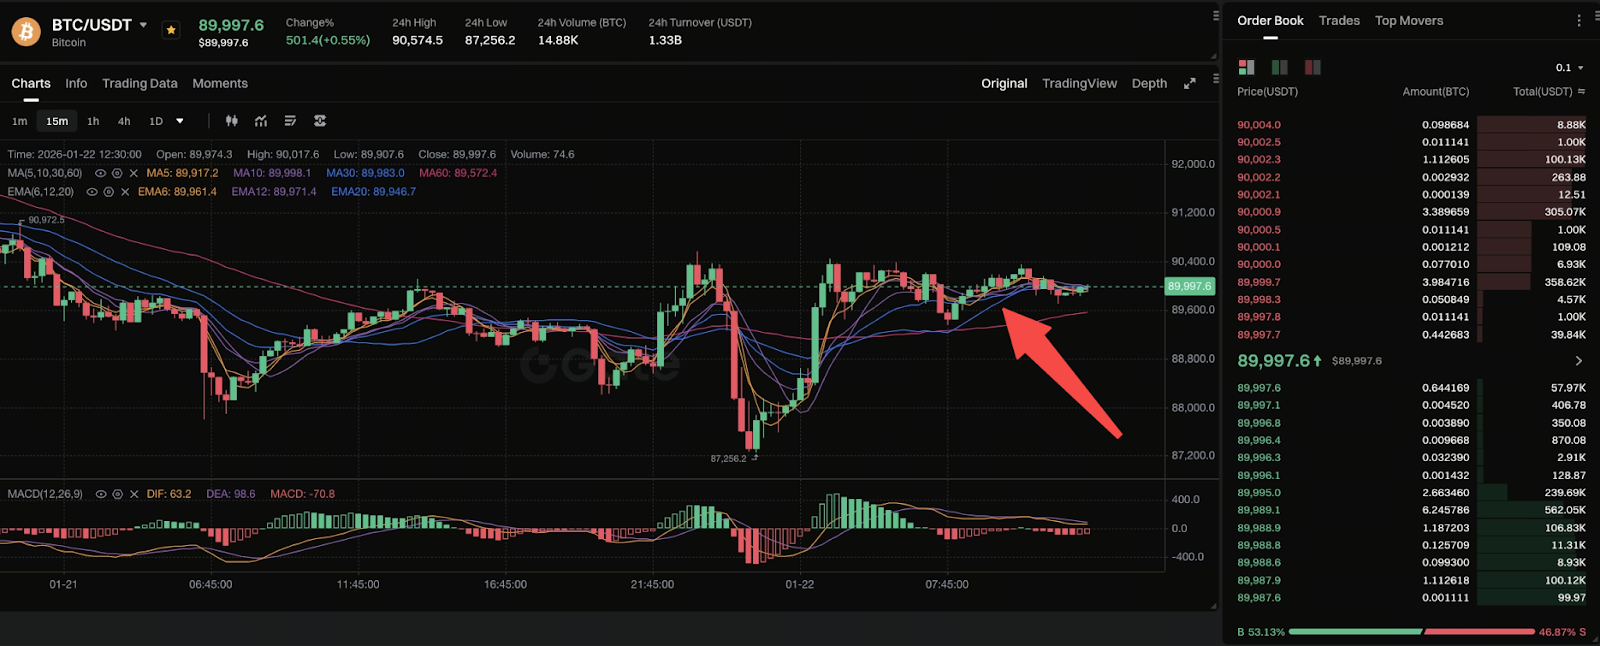
Source: https://www.gate.com/trade/BTC_USDT

The Exponential Moving Average (EMA) is a widely used trend-following indicator in crypto technical analysis. By assigning greater weight to recent price data, the EMA responds more quickly to new market developments than the Simple Moving Average (SMA), making it a more sensitive tool for detecting trend changes. Traders use EMA to identify trend direction, determine support and resistance levels, and confirm trading signals. Its calculation emphasizes recent price movements, which makes EMA particularly well-suited for the volatile nature of crypto markets.

In practice, traders often track multiple EMA timeframes—such as EMA 21, 50, 99, and 200—to assess the relationship between short-term and long-term trends. When a short-term EMA crosses above a long-term EMA, it’s typically seen as a bullish signal. Conversely, a short-term EMA crossing below a long-term EMA may indicate a bearish trend.

The Role of EMA in Crypto Technical Analysis

In the crypto market, EMA is more than a line on a chart—it’s a crucial tool that reflects the collective actions of market participants. Recent analysis highlights EMA as a dynamic support and resistance level watched by thousands of traders. During bull markets, EMA can serve as a support for upward movement, while in bear markets it often acts as resistance.

The main advantage of EMA is its ability to react quickly to recent price changes, which is especially important in crypto markets. During periods of rapid price movement, EMA can signal potential trend reversals earlier, offering practical value for short-term traders seeking optimal entry and exit points.

Moreover, combining EMA with other indicators like MACD and RSI helps filter out noise from single indicator signals and improves the reliability of trading signals. EMA is also a direct component of momentum indicators such as MACD, making it a vital part of any technical analysis framework.

BTC and ETH: Latest Price Trends and EMA Relationships

Recent data indicates that Bitcoin has shown several important EMA-related signals from a technical standpoint. For instance, BTC’s price recently broke above the 200-day EMA, which the market interprets as a sign that it may be emerging from previous bear market pressure—often considered an initial confirmation of a long-term trend reversal.

Other market reports reveal that BTC has tested multiple EMA support and resistance levels during recent price swings. The roles of the 100-day EMA and 50-day EMA as support and resistance for BTC have been especially prominent, making these EMA levels key technical reference points for traders.

For Ethereum (ETH), technical analysis shows its price has repeatedly stayed above major EMAs, forming structural support and suggesting a healthy pullback range. This indicates that ETH may continue an upward trend with EMA support.

Overall, the relationship between BTC, ETH, and major EMA lines not only reflects changes in market momentum but also frequently serves as a critical basis for traders to adjust their positions.

How Can EMA Improve Your Trading Strategy?

If you’re looking to use EMA in your trading, consider these approaches:

  • Multi-timeframe EMA analysis: Track crossover relationships between short-term (e.g., EMA 21/50) and long-term (EMA 99/200) EMAs to identify signals of trend reversal or continuation.
  • Combine with trend confirmation indicators: Use RSI and MACD to filter out potential noise and strengthen the reliability of trend signals.
  • Support and resistance confirmation: When price repeatedly tests near an EMA, treat the EMA as a dynamic support or resistance level for risk management.
  • Quantitative risk management: Integrate EMA signals into your stop-loss or target settings to enhance trading discipline and risk control.

Using these methods, EMA becomes not just a trend indicator but a core component of trading strategies, enabling more structured and systematic market analysis.

Risk Warnings and Practical Advice

While EMA is highly valuable in technical analysis, keep these considerations in mind during real-world trading:

  • EMA is not a catch-all indicator: Markets often experience consolidation periods, where EMA signals may generate significant noise.
  • Incorporate fundamental dynamics: Changes in regulatory policy and macroeconomic data can also have a major impact on crypto prices.
  • Prioritize risk management: Never rely solely on EMA for trading decisions. Always combine it with position management and stop-loss strategies.
Author: Max
Disclaimer
* The information is not intended to be and does not constitute financial advice or any other recommendation of any sort offered or endorsed by Gate.
* This article may not be reproduced, transmitted or copied without referencing Gate. Contravention is an infringement of Copyright Act and may be subject to legal action.

Related Articles

What is Fartcoin? All You Need to Know About FARTCOIN
Intermediate

What is Fartcoin? All You Need to Know About FARTCOIN

Fartcoin (FARTCOIN) is a representative meme coin within the Solana ecosystem based on an AI-driven narrative. Its core concept originated from an experiment aimed at exploring the "boundaries between AI Agents and humor." More than just a digital asset with social attributes, the project deeply couples absurd humor culture with on-chain financial logic by integrating autonomous AI interaction models.
2026-04-04 22:01:19
Gold Price Forecast for the Next Five Years: 2026–2030 Trend Outlook and Investment Implications, Could It Reach $6,000?
Beginner

Gold Price Forecast for the Next Five Years: 2026–2030 Trend Outlook and Investment Implications, Could It Reach $6,000?

Analyze current gold price trends alongside authoritative five-year forecasts, integrating an evaluation of market risks and opportunities. This gives investors insight into the potential trajectory of gold prices and the main drivers expected to shape the market over the next five years.
2026-03-25 18:13:30
Aster vs Hyperliquid: Which Perp DEX Will Prevail?
Beginner

Aster vs Hyperliquid: Which Perp DEX Will Prevail?

Aster and Hyperliquid are the two representative protocols of the "purpose-built L1 path" within the current decentralized perpetual exchange (Perp DEX) sector. As a pioneer in the field, Hyperliquid has built a deep liquidity moat through its highly mature order book architecture and strong community consensus. Conversely, Aster, as a rising challenger, seeks to leapfrog the competition in high-performance trading through more aggressive multi-chain aggregation logic, private transaction modules, and an underlying execution environment optimized for 2026 market demands.
2026-03-24 11:58:33
AI-Native Settlement Layers: How United Stables Is Building the Next Financial Rail
Beginner

AI-Native Settlement Layers: How United Stables Is Building the Next Financial Rail

Stablecoins were originally designed as dollar substitutes within exchanges, primarily used for asset pricing and trade settlement. As on-chain financial ecosystems have matured, their role has expanded beyond simple payments to include collateral assets, cross-chain liquidity mediums, and unified settlement units. In particular, as AI systems and automated agents begin to participate directly in economic activity, demand has risen sharply for programmable value units capable of instant settlement. This shift is pushing stablecoins toward the role of foundational financial infrastructure.
2026-03-25 03:16:17
ASTER Tokenomics: Buybacks, Burns, and Staking as the Value Foundation of ASTER in 2026
Beginner

ASTER Tokenomics: Buybacks, Burns, and Staking as the Value Foundation of ASTER in 2026

ASTER is the native equity and governance token of the Aster ecosystem, with its core value built upon a radical "Deflationary Engine." Beyond serving as a governance tool, ASTER integrates multiple utilities including staking rewards, trading fee discounts, and liquidity incentives. Through its deep integration with the upcoming dedicated Layer 1 mainnet, it enables direct value capture from protocol cash flow to token holders.
2026-03-25 07:38:07
Hybrid Collateral Stablecoins: Inside United Stables' Stability and Yield Architecture
Beginner

Hybrid Collateral Stablecoins: Inside United Stables' Stability and Yield Architecture

In the early stages of the crypto market, traditional stablecoins mainly relied on single-reserve or single-collateral models. Their primary focus was price stability and payment convenience, which allowed them to become foundational tools for on-chain trading and capital flows. As the market has entered a more mature financial phase, however, this structure has begun to reveal limitations, including high concentration risk and the difficulty of balancing liquidity with yield. These constraints have driven the evolution toward multi-layer collateral and portfolio-based designs, such as the dual-layer hybrid collateral architecture proposed by United Stables, which seeks to redefine the underlying logic of stable assets.
2026-03-25 03:17:39