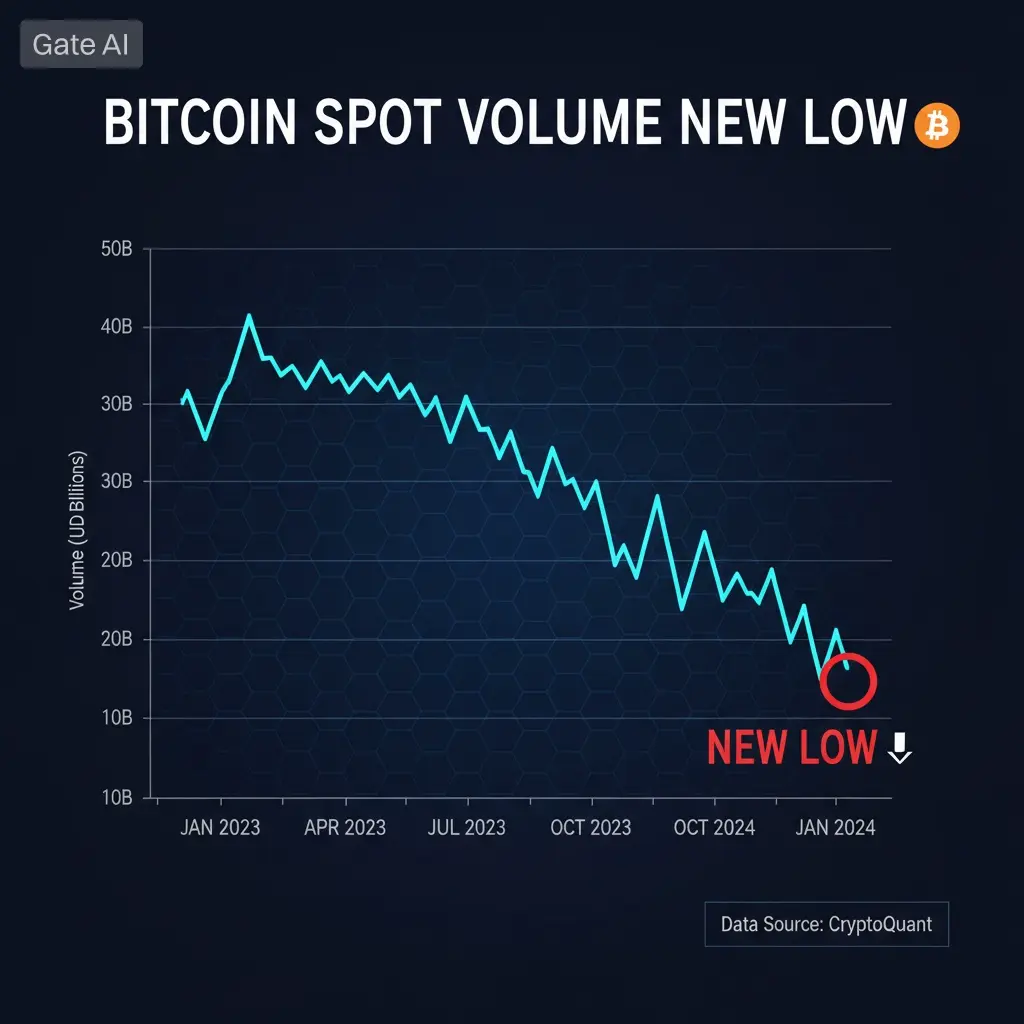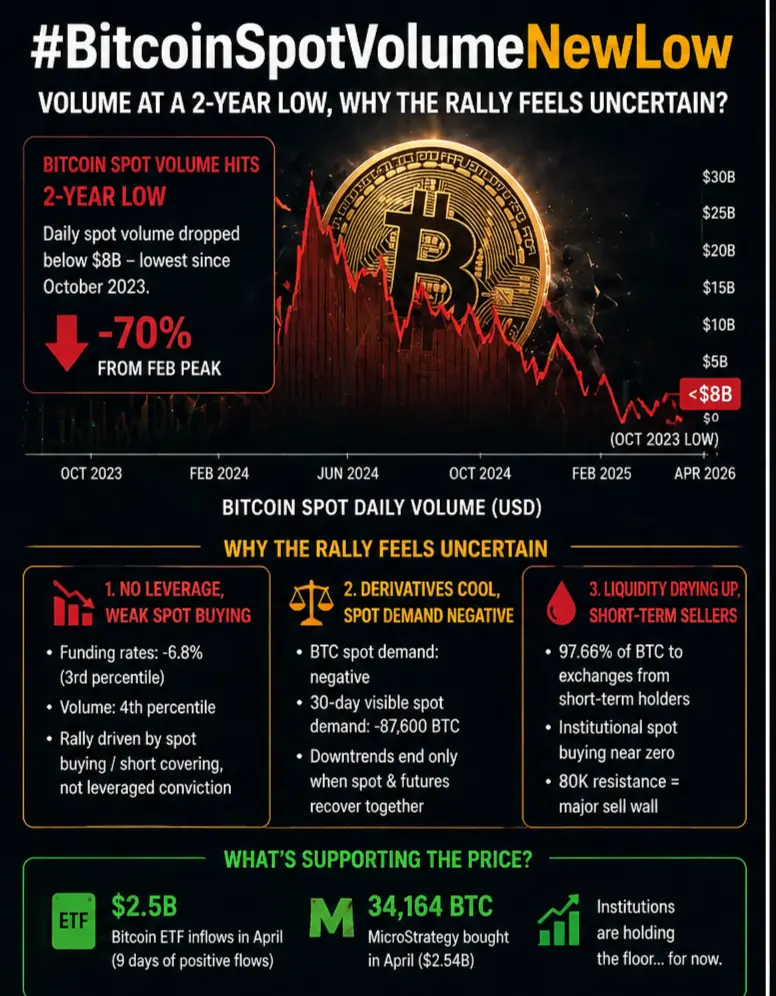


#BitcoinSpotVolumeNewLow #比特币现货交易量新低 Bitcoin BTC/ETH consolidating with decreasing volume, approaching a turning point
1. Macro key signals (impacting today’s market)
1. The Federal Reserve maintaining interest rates + Wosh’s nomination advancing: Short-term liquidity expectations are neutral to slightly warm, but the rate cut window is delayed until after June, institutions are reluctant to chase high, favoring “buy on pullback.”
2. Tensions between the US and Iran + increased geopolitical risk aversion: Gold and US Treasuries slightly strengthen, crypto market risk sentiment rises, high-position funds are more willing to take profits.
3. Key milestone on May 5th: Trump’s “Bitcoin Strategic Reserve” executive order approaches: Market anticipates pre-emptive betting, large fluctuations may occur in early May.
4. Spot BTC ETF net inflow in April hits a new high since October last year: Institutional long-term buying logic remains unchanged, pullbacks are buying opportunities (consensus among big influencers).
2. BTC Market Analysis (mainstream opinion from influencers: oscillating bottoming, waiting for a breakout)
Core support: $75,500 (20/100-day moving averages + historically dense buy zone, about 298k BTC accumulated here), as long as it holds, the bullish structure remains intact.
Strong resistance: $77,150, a daily close above can see a rebound to $77,500; $79,500 is April’s high, a breakout opens the door to $80k range.
Consensus among influencers: narrow oscillation between $75,500–$77,000, a breakout could happen within the next two days; a break below $75,500 targets $74,000, losing $73,000 would break the uptrend.
Trading suggestion: Hold spot, buy on dips in batches; wait-and-see on futures, add longs after breaking $77,150, stop-loss and exit if below $75,500.
3. ETH Market Analysis (mainstream influencer view: weak, rebound is shorting opportunity)
Core support: $2,220, if broken look to $2,180, strong support at $2,120.
Strong resistance: $2,330–$2,350 (21-day moving average + EMA50 resistance), only a volume breakout above $2,400 targets $2,500–$2,550.
Influencer consensus: ETH is clearly weaker than BTC, MACD on hourly chart shows strong bearish momentum, rebounds are opportunities to short; do not hold longs below $2,350.
Trading suggestion: Hold spot for now, no bottom-fishing; on futures, short lightly on rebounds between $2,330–$2,350, stop-loss above $2,400.
4. Gold Market Analysis
News interpretation:
The Fed is hawkish, delaying rate cuts, US Treasury yields strengthen, dollar strengthens; oil prices push inflation persistence, suppressing rate cuts; short-term funds take profits, ETF slightly outflows.
In the short term, high interest rate expectations suppress gold, but medium to long-term geopolitical tensions + central bank gold purchases still support prices.
Technical analysis: Daily chart continues downward, yesterday closed with a bearish candle with a lower shadow, emphasizing that around 4520 is a good level for northbound moves, and this dense zone is still relevant. Despite negative news, buy orders in this area are strong, and there is a bullish divergence on the hourly chart, indicating momentum is gradually digesting. The rebound strength appears weak on the market; focus on the 4480–4520 zone today. Use this zone for a medium-term bullish outlook, and after news shocks, the market will gradually calm down. The subsequent process may involve sideways correction, with upward movement requiring time. Wait patiently, with strategy to buy north of 4520, with support at 4460, and targets at 4600–4700–4800–5000 (can hold positions).
Disclaimer: The above information is for reference only, not trading advice. Cryptocurrency markets are high risk; participation should be cautious.