
Key Takeaways
-
Algorand (ALGO) is consolidating after a 13% decline over the past 60 days, while showing stabilization in the last month.
-
The daily chart reveals a repeating bullish fractal, similar to the setup that triggered ALGO’s 300% rally in November 2024.
-
Price is holding inside a long-term accumulation zone between $0.11 and $0.1530.
-
The 200-day moving average near $0.1912 is acting as key resistance and breakout confirmation level.
-
A successful reclaim of the 200 MA could open the path toward $0.60 and the ascending resistance trendline, while a drop below $0.11 would invalidate the bullish setup.
ALGO, the native token of Algorand’s Layer-1 blockchain, has shown steady but muted momentum over the past 30 days, helping slow down its broader correction. Despite this stabilization, ALGO remains down more than 13% over the last 60 days, keeping sentiment cautious across the market.
That said, when looking beyond short-term price noise, the daily chart is beginning to tell a familiar story. The current structure closely resembles a bullish fractal that, in the past, preceded a powerful breakout rally—raising an important question for traders: is this just consolidation, or a quiet accumulation phase before the next move?
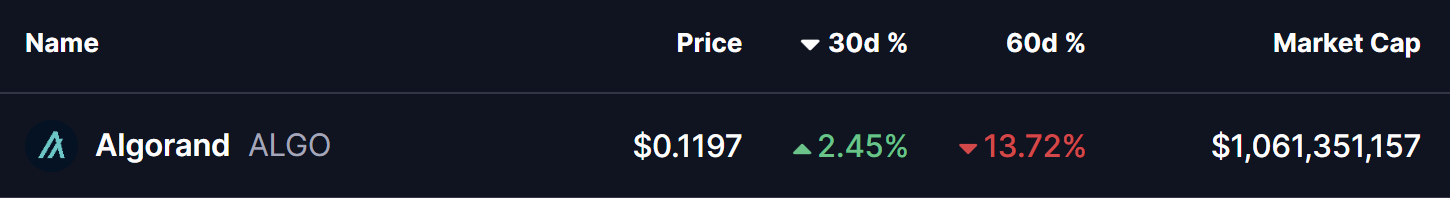
Source: Coinmarketcap
Fractal Setup Hints at a Bullish Reversal
On the daily timeframe, ALGO is displaying early signs of a repeating bullish structure, built around three key technical elements:
-
A rejection from the long-term ascending resistance trendline
-
A prolonged accumulation zone at major historical support
-
A potential reclaim of the 200-day moving average
The current corrective phase began in December 2024, when ALGO was rejected near the ascending resistance trendline around $0.60. That rejection triggered a deep pullback of more than 80%, eventually driving price back into the long-term demand zone between $0.11 and $0.1530—a region that has repeatedly acted as an accumulation area on the chart.
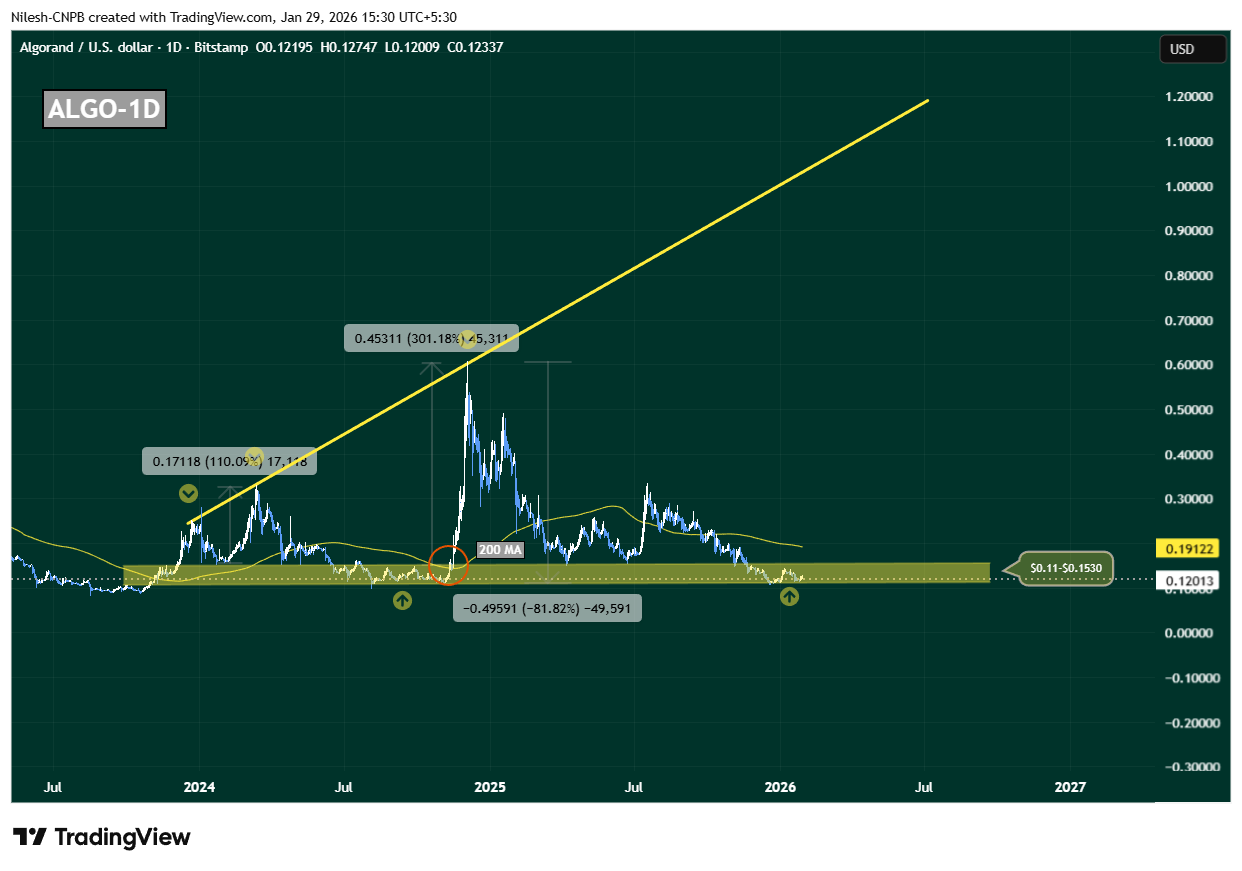
Algorand (ALGO) Daily Chart/Coinsprobe (Source: Tradingview)
This zone is not just technically important; it has also served as a launchpad during previous cycles, where downside momentum stalled and long-term buyers quietly stepped in.
History Rhymes on the ALGO Chart
What makes this setup particularly compelling is how closely it mirrors November 2024’s breakout structure. Back then, ALGO spent extended time consolidating near the same support band before reclaiming the 200-day moving average. Once that level flipped into support, price accelerated sharply—resulting in a 300% rally toward the ascending resistance trendline.
Today, ALGO is once again compressing inside this accumulation range, while the 200-day moving average sits overhead near $0.1912, acting as dynamic resistance. This alignment suggests the market may be approaching another inflection point.
What’s Next for ALGO?
At present, ALGO is hovering near $0.12, firmly inside its long-term accumulation zone. As long as price holds above this region, the broader bullish fractal remains intact.
A clean and sustained reclaim of the 200-day moving average around $0.1912 would be a critical confirmation signal. If bulls manage to flip this level into support, it would closely replicate previous breakout conditions and could trigger a sharp upside expansion. In that scenario, $0.60 becomes a realistic medium-term target, with further upside possible toward the ascending resistance trendline if momentum builds.
However, the structure is not without risk. A decisive breakdown below $0.11 would weaken the accumulation thesis, signal loss of long-term support, and open the door for deeper downside.
For now, ALGO sits at a make-or-break zone. The chart suggests patience is key—but if history repeats, this quiet phase may not last much longer.
Disclaimer: The views and analysis presented in this article are for informational purposes only and reflect the author’s perspective, not financial advice. Technical patterns and indicators discussed are subject to market volatility and may or may not yield the anticipated results. Investors are advised to exercise caution, conduct independent research, and make decisions aligned with their individual risk tolerance.
About Author: Nilesh Hembade is the Founder and Lead Author of Coinsprobe, with over 5 years of experience in the cryptocurrency and blockchain industry. Since launching Coinsprobe in 2023, he has been providing daily, research-driven insights through in-depth market analysis, on-chain data, and technical research.
Disclaimer: The information on this page may come from third parties and does not represent the views or opinions of Gate. The content displayed on this page is for reference only and does not constitute any financial, investment, or legal advice. Gate does not guarantee the accuracy or completeness of the information and shall not be liable for any losses arising from the use of this information. Virtual asset investments carry high risks and are subject to significant price volatility. You may lose all of your invested principal. Please fully understand the relevant risks and make prudent decisions based on your own financial situation and risk tolerance. For details, please refer to
Disclaimer.
Articoli correlati
Arthur Hayes:比特币长期目标价25万至75万美元,短期或跌破6万美元
Arthur Hayes在播客中表示,由于美联储未扩大流动性,他不会投入更多资金于比特币,预计中长期目标价在25万至75万美元。他警告若美伊冲突持续,比特币短期可能跌破6万美元。同时,Charles Schwab将推出比特币和以太坊现货交易。研究显示,比特币在重大冲击后表现优于黄金和标普500,目前价格回升至67300美元。
GateNews3h fa
加密货币恐慌与贪婪指数今日升至 13,市场仍处极度恐慌状态
Gate News 消息,4 月 6 日,据 Alternative.me 数据显示,今日加密货币恐慌与贪婪指数升至 13,较昨日的 12 小幅上升 1 个点。尽管指数有所回升,但市场情绪仍处于「极度恐慌状态」。
GateNews3h fa
Michael Saylor bác bỏ cảnh báo 'MSTR sụp đổ' của Schiff, chỉ ra lợi nhuận 36% hàng năm từ Bitcoin
Michael Saylor, CEO of MicroStrategy, defends the company's Bitcoin strategy against investor Peter Schiff's warning about MSTR stock. Despite losses, Saylor emphasizes Bitcoin's superior performance compared to gold and the S&P 500 since 2020.
TapChiBitcoin3h fa
BTC 15分钟上涨0.79%:机构撤离与结构性资金流出主导盘面波动
2026-04-05 22:30 至 2026-04-05 22:45(UTC),BTC价格在67416.0至67986.7 USDT区间波动,15分钟内收益率达到+0.79%,振幅为0.85%。盘面快速异动引发市场关注,波动加剧但整体交易量未出现极端放大,情绪以谨慎和波动为主。
本次异动的主要驱动力是机构资金持续撤离以及大额资金向交易所外净流出。链上数据显示,24小时全网BTC净流出达-2,1
GateNews4h fa
Bitcoin tends to outperform gold and stocks after global shocks, Mercado Bitcoin finds
Bitcoin BTC$67,345.02 tends to outperform traditional safe haven assets like gold in the two months following major global crises, according to new analysis from Brazilian crypto exchange Mercado Bitcoin.
The study, led by Rony Szuster, head of research at the Latin American crypto platform,
CoinDesk7h fa
SHIB Holds Weak Range as Burn Rate Drops and Pressure Builds
Key Insights
SHIB remains within a long-standing descending channel, with price stuck in the lower range and unable to break persistent resistance levels.
The burn rate dropped sharply, removing a short-term support factor and reducing retail-driven momentum seen earlier during increased
CryptoNewsLand7h fa
