
The Kaspa (KAS) price has been stuck for weeks, frustrating traders looking for a clear direction. After a long decline from earlier highs, KAS is no longer accelerating lower, but it is also not breaking out.
Instead, price is hovering around the same levels, printing repeated tests of support with muted reactions.
According to analyst EliZ, this type of behavior is not random. He describes the current phase as “construction,” a period where selling pressure is absorbed rather than expanded.
- What the KAS Chart Is Showing
- Why the “Green Box” Matters For KAS Price
- KAS Price Key Levels to Watch
What the KAS Chart Is Showing
On the higher timeframes, the KAS price has been trending lower for months, but the recent structure looks different from earlier sell-offs. Price continues to dip below prior lows, yet each move is quickly bought back. There is no follow-through, no sharp continuation, and no panic expansion to the downside.
This repeated behavior suggests absorption. Sellers are still present, but they are being met by steady demand in the same area.
The Kaspa chart shows price compressing below a descending trendline, with multiple failed attempts to push lower. That compression is happening inside a clearly defined support zone, marked by the green box on the 2D chart. So far, that zone has held.

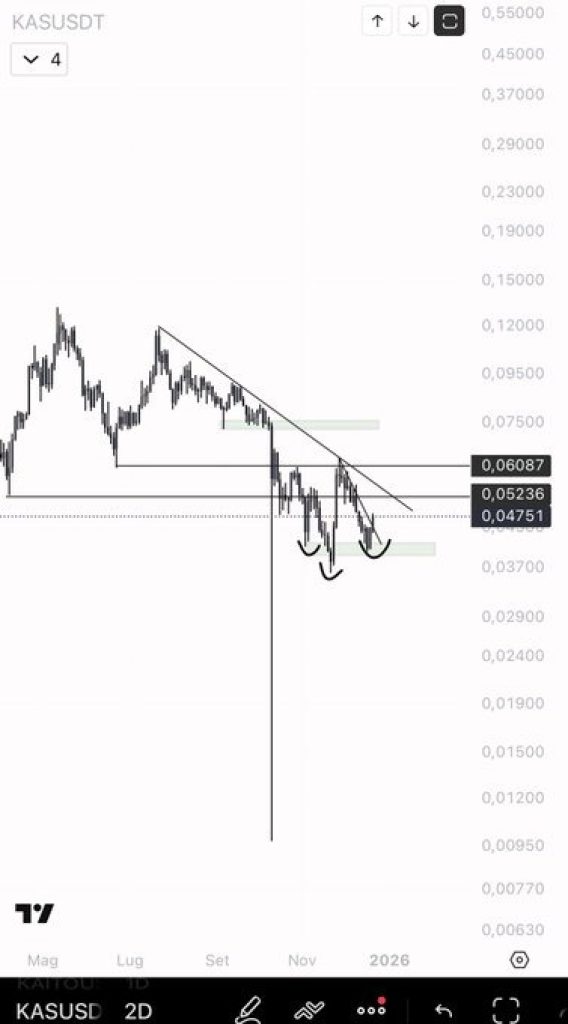
Source: X/Eliz
Why the “Green Box” Matters For KAS Price
EliZ points out that as long as the green box holds on the 2-day timeframe, the current price action remains constructive. The market is not breaking out, but it is also not collapsing. This is often how accumulation phases look before expansion begins.
In past cycles, similar Kaspa structures showed slow grinding action, small breakdowns that failed to accelerate, and long periods of boredom. When selling finally stopped, price expanded quickly and without much warning.
That does not guarantee the same outcome here, but the similarity in structure is what makes this zone important.
_Read Also: _****Here’s Why Audiera (BEAT) Price Is Pumping Today
KAS Price Key Levels to Watch
The green box acts as the main line in the sand. As long as price holds above it, the current range can be viewed as absorption rather than distribution. A sustained hold keeps the broader setup intact, even if short-term volatility continues below resistance.
If the Kaspa price loses that support decisively, the construction thesis breaks down. A clean move below the green box would invalidate the setup and likely open the door to another leg lower.
On the upside, KAS still needs to reclaim the descending trendline and previous range highs before any bullish continuation can be confirmed.
Right now, the Kaspa price is not offering clear trend signals. Instead, it is offering information. The lack of downside follow-through, combined with repeated absorption at the same levels, suggests the market is building something rather than breaking apart.
As EliZ notes, this phase does not force a move higher, but it also does not point to collapse. Until price either escapes the range or loses the green box, patience matters more than prediction. For now, KAS remains in construction mode.
Disclaimer: The information on this page may come from third parties and does not represent the views or opinions of Gate. The content displayed on this page is for reference only and does not constitute any financial, investment, or legal advice. Gate does not guarantee the accuracy or completeness of the information and shall not be liable for any losses arising from the use of this information. Virtual asset investments carry high risks and are subject to significant price volatility. You may lose all of your invested principal. Please fully understand the relevant risks and make prudent decisions based on your own financial situation and risk tolerance. For details, please refer to
Disclaimer.
Articoli correlati
分析师:4 月或成比特币关键观察期,RSI 处中性区间、波动率或抬升
4月通常是比特币表现较强的月份,历史均涨幅约11.3%。但自2020年以来,该规律变得不稳定。当前比特币的相对强弱指标为47%,市场情绪受地缘政治和通胀担忧影响,预示4月波动率可能上升,需关注市场能否形成明确方向。
GateNews17m fa
The Old Token Playbook Is Dead: Why Most Crypto Launches Failed in 2025
The old “token playbook” is over, according to 21Shares researcher Darius Moukhtarzade, who said that launching at high FDV, low float with a governance “meme coin” does not work anymore.
Moukhtarzade explained that there is a widening “sentiment-fundamentals gap” as the core reason behind
CryptoPotato24m fa
ETH 15分钟上涨0.62%:ETF净流入与流动性收紧共振驱动短线走强
2026-04-01 03:00至03:15(UTC),ETH价格出现异动,区间收益率为+0.62%,K线最低点2088.43 USDT、最高点2106.93 USDT,振幅达0.89%。在加密资产普遍波动加剧的背景下,ETH短线成交活跃,链上热度提升,市场关注度明显上升。
本次异动的主要驱动力是美国现货ETF资金净流入持续放大,ETF净流入在4月初延续3月底的强劲势头,带动ETH现货需求显著上
GateNews1h fa
比特币逼近关键“买入区”?链上数据揭示BTC真实底部信号仍未出现
比特币价格接近市场关注的“买入区域”,但底部信号尚未完全形成,目前价格高于成本区间,表明市场尚未经历重大清理。溢价持续收窄,反映出泡沫正在消化。尽管短期内市场可能面临压力,仍有资金提前布局,显示出对未来前景的乐观。
GateNews1h fa
分析師:比特幣供應結構「易手」,巨鯨與企業交易脫鉤
XWIN Research 的分析指出,比特幣在 2026 年第一季經歷結構性供應轉移,交易所巨鯨比率上升,顯示大型持有者正出售比特幣,而上市公司如微策略等卻凈增持 62,000 枚比特幣。市場呈現交易所巨鯨和企業囤積的二元化趨勢,供應從早期投資者轉移到企業資產負債表上,並且市場流動性未能顯著改善。
MarketWhisper1h fa
Bitcoin’s Most Dangerous Pattern Just Triggered: Will BTC Dump to $26K Next?
Although bitcoin has already dumped by over 50% from its all-time high of over $126,000 marked in October to a multi-year low of $60,000, the asset’s troubles might not be over, warned Merlijn The Trader.
The popular analyst indicated that the “most dangerous bitcoin pattern just completed phase
CryptoPotato2h fa
