Date: Sun, Dec 21 2025 | 12:15 PM GMT
The broader cryptocurrency market is showing relative strength over the weekend, with both Bitcoin (BTC) and Ethereum (ETH) trading in the green. This stability in the majors has helped lift sentiment across the altcoin space, and Kaspa (KAS) is beginning to respond positively.
KAS is up more than 4% on the day, and more importantly, its recent price action is starting to outline a clear technical structure. The 4-hour chart suggests that a harmonic pattern is developing, hinting that KAS could be setting up for another upside attempt if key levels are reclaimed.
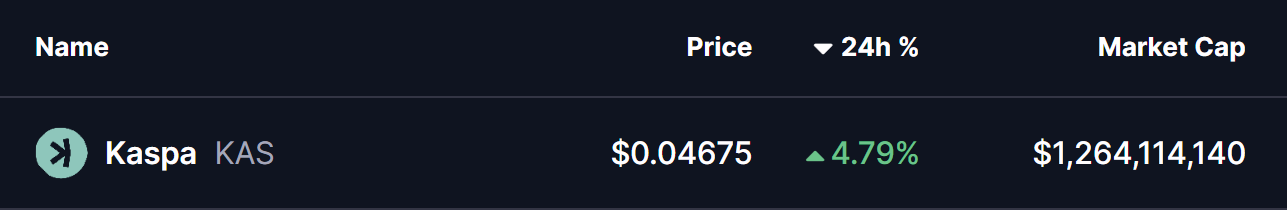
Source: Coinmarketcap
Harmonic Pattern Taking Shape
On the 4-hour timeframe, KAS appears to be forming a Bearish ABCD harmonic pattern. Despite the bearish label, this setup often delivers a strong bullish CD-leg before price reaches the Potential Reversal Zone (PRZ). This interim rally is typically the most aggressive phase of the structure, and that is the move currently unfolding.
The pattern began with a sharp advance from point A near $0.0360 to point B, marking KAS’s initial impulse higher. This was followed by a corrective pullback into point C around $0.0400, where downside momentum stalled and buyers stepped in decisively. The defense of this level suggests that selling pressure is weakening and that demand is beginning to build.
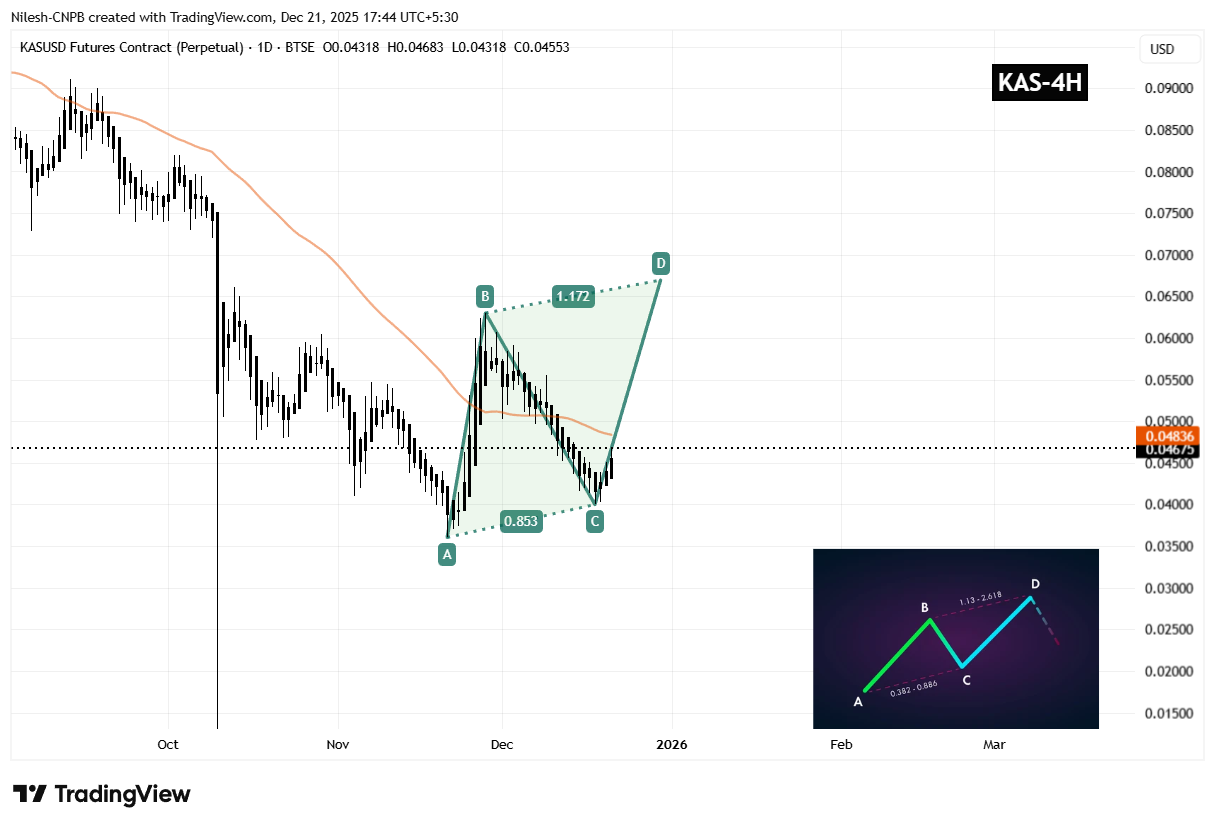
Kaspa (KAS) 4H Chart/Coinsprobe (Source: Tradingview)
Since bouncing from point C, KAS has pushed back toward the $0.046–$0.047 region, signaling the early stages of the CD-leg. This recovery phase indicates improving short-term momentum as the market tests overhead resistance.
A key technical obstacle now lies at the 50-period moving average, currently near $0.0484. This level has acted as dynamic resistance throughout the recent downtrend, and price is now compressing just below it. A clean breakout and sustained close above the 50 MA would be an important confirmation that bulls are regaining control and that the harmonic structure is progressing as expected.
What’s Next for KAS?
If buyers can drive KAS above the 50 MA and maintain momentum, the next upside objective aligns with the harmonic PRZ near the 1.17 Fibonacci extension around $0.0670. Reaching this zone would complete the ABCD pattern and represent a potential upside of roughly 40%–45% from current levels.
That said, the bullish scenario remains conditional. A failure to break above the 50 MA, followed by a drop back below the C-leg support near $0.0400, would weaken the harmonic setup and reopen the door for renewed bearish pressure.
For now, the structure on the chart suggests KAS is at a technically important inflection point. As long as price continues to hold above recent lows and challenge key resistance levels, the path of least resistance may remain tilted to the upside in the short term.
Disclaimer: The views and analysis presented in this article are for informational purposes only and reflect the author’s perspective, not financial advice. Technical patterns and indicators discussed are subject to market volatility and may or may not yield the anticipated results. Investors are advised to exercise caution, conduct independent research, and make decisions aligned with their individual risk tolerance.
Disclaimer: The information on this page may come from third parties and does not represent the views or opinions of Gate. The content displayed on this page is for reference only and does not constitute any financial, investment, or legal advice. Gate does not guarantee the accuracy or completeness of the information and shall not be liable for any losses arising from the use of this information. Virtual asset investments carry high risks and are subject to significant price volatility. You may lose all of your invested principal. Please fully understand the relevant risks and make prudent decisions based on your own financial situation and risk tolerance. For details, please refer to
Disclaimer.
Articoli correlati
XRP Surpasses BNB Amid Altcoin Crash, BTC Price Dropped by $3K: Market Watch
Bitcoin experienced a decline to just over $66,000 after being rejected at $69,200, influenced by geopolitical tensions. Altcoins, including Ethereum and Solana, also fell, while XRP surpassed BNB in market cap. The total crypto market cap dropped significantly but has since rebounded.
CryptoPotato29m fa
特朗普称霍尔木兹海峡将“自然开放”,市场避险情绪升温
特朗普在讲话中称美军将完成对伊朗的战略任务,引发市场谨慎反应,布伦特原油价格攀升,股市下行,避险情绪加剧。伊朗立场强硬,明确收取通行费,局势依然不明朗,地缘政治风险可能持续影响市场。
GateNews37m fa
Circle股价暴跌背后真相曝光:监管重定价+竞争升级,稳定币格局生变
Circle(CRCL)股价持续走弱,受到监管重定价等多重因素影响,市场对其盈利能力进行重新评估。同时,Tether市场扩张加剧竞争,影响Circle的市场份额。获利回吐和策略性减仓导致价格波动,反映出加密行业的深层变化,市场逐渐转向基本面驱动。
GateNews45m fa
比特币需求转负引发警报:巨鲸持续减持,抛压或压制反弹空间
2026年4月,比特币在连续五个月回调后企稳,但需求疲软,表观需求为负,市场抛压高于买盘。大型矿企及资产管理机构的比特币转移被视为卖压信号,巨鲸群体转为减持,散户抛售更显著,市场供需失衡,短期反弹空间有限。
GateNews49m fa
Bearish Analyst Declares Q2 2026 to Be a Bloody One for the Crypto Market
Bearish analyst declares Q2 2026 to be a bloody one for the crypto market.
He expects the price of BTC to likely set a bottom during this time.
He calls for an inevitable recession as oil prices could surge.
As the new month and start of Q2 2026 kick off, differing expectations take
CryptoNewsLand57m fa
Bitcoin Barely Avoids Equaling Worst Red Monthly Streak: What’s Next for April?
After another volatile month fueled by the war moves in the Middle East, bitcoin managed to scrape above the surface at the end and finished with a minor increase.
The focus has now turned to April and Q2, and _CryptoPotato_ turned to a leading expert about their take on the matter and what
CryptoPotato1h fa
