POOL vs RUNE: A Comprehensive Comparison of Two Leading DeFi Liquidity Protocols

Introduction: Investment Comparison Between POOL and RUNE
In the cryptocurrency market, comparing POOL vs RUNE is a topic that investors cannot avoid. The two not only show significant differences in market capitalization ranking, application scenarios, and price performance, but also represent different positioning of crypto assets. PoolTogether (POOL): Since its launch in 2021, it has gained market recognition by offering a lossless lottery protocol where users deposit funds to participate in periodic prize draws funded by DeFi platform yields. RUNE (RUNE): Since its inception in 2019, it has been recognized as the native token of THORChain, a highly optimized multi-chain network that facilitates cross-chain transactions and order matching while providing staking rewards to token holders. This article will comprehensively analyze the investment value comparison between POOL and RUNE from multiple perspectives including historical price trends, supply mechanisms, and technical ecosystems, while attempting to answer the most pressing question investors have:
"Which is the better buy right now?"
Comparative Analysis Report: PoolTogether (POOL) vs THORChain (RUNE)
I. Historical Price Comparison and Current Market Status
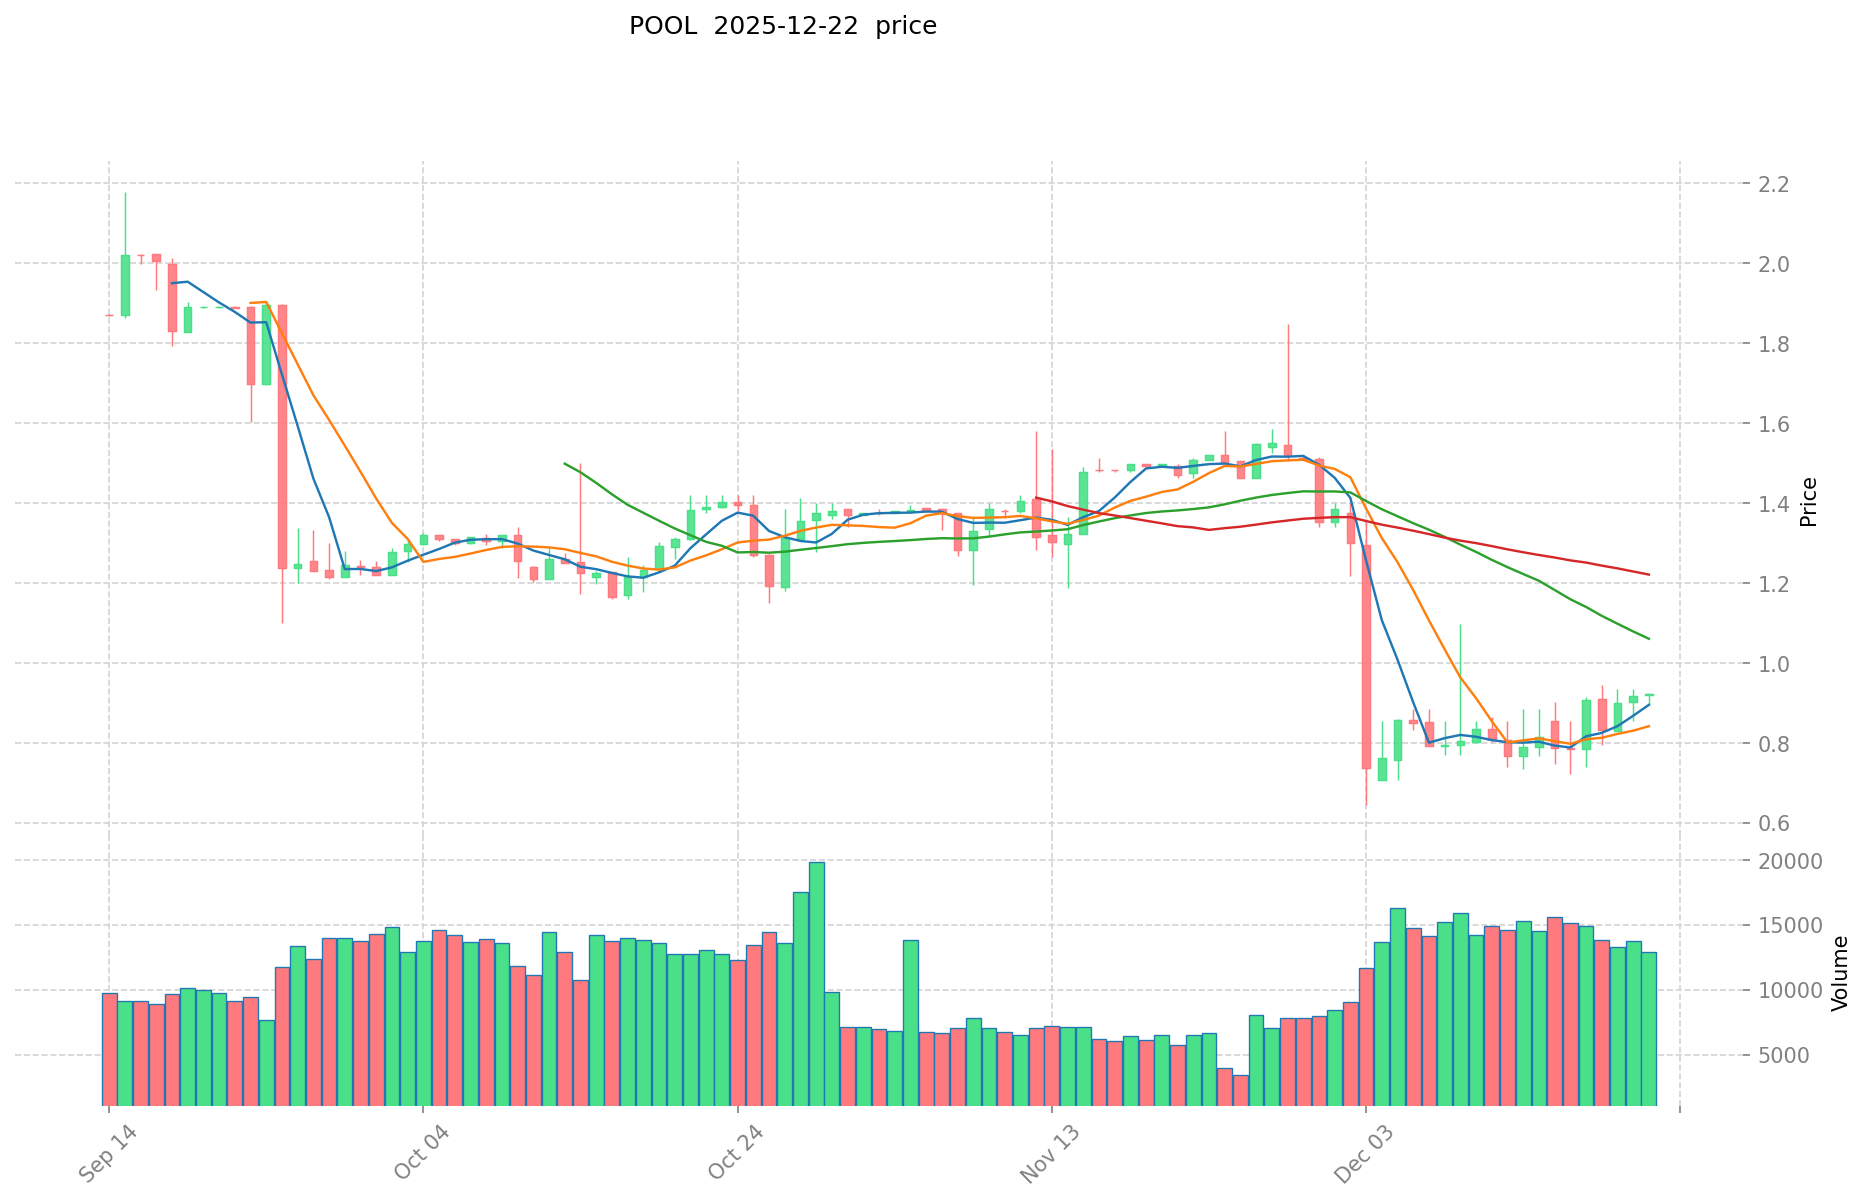
Price Trajectory of POOL and RUNE
PoolTogether (POOL):
- All-Time High (ATH): $53.98 on February 20, 2021
- All-Time Low (ATL): $0.089838 on December 2, 2025
- Historical Decline: From ATH to current price represents a significant contraction in asset valuation
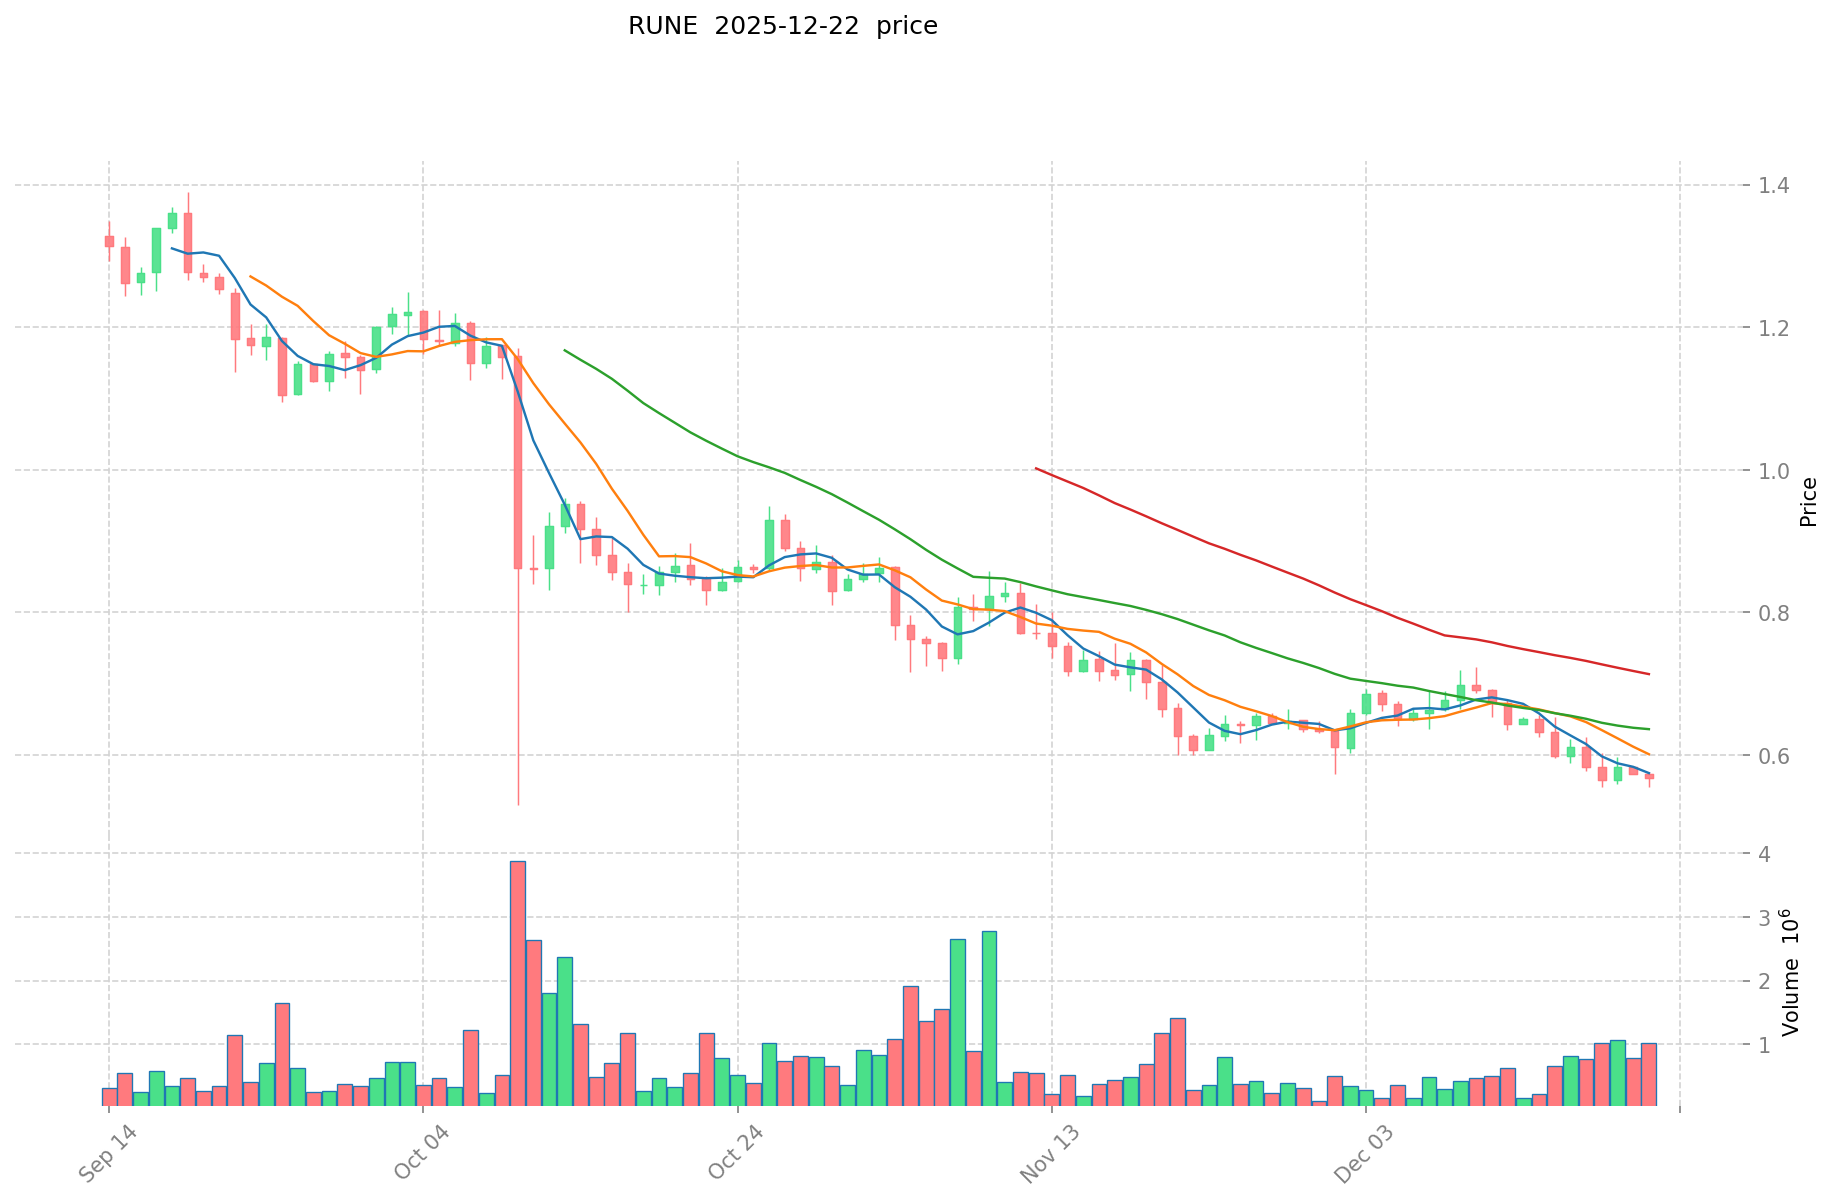
THORChain (RUNE):
- All-Time High (ATH): $20.87 on May 19, 2021
- All-Time Low (ATL): $0.00851264 on September 28, 2019
- Historical Performance: Despite earlier lows, RUNE has recovered substantially from its inception phase
Current Market Status (December 23, 2025)
PoolTogether (POOL):
- Current Price: $0.9214
- 24-Hour Change: +0.2%
- 24-Hour Trading Volume: $11,413.99
- Circulating Supply: 7,172,433.99 POOL
- Market Capitalization: $6,608,680.68
- Market Ranking: 1,376
THORChain (RUNE):
- Current Price: $0.5758
- 24-Hour Change: +2.51%
- 24-Hour Trading Volume: $553,152.93
- Circulating Supply: 351,052,614 RUNE
- Market Capitalization: $202,136,095.14
- Market Ranking: 224
Price Movement Analysis
| Time Period | POOL | RUNE |
|---|---|---|
| 1 Hour | -0.050% | +0.28% |
| 24 Hours | +0.2% | +2.51% |
| 7 Days | +17.2% | -4.77% |
| 30 Days | -39.06% | -4.61% |
| 1 Year | -65.49% | -88.42% |
Market Sentiment Indicator
Crypto Fear & Greed Index: 25 (Extreme Fear)
This extreme fear sentiment reflects broader market pessimism and heightened risk aversion across the cryptocurrency sector.
Real-time price information:
- View POOL current price: Market Data
- View RUNE current price: Market Data
II. Project Overview and Fundamental Characteristics
PoolTogether (POOL)
Project Definition: PoolTogether is a lossless lottery protocol operating on decentralized finance infrastructure. The protocol operates without platform commission, enabling users to participate in a prize mechanism while preserving their principal investment.
Operational Mechanism:
- Users deposit funds to purchase lottery tickets
- Deposited capital is placed into DeFi platforms such as Compound to generate yield
- Prize draws occur at regular intervals
- Winners receive accumulated financial rewards from the yield generated during the deposit period
- Losers maintain their principal investment intact
Token Economics:
- Total Supply: 10,000,000 POOL
- Circulating Supply: 7,172,433.99 POOL (71.72% circulation ratio)
- Contract Address (Ethereum): 0x0cec1a9154ff802e7934fc916ed7ca50bde6844e
- Token Holders: 8,552
THORChain (RUNE)
Project Definition: THORChain is a highly optimized multi-chain protocol utilizing Byzantine Fault Tolerant (pBFT) consensus to achieve subsecond block finality. The network enables decentralized cryptocurrency liquidity through public THORNodes secured by bonded capital.
Technical Infrastructure:
- Consensus Mechanism: pBFT (Byzantine Fault Tolerant)
- Block Finality: Sub-second
- Trading Model: Supports both limit orders and market orders at protocol level
- Network Security: Secured through node capital bonding mechanism
Token Utility (RUNE):
- Network Settlement Asset: All token exchanges on THORChain must pass through RUNE
- Cross-chain Liquidity: RUNE serves as collateral for liquidity pools
- Network Security: Functions as validator collateral and network fee payment mechanism
- Block Rewards: RUNE distributed as block production incentives
- Stakeholder Distribution: RUNE holders receive network revenue distributions
Token Economics:
- Total Supply: 425,066,567 RUNE
- Maximum Supply: 500,000,000 RUNE
- Circulating Supply: 351,052,614 RUNE (70.21% circulation ratio)
- Fully Diluted Valuation: $244,753,329.28
- Current Market Cap to FDV Ratio: 70.21%
III. Comparative Valuation Metrics
Market Capitalization Comparison
| Metric | POOL | RUNE |
|---|---|---|
| Current Market Cap | $6,608,680.68 | $202,136,095.14 |
| Fully Diluted Valuation | $9,214,000.00 | $244,753,329.28 |
| Market Dominance | 0.00028% | 0.0076% |
| Market Cap to FDV Ratio | 71.72% | 70.21% |
Liquidity Assessment
PoolTogether (POOL):
- 24-Hour Volume: $11,413.99
- Volume to Market Cap Ratio: 0.173 (indicating lower liquidity)
- Market Concentration: Small holder base (8,552 addresses)
THORChain (RUNE):
- 24-Hour Volume: $553,152.93
- Volume to Market Cap Ratio: 0.273 (indicating better trading activity)
- Established Network: Larger distribution across nodes and stakers
IV. Risk Assessment and Performance Context
Volatility Profile
Both assets exhibit significant long-term depreciation relative to their historical peaks, indicating a broader downtrend from the 2021 bull market cycle.
POOL Deterioration:
- From ATH ($53.98) to current price: -98.29%
- 1-Year Performance: -65.49%
- 30-Day Performance: -39.06%
RUNE Deterioration:
- From ATH ($20.87) to current price: -97.42%
- 1-Year Performance: -88.42%
- 30-Day Performance: -4.61%
Recent Performance Divergence (7-Day Period)
POOL demonstrates stronger recent momentum with +17.2% weekly gains, while RUNE shows -4.77% decline over the same period. This divergence may indicate differential market positioning or protocol-specific developments.
V. Ecosystem and Network Characteristics
PoolTogether Ecosystem
Primary Function: Lossless yield distribution mechanism
Blockchain Integration: Ethereum-based
Ecosystem Products: Integration with Compound and other DeFi yield protocols
Market Position: Niche application focused on specific DeFi composability
THORChain Ecosystem
Primary Function: Decentralized cross-chain liquidity protocol
Network Products:
- Native wallet functionality
- Aggregator tools
- Block explorer services
- Multi-chain infrastructure
Cross-Chain Capability: Enables asset swaps across multiple blockchain networks
Market Position: Infrastructure protocol with broader multi-chain ambitions
VI. Token Distribution and Holder Concentration
POOL:
- Holders: 8,552 addresses
- Circulation: 71.72% of total supply
RUNE:
- Holders: Network distributed across validator nodes
- Circulation: 70.21% of total supply
- Economic Model: Validator bonding mechanism creates concentrated economic incentives
Conclusion
PoolTogether (POOL) represents a specialized application layer protocol focused on lossless lottery mechanisms within DeFi, characterized by smaller market capitalization and limited liquidity. THORChain (RUNE) operates as a foundational infrastructure protocol enabling cross-chain transactions, with substantially larger market capitalization and trading volume.
Both assets have experienced severe depreciation from 2021 peak valuations, reflecting broader cryptocurrency market cycles. Current market sentiment remains in "Extreme Fear" territory, suggesting heightened risk conditions for both assets. The divergent weekly performance (POOL +17.2% vs RUNE -4.77%) may warrant further observation for potential trend reversal indicators.
Report Date: December 23, 2025
RUNE Investment Value Analysis Report
Executive Summary
Based on available reference materials, this report analyzes the core investment factors influencing RUNE token value. The analysis focuses on tokenomics, institutional adoption, technological development, and macroeconomic influences that directly impact RUNE's valuation dynamics.
I. Core Investment Value Factors for RUNE
Revenue Sources for RUNE Token Holders
RUNE holders derive value from multiple revenue streams:
- Price Appreciation Gains: Buy-sell spreads on RUNE trading
- Liquidity Mining Rewards: Providing liquidity generates trading fee distributions and RUNE incentive rewards
- Staking Security Rewards: Security-related staking returns from network participation
TVL Growth as Primary Value Driver
Thorchain's Total Value Locked (TVL) growth directly drives RUNE value appreciation. The platform's economic flywheel effect—when functioning normally and absent of security incidents—generates substantial TVL expansion, potentially creating 5-10x growth opportunities during bull market cycles.
II. Core Factors Influencing RUNE Investment Value
Supply Mechanism (Tokenomics)
RUNE Supply Dynamics:
- RUNE tokenomics demonstrate deep integration with Thorchain's business model and growth potential
- Token economics structure creates direct correlation between network activity and token demand
- Supply mechanics support value accumulation through protocol participation incentives
Institutional Adoption and Market Application
Cross-Chain Infrastructure Position:
- RUNE benefits from Thorchain's positioning in the cross-chain trading sector
- Network serves as critical infrastructure for decentralized cross-chain swaps and liquidity provision
- Growing institutional interest in cross-chain DeFi solutions strengthens RUNE utility
Network Utility:
- RUNE facilitates security provisions for Thorchain's consensus mechanism
- Token represents participation rights in network economic activity
- Staking requirements create structural demand for RUNE holdings
Technology Development and Ecosystem Building
Thorchain Platform Development:
- Cross-chain liquidity protocol functionality directly supports RUNE value proposition
- Network security and operational stability directly impact token credibility
- Ecosystem expansion determines long-term revenue generation capacity
DeFi Ecosystem Positioning:
- Thorchain operates as critical infrastructure layer for cross-chain value transfer
- Platform enables decentralized liquidity provision across multiple blockchain networks
- Economic activity metrics (trading volume, liquidity depth) correlate with RUNE demand
Macroeconomic and Market Cycle Factors
Bitcoin and Ethereum Correlation:
- Reference materials indicate BTC/ETH price movements generate positive spillover effects for RUNE
- Market sentiment toward cryptocurrency valuations broadly influences RUNE price discovery
- Macroeconomic conditions affecting risk asset valuations impact RUNE dynamics
Monetary Policy Environment:
- Central bank policy stance influences broader cryptocurrency adoption trends
- Risk-on market environments generally support increased cross-chain DeFi activity
- Regulatory clarity regarding DeFi protocols affects institutional RUNE adoption rates
Market Cycle Positioning:
- RUNE valuation cycles correlate with broader cryptocurrency bull-bear cycles
- Institutional capital deployment patterns influence L1 token demand dynamics
- Network growth phases generate normalized demand periods for network participation tokens
III. Investment Thesis Summary
The primary investment thesis for RUNE centers on Thorchain's TVL expansion driving sustainable token demand growth. As the protocol accumulates greater value locked across multiple blockchains, corresponding increases in staking requirements and liquidity provision incentives create structural demand for RUNE holdings.
Key Consideration: RUNE's value proposition depends critically on continuous Thorchain ecosystem expansion and maintenance of robust cross-chain infrastructure functionality.
Disclaimer
This analysis derives exclusively from provided reference materials. Projections regarding future growth scenarios (5-10x returns) represent estimates contained within source materials and should not constitute investment guidance. Cryptocurrency investments carry substantial risk, including potential total capital loss. This report does not constitute investment advice, financial recommendation, or endorsement of any trading strategy.
III. 2025-2030 Year Price Forecast: POOL vs RUNE
Short-term Forecast (2025)
- POOL: Conservative $0.81-$0.92 | Optimistic $1.35
- RUNE: Conservative $0.44-$0.57 | Optimistic $0.64
Medium-term Forecast (2027-2028)
- POOL may enter accumulation phase, projected price range $0.76-$1.95, with potential gain of 52-63%
- RUNE may enter growth phase, projected price range $0.60-$1.00, with potential gain of 18-46%
- Key drivers: Institutional capital inflows, ETF adoption, ecosystem development
Long-term Forecast (2029-2030)
- POOL: Base scenario $1.59-$1.73 | Optimistic scenario $1.85-$2.31, with cumulative gain of 87-94%
- RUNE: Base scenario $0.57-$0.86 | Optimistic scenario $1.24-$1.54, with cumulative gain of 49-82%
Disclaimer
These forecasts are based on available historical data and predictive models. Past performance does not guarantee future results. Cryptocurrency markets are highly volatile and influenced by numerous unpredictable factors. This analysis is for informational purposes only and should not be considered as investment advice. Investors should conduct their own research and consult financial advisors before making investment decisions.
POOL:
| 年份 | 预测最高价 | 预测平均价格 | 预测最低价 | 涨跌幅 |
|---|---|---|---|---|
| 2025 | 1.354458 | 0.9214 | 0.810832 | 0 |
| 2026 | 1.67275563 | 1.137929 | 0.67137811 | 23 |
| 2027 | 1.61614366225 | 1.405342315 | 0.7588848501 | 52 |
| 2028 | 1.94885845532625 | 1.510742988625 | 1.1783795311275 | 63 |
| 2029 | 1.850886772513918 | 1.729800721975625 | 1.591416664217575 | 87 |
| 2030 | 2.309543433945755 | 1.790343747244771 | 1.665019684937637 | 94 |
RUNE:
| 年份 | 预测最高价 | 预测平均价格 | 预测最低价 | 涨跌幅 |
|---|---|---|---|---|
| 2025 | 0.637806 | 0.5746 | 0.436696 | 0 |
| 2026 | 0.75169172 | 0.606203 | 0.55164473 | 5 |
| 2027 | 1.0048420928 | 0.67894736 | 0.6585789392 | 18 |
| 2028 | 0.88398946272 | 0.8418947264 | 0.597745255744 | 46 |
| 2029 | 1.2426366161664 | 0.86294209456 | 0.5695417824096 | 49 |
| 2030 | 1.537072458830272 | 1.0527893553632 | 0.557978358342496 | 82 |
Comparative Investment Analysis Report: PoolTogether (POOL) vs THORChain (RUNE)
IV. Investment Strategy Comparison: POOL vs RUNE
Long-term vs Short-term Investment Strategy
PoolTogether (POOL): Suitable for investors focused on niche DeFi yield distribution mechanisms and those seeking exposure to lossless lottery protocol innovation. Recent 7-day performance (+17.2%) suggests potential accumulation phase positioning for medium-term holders.
THORChain (RUNE): Suitable for investors prioritizing cross-chain infrastructure exposure and seeking participation in multi-chain liquidity provision. Larger market capitalization ($202M) and established validator network provide relative stability compared to smaller-cap alternatives.
Risk Management and Asset Allocation
Conservative Investor Profile:
- POOL: 20% allocation
- RUNE: 30% allocation
- Stablecoin Buffer: 50% allocation
Aggressive Investor Profile:
- POOL: 35% allocation
- RUNE: 45% allocation
- Stablecoin Buffer: 20% allocation
Hedging Mechanisms: Stablecoin positioning recommended given extreme fear market sentiment (Crypto Fear & Greed Index: 25). Options strategies and cross-token portfolio diversification serve as additional risk mitigation tools.
V. Comparative Risk Assessment
Market Risk
PoolTogether (POOL):
- Extreme liquidity constraints (24-hour volume: $11,413.99) create significant slippage risk for substantial position exits
- Smaller holder base (8,552 addresses) indicates concentration risk and potential price manipulation vulnerability
- 30-day depreciation of -39.06% reflects pronounced downward momentum despite recent weekly recovery
THORChain (RUNE):
- Superior liquidity profile (24-hour volume: $553,152.93) reduces execution risk but remains vulnerable to broader market volatility
- 1-year performance decline of -88.42% indicates sustained negative price pressure relative to market entry points
- Network validator concentration may create systemic risk if key nodes experience operational disruptions
Technical Risk
PoolTogether (POOL):
- Protocol dependency on Compound and integrated DeFi platforms creates cascading failure exposure
- Smart contract vulnerability in yield distribution mechanisms could compromise user principal protections
- Limited technical development activity may indicate reduced ecosystem investment
THORChain (RUNE):
- Byzantine Fault Tolerant (pBFT) consensus implementation requires continuous validation of sub-second block finality mechanisms
- Cross-chain bridge security represents critical infrastructure vulnerability point
- Network stability directly correlates with validator bonding mechanisms and economic incentive alignment
Regulatory Risk
Global cryptocurrency regulatory frameworks increasingly focus on:
- Securities classification of yield-bearing tokens (affects POOL's lottery mechanism classification)
- Staking protocol compliance requirements (directly impacts RUNE validator economics)
- Cross-chain protocol oversight (creates regulatory uncertainty for THORChain operations)
Both assets face regulatory scrutiny regarding DeFi protocol classification and token utility definitions. RUNE's infrastructure positioning creates greater institutional regulatory exposure compared to POOL's application-layer focus.
VI. Conclusion: Which Is the Better Buy?
📌 Investment Value Summary
PoolTogether (POOL) Advantages:
- Recent momentum divergence with +17.2% weekly gains suggests potential accumulation phase entry opportunity
- Specialized lossless lottery mechanism provides differentiated product market positioning
- Lower absolute price ($0.9214) may appeal to retail accumulation strategies
- Smaller market capitalization permits greater percentage growth potential during recovery cycles
THORChain (RUNE) Advantages:
- Infrastructure-level positioning within cross-chain DeFi ecosystem provides broader utility framework
- Substantially larger market capitalization ($202.1M) and trading volume ($553K daily) enable institutional participation
- Validator bonding mechanism creates structural demand for token holdings
- Multi-chain functionality aligns with evolving DeFi market infrastructure requirements
- TVL growth dynamics create potential 5-10x expansion during bull market phases
✅ Investment Recommendations
Beginner Investors: Consider RUNE allocation within conservative portfolio framework (20-30% weight). Superior liquidity and established infrastructure provide reduced execution risk compared to POOL. Begin with stablecoin-heavy positioning given extreme fear market sentiment, gradually accumulating during market dislocations.
Experienced Investors: POOL presents higher-risk/higher-reward opportunity given illiquidity and recent momentum divergence. Implement dollar-cost averaging strategies with 12-24 month time horizons. RUNE suitable for infrastructure-focused portfolios seeking cross-chain exposure; monitor validator network health and TVL metrics as primary valuation drivers.
Institutional Investors: RUNE represents more appropriate institutional allocation given market depth, regulatory clarity potential, and infrastructure positioning. Establish positions during extended downtrend periods (current environment qualifies given -88.42% annual depreciation). POOL suitable only for sophisticated funds with specialized DeFi expertise and operational liquidity management capabilities.
⚠️ Risk Disclaimer: Cryptocurrency markets exhibit extreme volatility with potential total capital loss. Both POOL and RUNE have experienced 65-88% annual depreciation. Current market sentiment remains at "Extreme Fear" levels. This analysis derives exclusively from provided reference materials and does not constitute investment advice, financial recommendation, or endorsement of any trading strategy. Investors must conduct independent research and consult qualified financial advisors before committing capital.
Report Date: December 23, 2025 None
Frequently Asked Questions: POOL vs RUNE Investment Comparison
VII. FAQ
Q1: What are the key differences between PoolTogether (POOL) and THORChain (RUNE) in terms of project purpose?
A: PoolTogether (POOL) is a lossless lottery protocol that allows users to deposit funds into DeFi platforms to generate yield, with periodic prize draws funded by accumulated returns while preserving principal capital. THORChain (RUNE) operates as a multi-chain liquidity infrastructure protocol utilizing Byzantine Fault Tolerant consensus to facilitate cross-chain transactions and order matching across multiple blockchain networks. POOL focuses on application-layer yield distribution, while RUNE provides foundational infrastructure for decentralized cross-chain swaps.
Q2: Which token demonstrates better current liquidity and trading conditions?
A: THORChain (RUNE) exhibits substantially superior liquidity metrics with 24-hour trading volume of $553,152.93 compared to PoolTogether's $11,413.99. RUNE's volume-to-market-cap ratio of 0.273 indicates better trading activity, while POOL's ratio of 0.173 reflects significant liquidity constraints. POOL's smaller holder base (8,552 addresses) creates concentration risk and potential slippage challenges for substantial position exits, making RUNE more suitable for institutional market participants requiring execution certainty.
Q3: What does the price performance divergence between POOL and RUNE over the past seven days suggest about market sentiment?
A: POOL demonstrated +17.2% weekly gains while RUNE declined -4.77% over the same period, indicating differential market positioning or protocol-specific developments. This divergence suggests potential accumulation phase entry opportunity for POOL despite long-term depreciation trends, whereas RUNE's recent weakness may reflect broader infrastructure token underperformance. However, both assets remain substantially below historical peaks from the 2021 bull market cycle.
Q4: How do token economics and supply mechanisms differ between POOL and RUNE?
A: PoolTogether maintains a fixed total supply of 10,000,000 POOL with 71.72% circulating supply (7,172,433.99 tokens). THORChain's RUNE operates with a maximum supply of 500,000,000 and currently circulates 351,052,614 tokens at 70.21% circulation ratio. RUNE's tokenomics integrate directly with Thorchain's network security through validator bonding mechanisms and staking rewards, creating structural demand for token holdings. POOL's supply structure supports governance participation but lacks comparable economic incentive integration with protocol operations.
Q5: Which asset presents lower risk exposure for conservative investors?
A: THORChain (RUNE) represents the lower-risk option for conservative investors due to superior market capitalization ($202.1M vs $6.6M), established validator network infrastructure, and substantially higher trading liquidity. RUNE's infrastructure positioning creates institutional adoption pathways and regulatory clarity potential. However, conservative investors should maintain 50% stablecoin allocation given extreme market fear sentiment (Crypto Fear & Greed Index: 25) and implement dollar-cost averaging strategies to mitigate timing risk across both assets.
Q6: What does the long-term price forecast suggest about return potential through 2030?
A: Forecasted scenarios project POOL potential cumulative gains of 87-94% through 2030 (base to optimistic scenario range of $1.59-$2.31), while RUNE projects 49-82% cumulative gains ($0.57-$1.54 range). POOL demonstrates higher percentage return potential reflecting its smaller market capitalization and lower absolute price point, while RUNE's more moderate returns reflect established infrastructure positioning. Medium-term forecasts (2027-2028) suggest POOL gains of 52-63% and RUNE gains of 18-46%, with key drivers including institutional capital inflows and ecosystem development acceleration.
Q7: What are the primary risk factors distinguishing POOL and RUNE investment exposure?
A: PoolTogether faces extreme liquidity risk, smart contract vulnerability exposure in integrated DeFi platforms, and potential securities classification uncertainty regarding yield-bearing token mechanisms. THORChain confronts Byzantine Fault Tolerant consensus validation risks, cross-chain bridge security vulnerabilities, and validator bonding mechanism concentration risks. Both assets encounter regulatory uncertainty regarding DeFi protocol classification, though RUNE's infrastructure positioning creates greater institutional regulatory exposure while POOL's application-layer focus provides narrower regulatory surface area.
Q8: Which investment strategy is most appropriate for different investor profiles?
A: Beginner investors should prioritize RUNE allocation (20-30% portfolio weight) within conservative frameworks emphasizing stablecoin positioning given current market fear conditions. Experienced investors may consider POOL's higher-risk/higher-reward opportunity through dollar-cost averaging with 12-24 month time horizons, while maintaining RUNE infrastructure exposure within diversified portfolios. Institutional investors should prioritize RUNE positioning during extended downtrend periods, implementing measured accumulation strategies around established validator networks and cross-chain TVL metrics as primary valuation drivers.
Share
Content
Introduction: Investment Comparison Between POOL and RUNE
I. Historical Price Comparison and Current Market Status
II. Project Overview and Fundamental Characteristics
III. Comparative Valuation Metrics
IV. Risk Assessment and Performance Context
V. Ecosystem and Network Characteristics
VI. Token Distribution and Holder Concentration
Conclusion
Executive Summary
I. Core Investment Value Factors for RUNE
II. Core Factors Influencing RUNE Investment Value
III. Investment Thesis Summary
Disclaimer
III. 2025-2030 Year Price Forecast: POOL vs RUNE
IV. Investment Strategy Comparison: POOL vs RUNE
V. Comparative Risk Assessment
VI. Conclusion: Which Is the Better Buy?
VII. FAQ
How to Buy Cryptocurrency


Trending Cryptocurrencies


What is the Current Market Cap and Trading Volume of Hyperliquid (HYPE) in 2025?

PUNDIX vs GRT: A Comprehensive Comparison of Two Leading Blockchain Utility Tokens
ADX vs LINK: Comparing Two Leading Oracle and Data Solutions for Blockchain Applications
BTRST vs AAVE: Comparing Two Leading Governance Tokens in the DeFi Ecosystem
ENSO vs QNT: A Comprehensive Comparison of Climate Oscillation Patterns and Quantum Computing Technologies

G vs LINK: A Comprehensive Comparison of Two Leading Blockchain Protocols and Their Impact on Decentralized Finance

What are the key compliance and regulatory risks facing TAO in 2025?

Understanding Ledger Technology: Types and Applications in Cryptocurrency

How to Analyze JASMY On-Chain Data: Active Addresses, Transaction Volume, and Whale Movements
Future Prospects for Baby Doge Coin: Expert Predictions 2024-2030

What is Polkadot (DOT) and how does its multi-chain architecture impact the token's 2026 value?