Litecoin (LTC) continues its correction trend, trading below the $50.50 USD level at the time of writing on Wednesday, after losing about 4% in the previous session. The downward pressure is not only reflected on the chart but also reinforced by derivatives data, with open interest (OI) steadily declining while the number of short positions increases. In this context, LTC’s technical outlook still shows no clear signs of improvement.
Litecoin Derivatives Data Show Downtrend
Data from Litecoin futures markets indicate that OI fell back to $328.6 million USD on Tuesday, extending the decline that began in mid-January. The continuous decrease in OI reflects reduced investor participation and sends a pessimistic signal about the short-term market outlook.
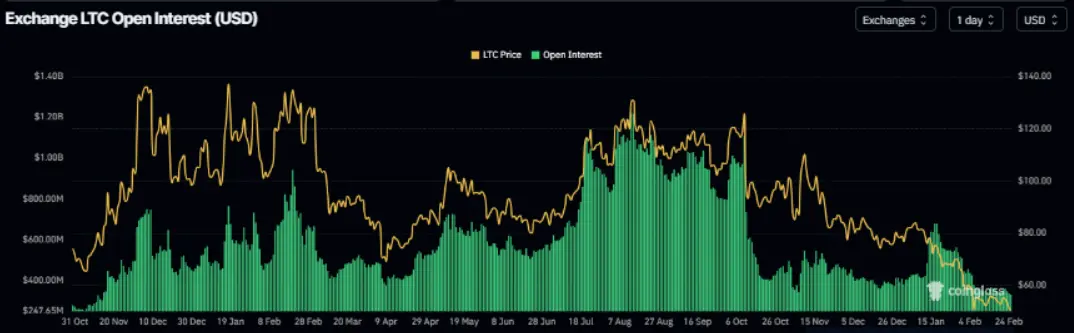 Litecoin Open Interest Volume Chart | Source: Coinglass
Additionally, the long/short ratio for Litecoin was only 0.94 on the same day and has failed to stay above 1 for the third time this month. This suggests traders are cautious about opening new long positions. The long/short ratio below 1 further emphasizes prevailing bearish sentiment, with most of the market leaning toward continued price declines.
Litecoin Open Interest Volume Chart | Source: Coinglass
Additionally, the long/short ratio for Litecoin was only 0.94 on the same day and has failed to stay above 1 for the third time this month. This suggests traders are cautious about opening new long positions. The long/short ratio below 1 further emphasizes prevailing bearish sentiment, with most of the market leaning toward continued price declines.
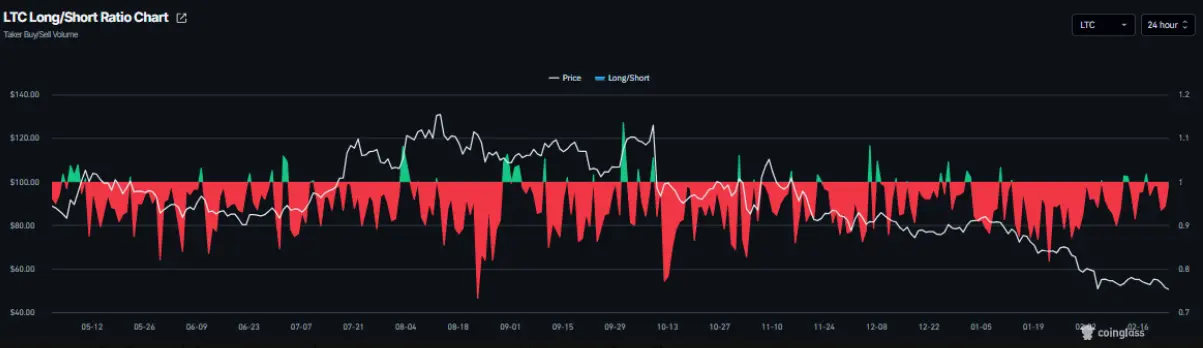 Litecoin Buy/Sell Short Ratio Chart | Source: Coinglass
Litecoin Price Forecast: Bears Target $45
As of Wednesday, Litecoin’s price hovered around $50.39 USD. The 50-day exponential moving average (EMA) continues to slope downward and is currently at $62.36 USD, reinforcing the bearish trend as the price remains below this level. Every recovery attempt quickly weakens near the 50-day EMA, indicating bulls lack the strength to trigger a reliable reversal.
On the daily timeframe, the MACD remains above its signal line and close to zero. However, the positive histogram is shrinking, reflecting diminishing bullish momentum and ongoing correction risks.
The Relative Strength Index (RSI) stands at 32.26, below the neutral 50 level. This indicates selling pressure still dominates, and RSI approaching oversold territory suggests the market could soon see technical rebounds, although there is not enough evidence yet to confirm a trend reversal.
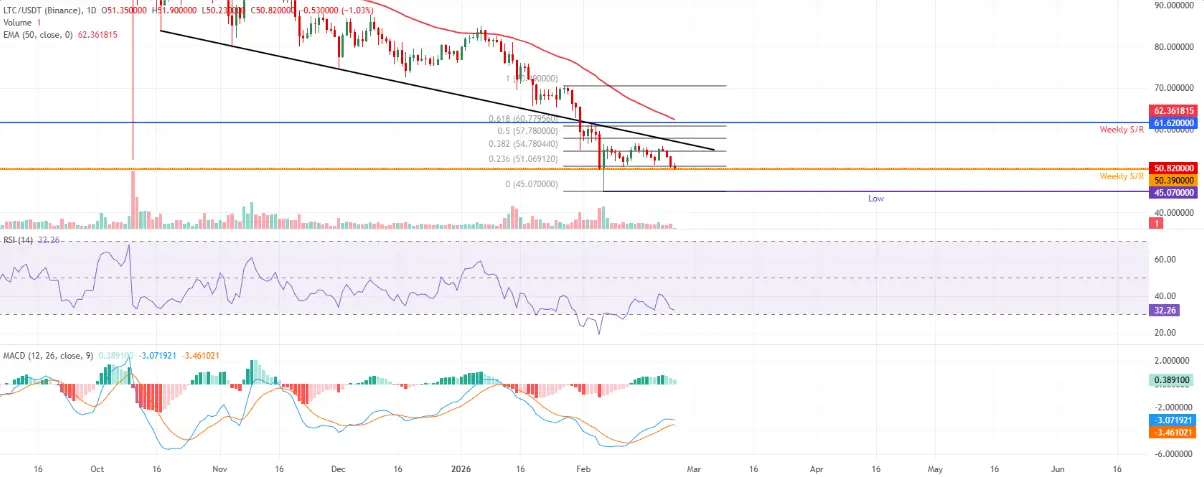 Daily LTC/USDT Chart | Source: TradingView
Based on Fibonacci retracement from the high of $70.49 USD to the low of $45.07 USD, the 23.6% level at $51.06 USD acts as a short-term resistance zone. Further, the 38.2% retracement at $54.78 USD remains a significant barrier for recovery. On the downside, immediate support is around $50.39 USD, while higher resistance is identified at $61.62 USD.
Daily LTC/USDT Chart | Source: TradingView
Based on Fibonacci retracement from the high of $70.49 USD to the low of $45.07 USD, the 23.6% level at $51.06 USD acts as a short-term resistance zone. Further, the 38.2% retracement at $54.78 USD remains a significant barrier for recovery. On the downside, immediate support is around $50.39 USD, while higher resistance is identified at $61.62 USD.
In a bullish scenario, if the price breaks above and sustains over $51.06 USD, Litecoin could extend its recovery toward $54.78 USD. Conversely, a daily close below $50.39 USD is likely to trigger new selling pressure, pushing the price back to test the February 6 low of $45.07 USD, consistent with the prevailing downtrend.
Disclaimer: The information on this page may come from third parties and does not represent the views or opinions of Gate. The content displayed on this page is for reference only and does not constitute any financial, investment, or legal advice. Gate does not guarantee the accuracy or completeness of the information and shall not be liable for any losses arising from the use of this information. Virtual asset investments carry high risks and are subject to significant price volatility. You may lose all of your invested principal. Please fully understand the relevant risks and make prudent decisions based on your own financial situation and risk tolerance. For details, please refer to
Disclaimer.
Related Articles
Here’s the Shiba Inu (SHIB) Price if Burn Rate Collapse Triggers a Supply Shock
Shiba Inu is experiencing dual narratives: it's now recognized as a digital commodity, yet faces pressure from a high exchange influx and a drastic 98% drop in burn rate. While the price remains steady at $0.00000609, future movements depend on increased burn activity and market demand.
CaptainAltcoin59m ago
Markets Down 25%, Sentiment Up 80%: 5 Macro Catalysts—From Trade Easing to Fed Printing that Could Ignite the Next Explosive Surge.
Market sentiment is rising despite a 25% decline, signaling early accumulation behavior.
Macro factors like easing policy and weaker dollar support altcoin recovery potential.
Infrastructure and narrative-driven tokens may lead the next market phase.
The crypto market has plunged into a
CryptoNewsLand2h ago
Solana Price Holds Near $80 as Analysts Split on Next Move
Key Insights:
Solana trades near $80 under pressure, with persistent lower highs and weak recovery attempts reinforcing a clear short-term bearish market structure.
Analysts identify the $75 to $45 range as a key accumulation zone, supported by historical demand levels and long-term
CryptoNewsLand3h ago
ADA Price Weakens Under Resistance While Large Wallets Accumulate
Key Insights:
Cardano trades below all major moving averages, reinforcing bearish pressure while price struggles to reclaim even short-term resistance levels across multiple timeframes.
Whale wallets holding large ADA balances have steadily accumulated since February, reaching their
CryptoNewsLand3h ago
Cardano Price Near $0.245 Level as Market Momentum Weakens
Cardano's price is stabilizing around the $0.245 support level amid market consolidation and declining momentum. The inability to break resistance at $0.268 raises concerns about upward strength. Meanwhile, development of the new node version 10.7.0 is in testing, promising enhancements for the ecosystem.
CryptoNewsLand3h ago
Dogecoin Near Key Breakout Zone as X Money Buzz Builds
Key Insights:
Dogecoin volatility has tightened significantly, with Bollinger Bands compressing to yearly lows, indicating a sharp price move could emerge within days.
Rising futures volume and strong long positioning show traders anticipate upside, although repeated liquidations highlight r
CryptoFrontNews4h ago
