
Date: Fri, Jan 02, 2026 | 09:15 AM GMT
The broader cryptocurrency market has started the new year on a stable footing, with both Bitcoin (BTC) and Ethereum (ETH) trading slightly higher and posting gains of over 1.5%. This modest strength across major assets has provided breathing room for risk-on sentiment, allowing several memecoins to show early signs of recovery — including Popcat (SOL) (POPCAT).
POPCAT is currently trading by solid 19% higher on the day, but the more important development lies in its broader technical structure. After months of consistent downside pressure, the price action is now beginning to hint at a potential trend reversal, supported by a well-defined bullish pattern forming on the daily chart.
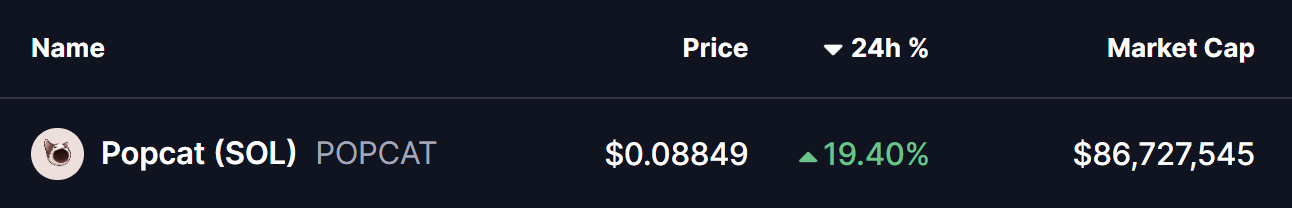
Source: Coinmarketcap
Falling Wedge Pattern in Play
On the daily timeframe, POPCAT appears to be carving out a falling wedge formation — a classic bullish reversal pattern that often develops after extended downtrends. This structure is characterized by lower highs and lower lows that gradually converge, reflecting weakening selling pressure and growing buyer interest near the lows.
Following weeks of steady decline, POPCAT recently established a local bottom near the $0.0725 region. This area acted as a strong demand zone, where buyers stepped in aggressively and prevented further downside. The resulting rebound pushed price back toward the $0.088 level, placing POPCAT just beneath the wedge’s upper resistance trendline.
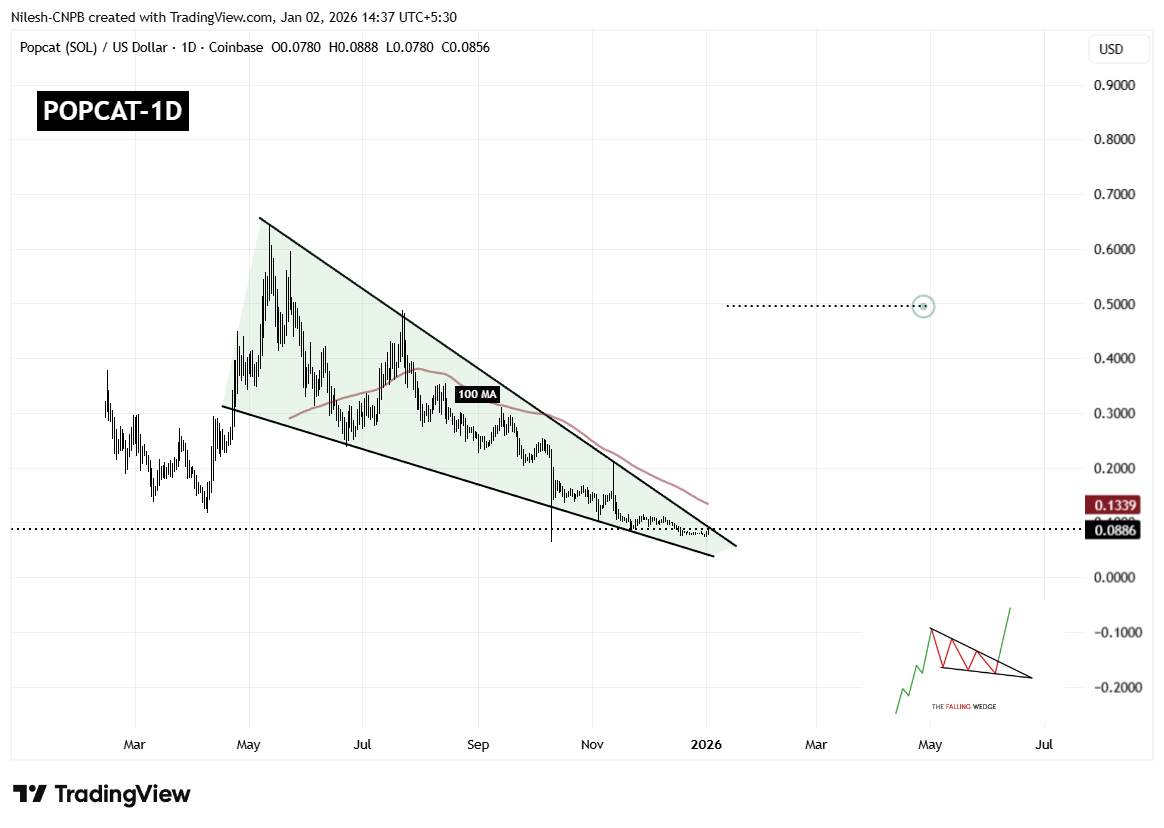
Popcat (POPCAT) Daily Chart/Coinsprobe (Source: Tradingview)
This compression near resistance is technically significant, as falling wedges tend to resolve with a sharp upside move once price breaks out of the structure. The longer price coils within the wedge, the stronger the eventual breakout tends to be.
However, overhead resistance remains notable. The 100-day moving average, currently hovering around $0.1339, represents a major technical barrier. This level has previously acted as dynamic resistance and will likely be a key area to watch if a breakout occurs.
What’s Next for POPCAT?
If buyers manage to push price decisively above the wedge resistance and reclaim the 100-day moving average with a strong daily close, POPCAT could confirm a bullish breakout. Such a move would mark a clear shift in trend structure and could open the door for a larger recovery rally.
Based on the measured move of the falling wedge pattern, the upside projection points toward the $0.49 region. Reaching this level would represent a substantial recovery from current prices and could attract renewed interest from momentum traders and sidelined participants.
That said, failure to break above resistance could result in continued consolidation. In a bearish scenario, POPCAT may revisit the $0.072 support zone once again. As long as this level continues to hold, the broader falling wedge structure would remain intact, keeping the bullish reversal thesis alive.
Overall, POPCAT is approaching a technically critical juncture. With price tightly compressed, selling pressure fading, and buyers defending key support levels, the coming sessions could prove decisive in determining whether this memecoin is ready to stage its next meaningful move higher.
Disclaimer: The views and analysis presented in this article are for informational purposes only and reflect the author’s perspective, not financial advice. Technical patterns and indicators discussed are subject to market volatility and may or may not yield the anticipated results. Investors are advised to exercise caution, conduct independent research, and make decisions aligned with their individual risk tolerance.
About Author: Nilesh Hembade is the Founder and Lead Author of Coinsprobe, with over 5 years of experience in the cryptocurrency and blockchain industry. Since launching Coinsprobe in 2023, he has been providing daily, research-driven insights through in-depth market analysis, on-chain data, and technical research.
Disclaimer: The information on this page may come from third parties and does not represent the views or opinions of Gate. The content displayed on this page is for reference only and does not constitute any financial, investment, or legal advice. Gate does not guarantee the accuracy or completeness of the information and shall not be liable for any losses arising from the use of this information. Virtual asset investments carry high risks and are subject to significant price volatility. You may lose all of your invested principal. Please fully understand the relevant risks and make prudent decisions based on your own financial situation and risk tolerance. For details, please refer to
Disclaimer.
Related Articles
Michael Saylor: Bitcoin may have already hit bottom, but quantum risks have been exaggerated
Strategy Executive Chairman Michael Saylor believes Bitcoin hit its bottom around $60,000 this February, because all forced sellers in the market have already exited. He said that the catalyst for the next bull market will be a bitcoin-based banking credit system, while he believes the threat from quantum computing is being exaggerated, and he pointed out that the technical community has enough time to deal with this threat.
MarketWhisper1h ago
Glassnode: Is the Bitcoin rebound just a dead cat bounce? Where is the key pressure level?
Glassnode reports that although the Bitcoin price rebounded to $72k due to a U.S.-Iran ceasefire, the market structure is still in a bear market. In the short term, the downside may be limited, but the $78k level faces pressure overhead. ETF capital inflows have ticked up slightly, but they have not yet fully returned; trading activity in derivatives remains sluggish, indicating insufficient market confidence. Going forward, we need to monitor changes in the futures trading and options markets.
ChainNewsAbmedia2h ago
Why is Bitcoin down today? The Iran–Israel ceasefire is on the verge of collapse, and the Strait of Hormuz shuts down again
Bitcoin has recently been trading below $72,000 and faces risks from the failure of the U.S.-Iran ceasefire talks and the Strait of Hormuz closing again, which has weighed on market sentiment. At the same time, Federal Reserve meeting minutes show that the likelihood of further rate hikes is rising, further affecting the valuation of risk assets. Bitcoin’s key resistance level is $75,000 and its support level is $68,000; the market is currently waiting for a clear direction confirmation signal.
MarketWhisper2h ago
The Crypto Fear and Greed Index drops to 14, and the market remains in extreme fear
Gate News message, April 9, according to Alternative data, today’s Crypto Fear and Greed Index is 14 (yesterday was 17), and the market remains in extreme fear. The index ranges from 0-100 and provides a composite assessment of six indicators: volatility (25%), market trading volume (25%), social media buzz (15%), market surveys (15%), Bitcoin’s share of the entire market (10%), and Google trending topic analysis (10%).
GateNews3h ago
Optimism over the Iran-U.S. ceasefire helped drive a broad rebound in U.S. stocks, and Bitcoin rose to a three-week high.
The United States and Iran reached a two-week ceasefire agreement, and global financial markets turned optimistic, with the S&P 500 rising 2.51%. U.S. crude oil prices fell to below $95 per barrel, easing concerns about an energy crisis. Bitcoin at one point rose 5% to $72,841, hitting a three-week high. Expectations that the Federal Reserve will cut interest rates have also increased.
ChainNewsAbmedia3h ago
Bitcoin ETF attracts $470 million, setting a 6-week high! Analyst: “A breakout rally is brewing.”
U.S. spot Bitcoin ETF inflows hit a new six-week high on Monday, signaling a rebound in institutional investor confidence. Total net inflows of $471.3 million came mainly from institutions such as BlackRock and Fidelity. Even though market sentiment is gradually improving, broader macroeconomic and geopolitical risks could still affect Bitcoin’s upward momentum. Analysts said that sustained structural buying can support Bitcoin, but future price action will still need to be monitored for changes in external factors.
区块客3h ago