Date: Sun, Dec 21 2025 | 08:56 AM GMT
The broader cryptocurrency market has remained under pressure over the past several weeks, following the sharp sell-off that began on October 10. That corrective phase dragged Ethereum (ETH) down by nearly 23% over the last 60 days and weighed heavily on overall market sentiment. While many altcoins have struggled to stabilize, Quant (QNT) has shown relative resilience, posting only a modest decline and holding above a historically important support zone.
From a technical perspective, the daily chart suggests that QNT may be approaching a critical decision point, with price action forming a recognizable structure that could influence its next directional move.
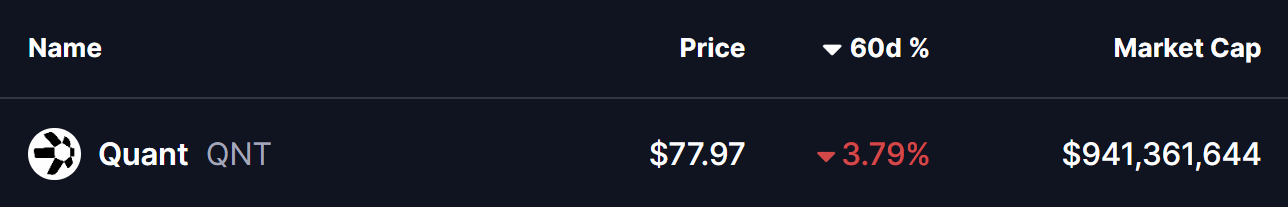
Source: Coinmarketcap
Head and Shoulders Pattern Takes Shape
On the daily timeframe, QNT appears to be carving out a head and shoulders formation, a well-known pattern that often signals a potential trend shift once the neckline is tested. Earlier in the structure, QNT formed the left shoulder before rallying sharply to its head near the $100 region. From there, price reversed lower and slid back toward the neckline, located around the $70 support zone.
This $70 area has proven to be a strong demand zone in the past, repeatedly attracting buyers and preventing deeper declines. The recent move into this region was met with a noticeable reaction, as reflected by the long lower wick on the chart. That rejection from support pushed price back toward the $78 level, suggesting that buyers are actively defending the neckline and potentially forming the right shoulder of the pattern.
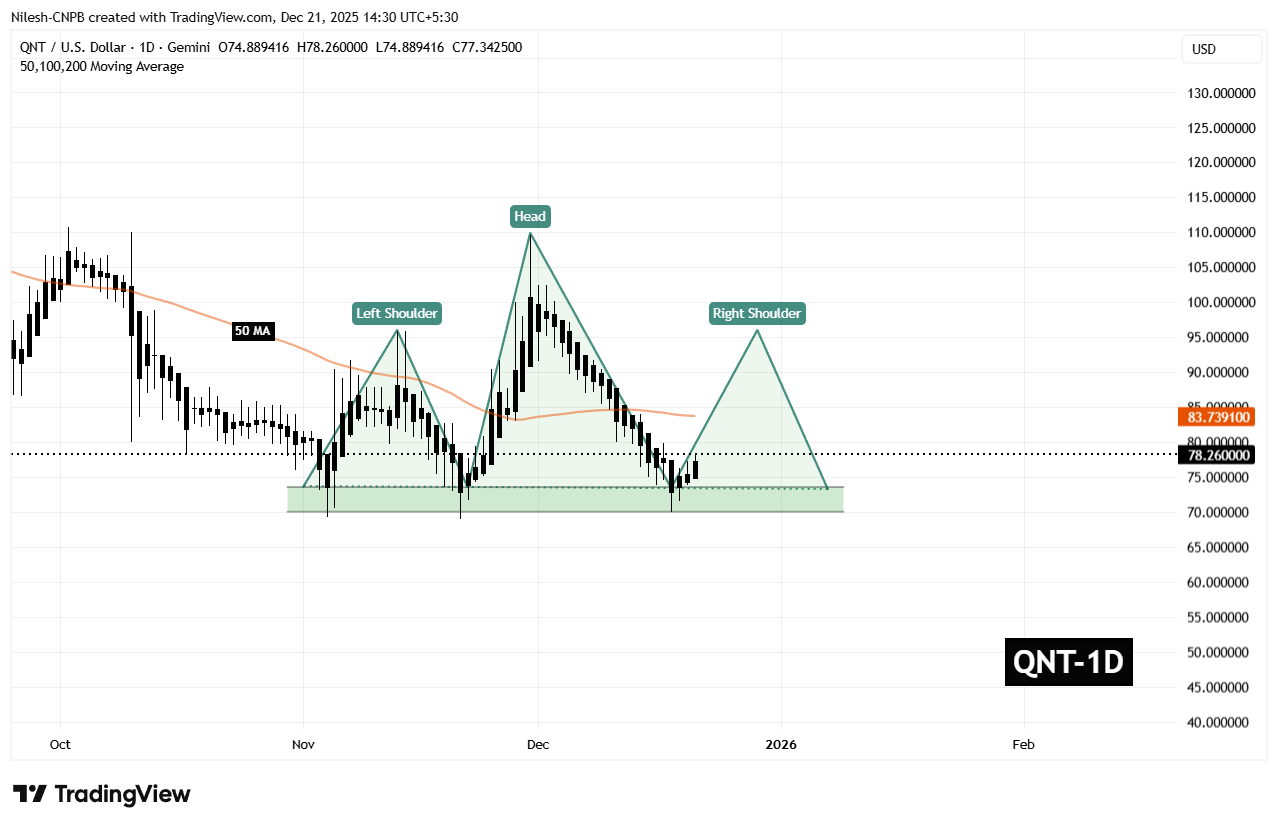
Quant (QNT) Daily Chart/Coinsprobe (Source: Tradingview)
The behavior around this zone is critical. A successful defense of the neckline often opens the door for a relief rally, especially if broader market conditions stabilize.
What’s Next for QNT?
For bullish momentum to build, QNT needs to reclaim the 50-day moving average, currently sitting near $83.73. This level now acts as a key short-term resistance, and a daily close above it would signal a shift in momentum back in favor of buyers.
If that recovery unfolds, the chart points toward a potential move into the $95.90 region. Such a move would represent a rebound of roughly 22% from current levels and align with the typical reaction seen during the right-shoulder phase of this pattern. A rally of this nature would not only ease recent selling pressure but also place QNT back into a more neutral technical posture.
That said, the setup remains delicate. If the $70 neckline support fails to hold on a sustained basis, the head and shoulders structure would remain bearish, opening the door to further downside and extending the corrective phase. For now, all eyes remain on how price behaves around this key support and whether buyers can regain control above the moving average.
Disclaimer: The views and analysis presented in this article are for informational purposes only and reflect the author’s perspective, not financial advice. Technical patterns and indicators discussed are subject to market volatility and may or may not yield the anticipated results. Investors are advised to exercise caution, conduct independent research, and make decisions aligned with their individual risk tolerance.
Disclaimer: The information on this page may come from third parties and does not represent the views or opinions of Gate. The content displayed on this page is for reference only and does not constitute any financial, investment, or legal advice. Gate does not guarantee the accuracy or completeness of the information and shall not be liable for any losses arising from the use of this information. Virtual asset investments carry high risks and are subject to significant price volatility. You may lose all of your invested principal. Please fully understand the relevant risks and make prudent decisions based on your own financial situation and risk tolerance. For details, please refer to
Disclaimer.
Related Articles
Bearish Analyst Declares Q2 2026 to Be a Bloody One for the Crypto Market
Bearish analyst declares Q2 2026 to be a bloody one for the crypto market.
He expects the price of BTC to likely set a bottom during this time.
He calls for an inevitable recession as oil prices could surge.
As the new month and start of Q2 2026 kick off, differing expectations take
CryptoNewsLand8m ago
Bitcoin Barely Avoids Equaling Worst Red Monthly Streak: What’s Next for April?
After another volatile month fueled by the war moves in the Middle East, bitcoin managed to scrape above the surface at the end and finished with a minor increase.
The focus has now turned to April and Q2, and _CryptoPotato_ turned to a leading expert about their take on the matter and what
CryptoPotato27m ago
‘Q2 Will Be Full of Blood’: Analyst Flips Fully Bearish on Bitcoin
Over the last few months, conflict in the Middle East has put pressure on crypto markets. Bitcoin faced a fresh decline of nearly 3% on Friday as the price dropped toward $66,000 from $69,200 yesterday.
Now, pseudonymous analyst Mr. Wall Street warned that the second quarter could be “full of
CryptoPotato31m ago
For every 1 mined unit, you’re paying $20,000! Bitcoin miners spark a wave of disappearances, as “mining difficulty” drops sharply by 7.8%
The Bitcoin mining industry is facing severe challenges. As the coin’s price declines and energy costs increase, mining expenses have soared to $88,000, with miners losing nearly $20,000 for each Bitcoin mined. Rising international oil prices and escalating geopolitical risks have further intensified miners’ financial pressures. Hashrate loss and extended block times indicate that miners are exiting the market, leading to a wave of sell-offs that further impact the price structure. To survive, miners are turning to AI and high-performance computing to seek new revenue sources.
区块客53m ago
Ethereum is approaching a key level, but it’s hiding strong signals! Active addresses are nearing their all-time high, while funds continue to leave trading platforms
In April 2026, the price of Ethereum fell under the influence of geopolitical pressure, but on-chain data performed well and network activity was high. User preference for self-custody increased, and the DEX market share rose. Analysts say the market has not seen panic selling; whether the price will reverse in the future still depends on the external environment.
GateNews1h ago
Why is the crypto market down today? Trump’s tough remarks sparked a wave of selling, and Bitcoin is approaching the key $65,000 support level
April 2, 2026, the total market capitalization of the cryptocurrency market fell 2.6%. Bitcoin dropped to $66,250, Ethereum is nearing $2,000, and major assets generally pulled back. Due to Trump making tough remarks about the Iran situation, risk-off sentiment intensified in the market, and funds are taking a wait-and-see stance in the short term. High interest rates and geopolitical risk together are weighing on prices; going forward, attention will be on developments in the Middle East and changes in macro liquidity.
GateNews1h ago
