Is XRP About to Explode to $0.6? (Ripple Price Analysis)
Technical Analysis
By Edris
Ripple’s price is currently testing a key resistance level against USDT but is yet to achieve any breakthrough. However, things might be about to change in the coming days. On the other hand, things are not looking so good against BTC.
The USDT Paired Chart
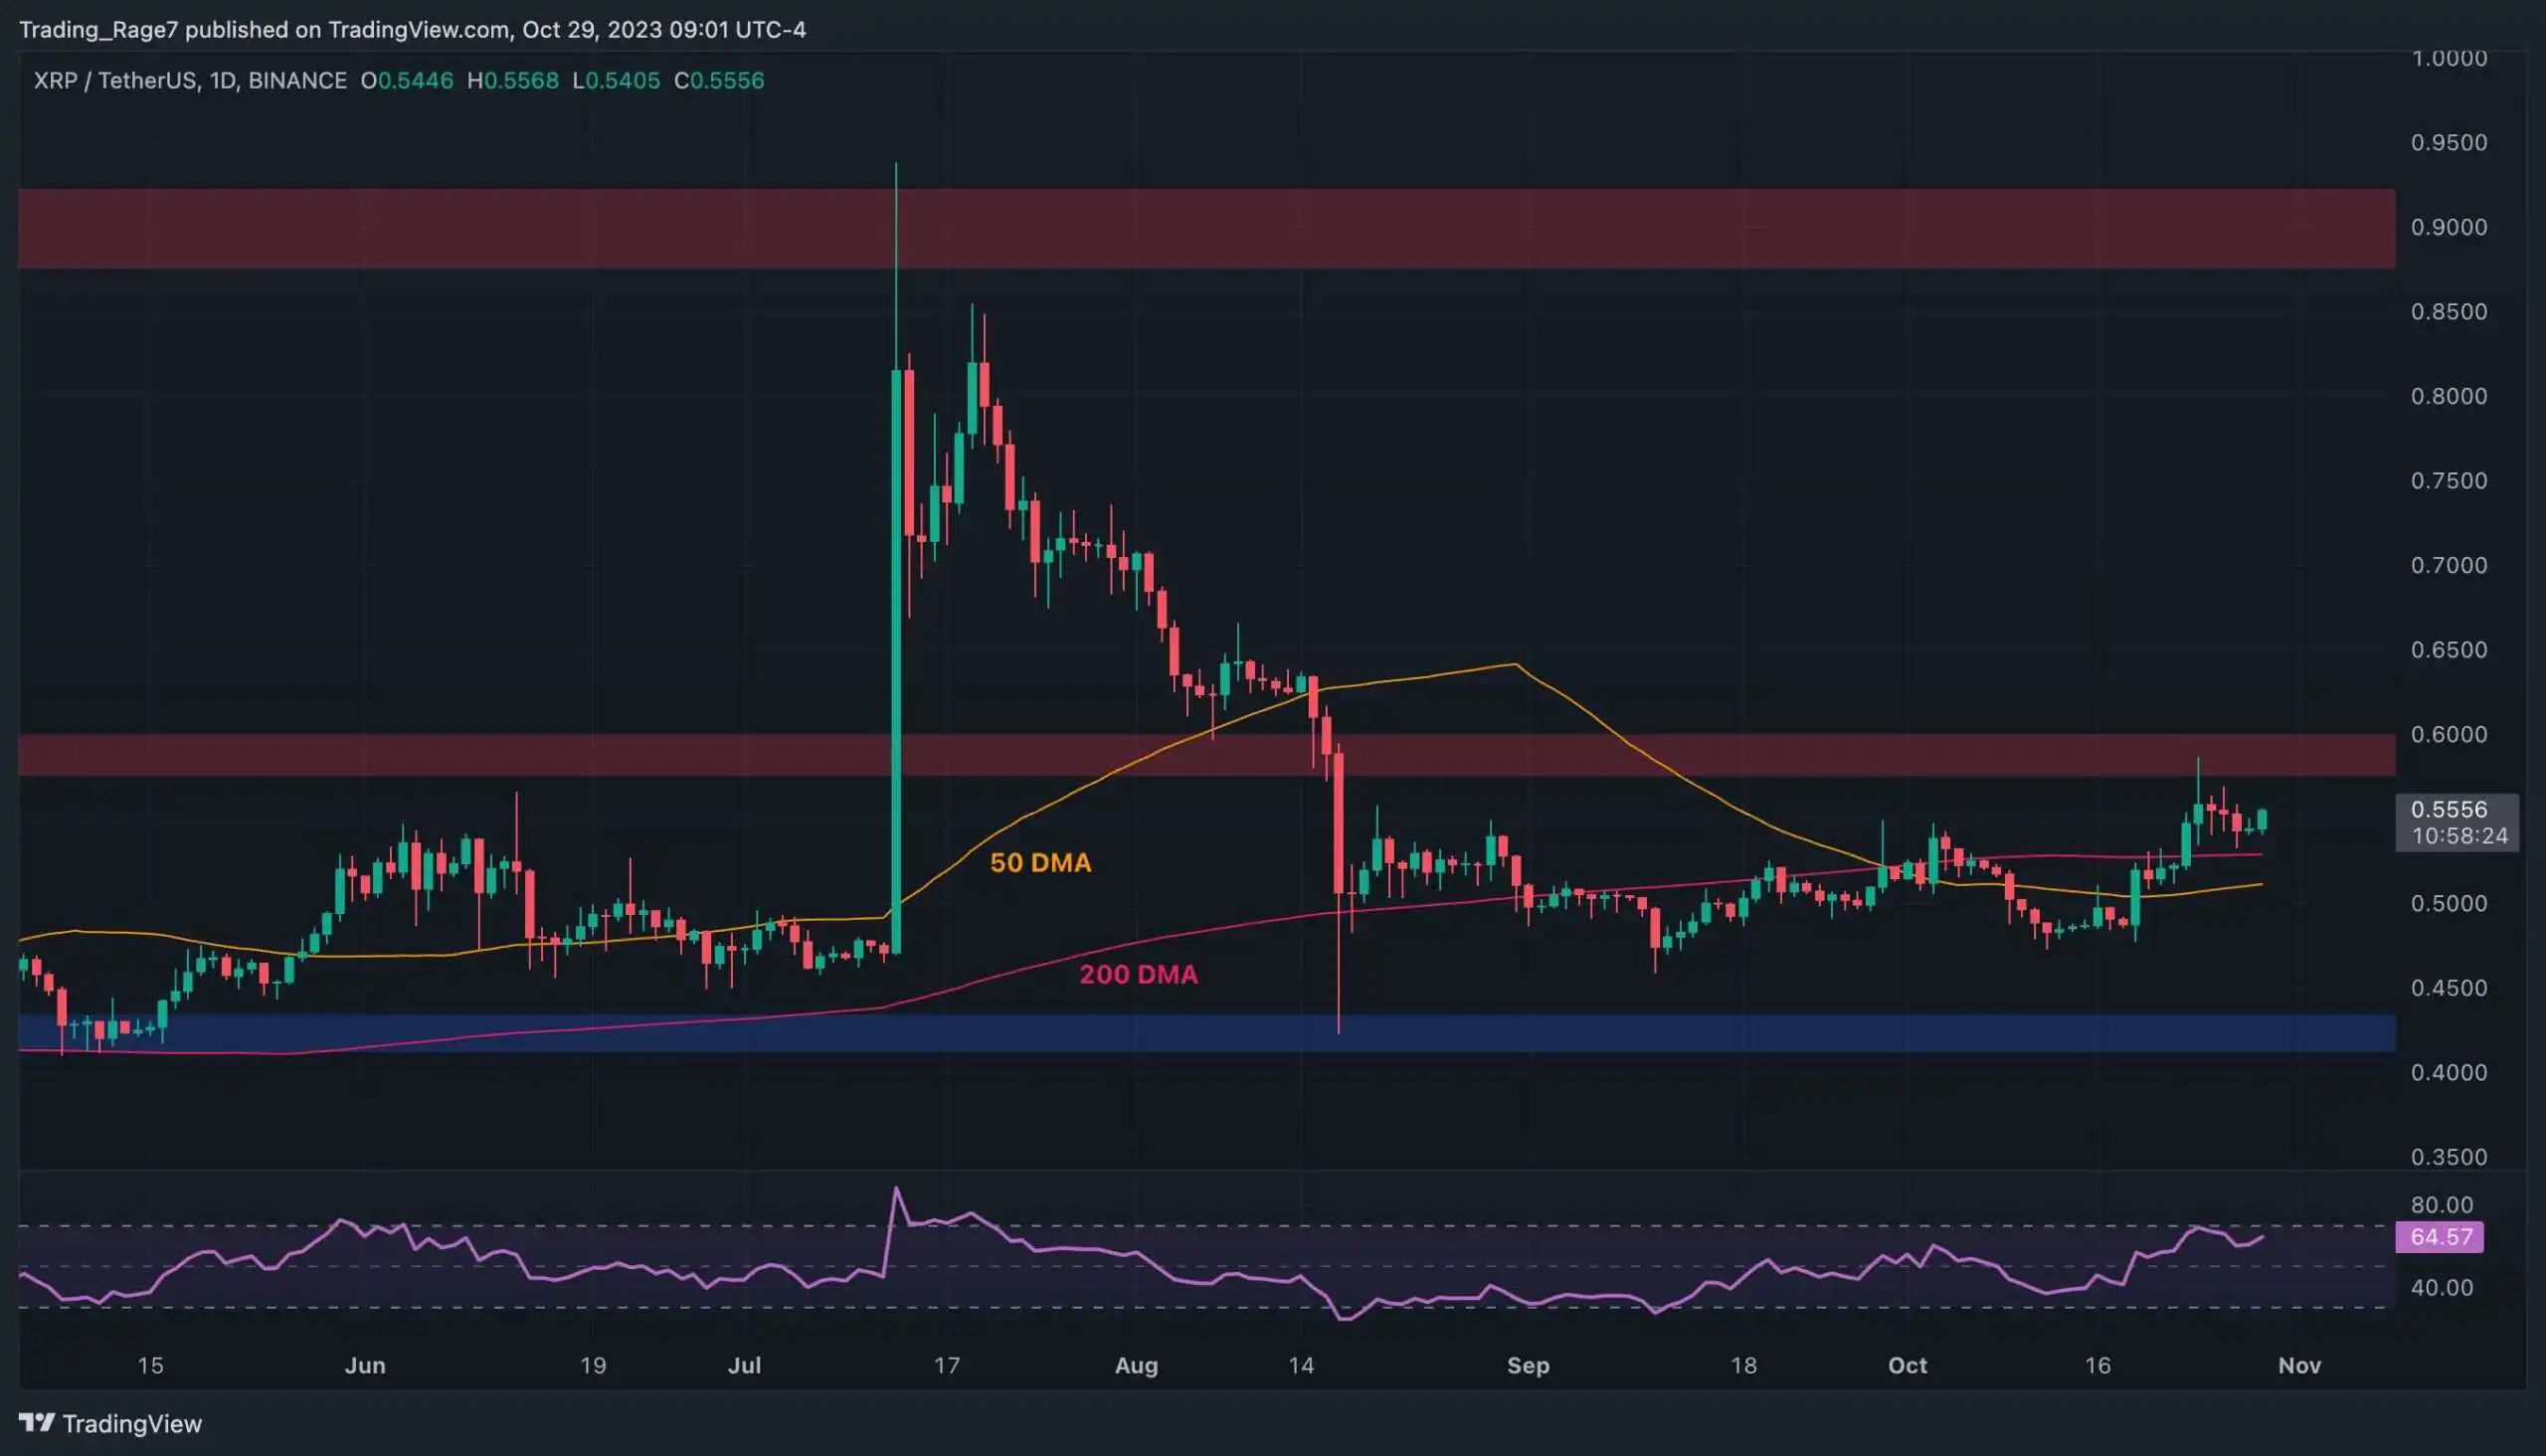
Against USDT, the price has been trending higher over the last month, breaking above both the 50-day and 200-day moving averages located around the $0.5 and $0.55 levels respectively.
Yet, the significant $0.6 resistance level has already rejected the price once. Meanwhile, the market is approaching this level again, and it seems more likely to break above this time.
The Relative Strength Index is also showing values above 50% that indicate bullish momentum, but it is also getting close to the overbought region. Therefore, while a bullish breakout is probable, investors should be wary of a potential pullback afterward.
 Soruce: TradingView### The BTC Paired Chart
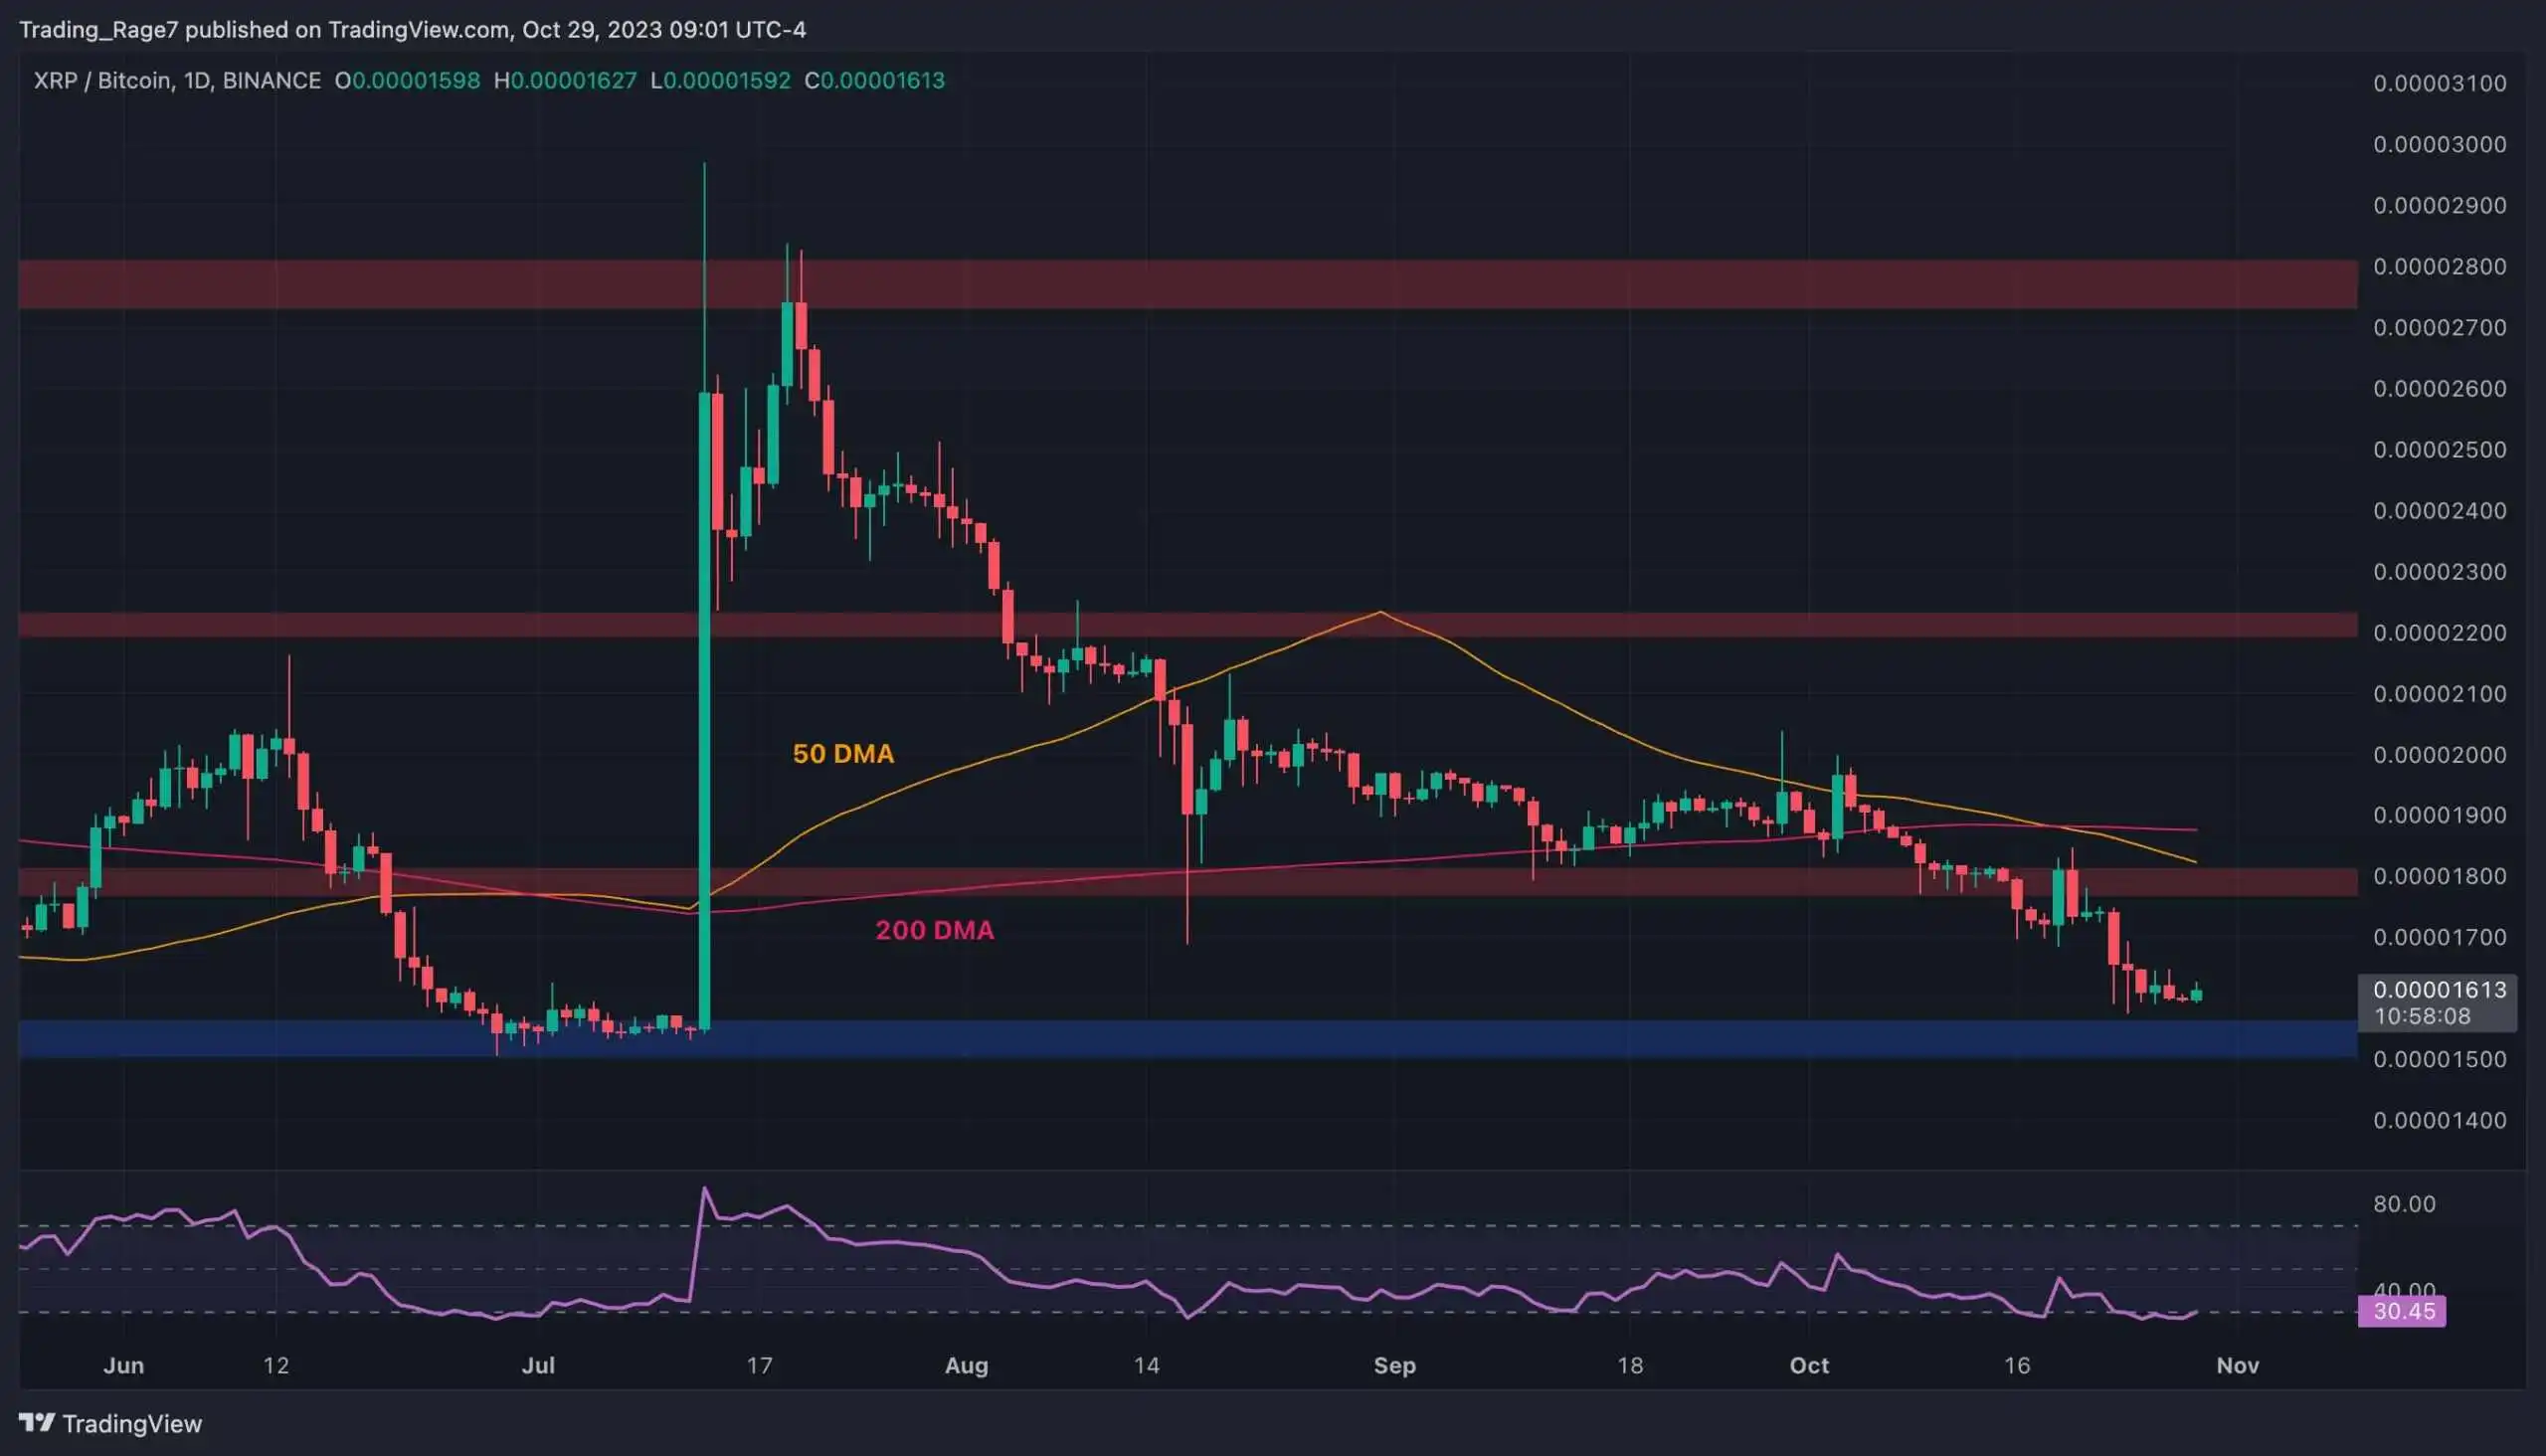
Looking at the chart against BTC, the price has been dropping consistently since breaking the 1800 SAT area to the downside.
The market is currently declining toward the 1500 SAT support level. However, it might be able to hold the price and initiate a rebound, as the Relative Strength Index is already demonstrating an oversold signal.
In case the price bounces from this area, a rally and bullish breakthrough against USDT can be expected.
 Source: TradingView