Kong 星火空投
我只是想撸個毛,你卻想偷我的家? @0xMiden
查看原文- 打賞
- 2
- 留言
- 轉發
- 分享
Trump issued a 48-hour ultimatum, but it's clearly just political talk for the midterm elections. $100 oil = political suicide.
Iran, meanwhile, is getting tougher the more this drags on. They've already seen through the U.S. government's complete lack of credibility—ceasefire agreements and treaties are useless, only to be attacked again less than a year later.
So Iran is determined this time, no point in talking about it. They must make America pay the price—first, end the petrodollar!
Iran is trying to push up energy prices to precisely strike the massive $60 trillion U.S. stock market that
查看原文Iran, meanwhile, is getting tougher the more this drags on. They've already seen through the U.S. government's complete lack of credibility—ceasefire agreements and treaties are useless, only to be attacked again less than a year later.
So Iran is determined this time, no point in talking about it. They must make America pay the price—first, end the petrodollar!
Iran is trying to push up energy prices to precisely strike the massive $60 trillion U.S. stock market that
- 打賞
- 1
- 留言
- 轉發
- 分享

JLM
脊梁米
創建人@GateUser-d76cc819
上市進度
100.00%
市值:
$1594.15
更多代幣
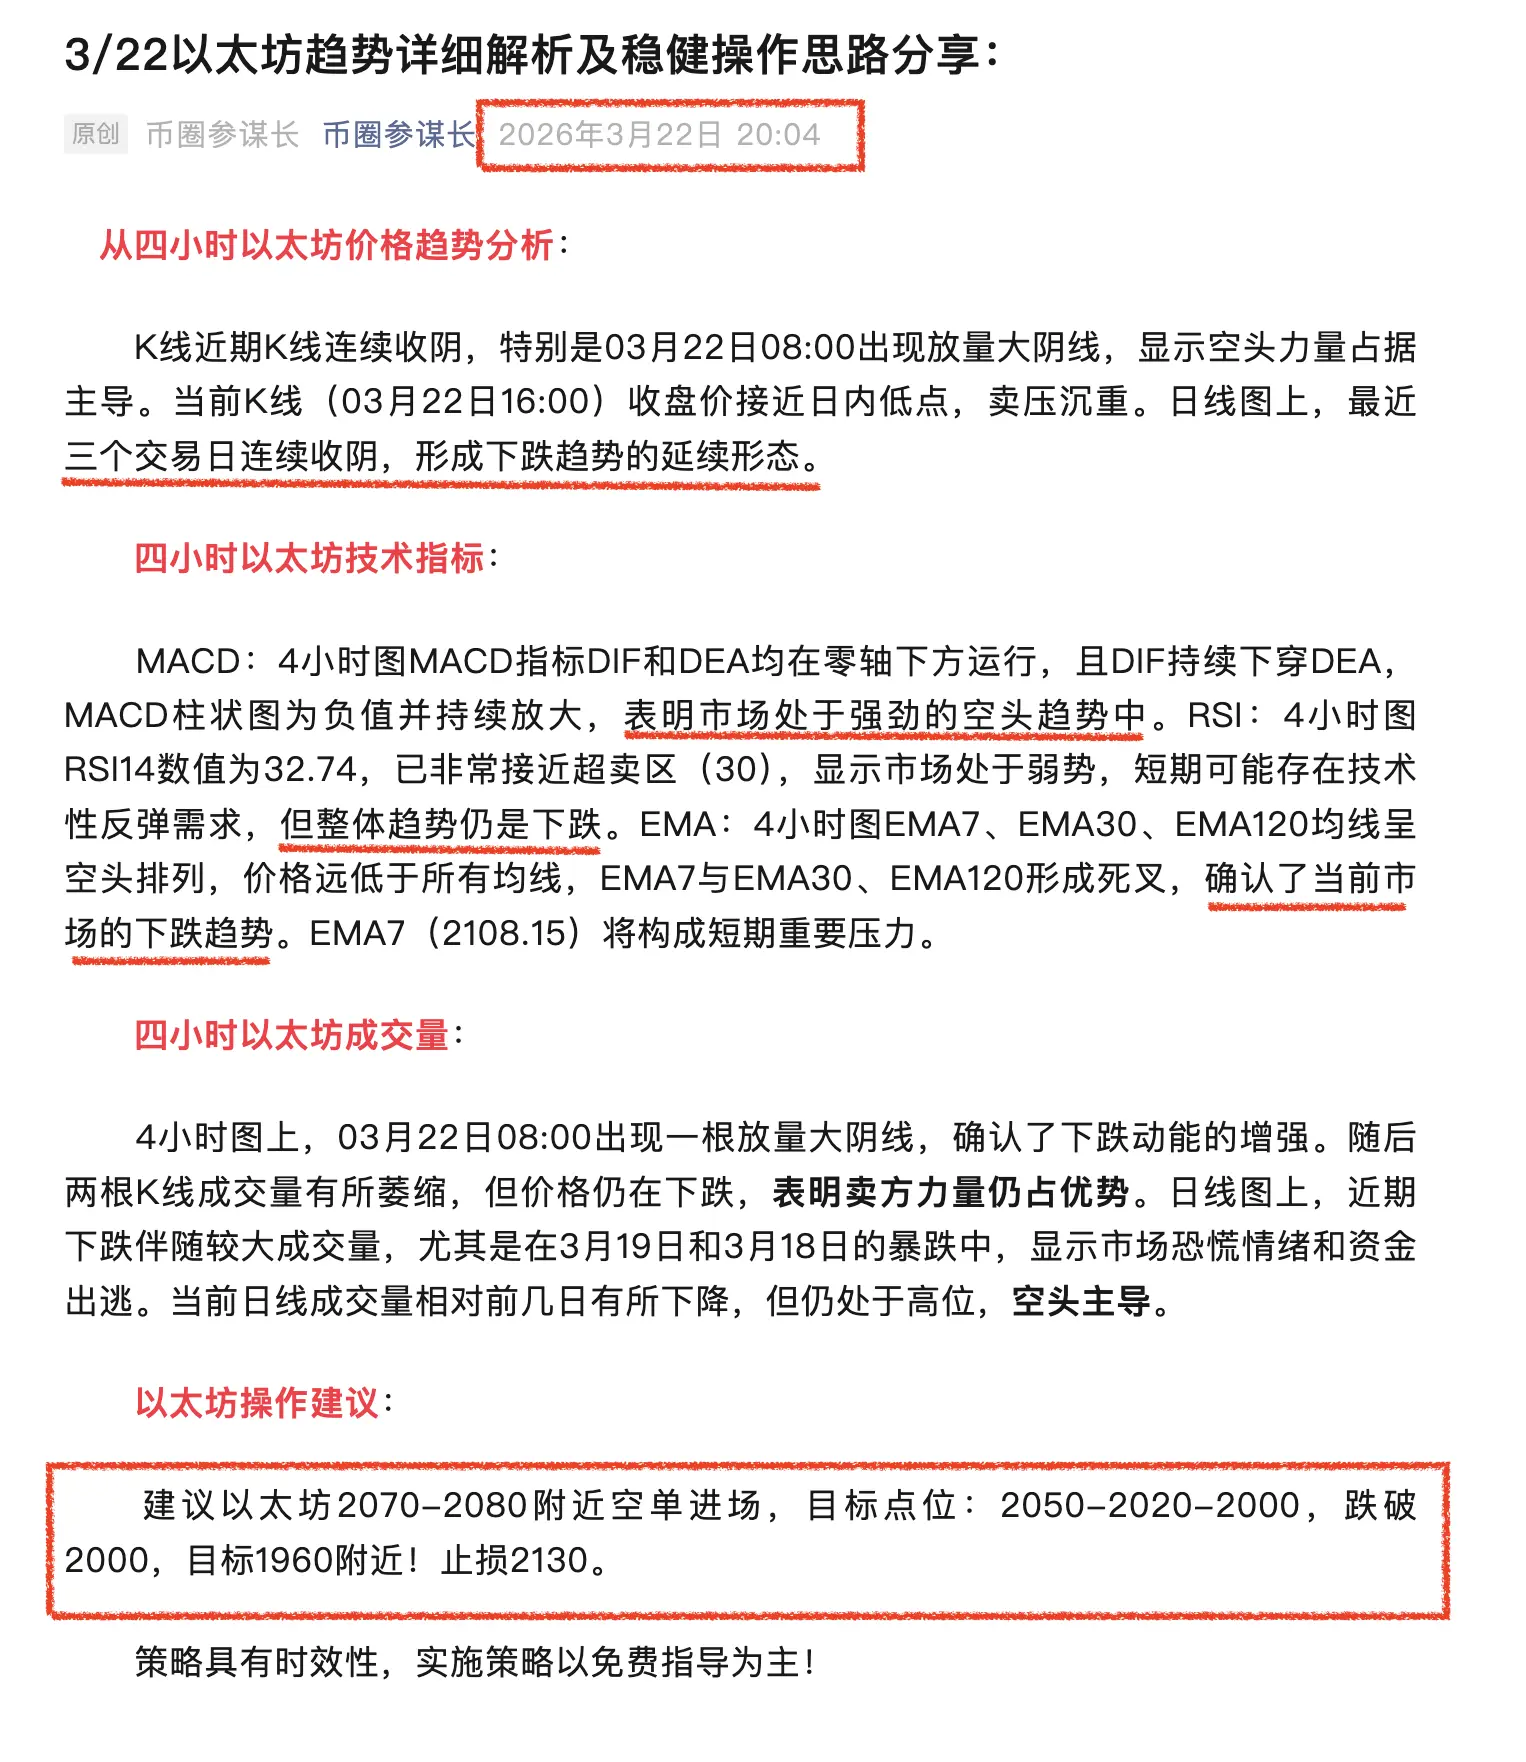
📣3/23以太坊早盤趨勢解析及操作方向 思路分享:
昨日以太坊2070-2080空單再次完美止盈出局,再次恭喜相信參謀長的朋友!從目前的趨勢來看,以太坊目前趨勢還是較為弱勢,操作時切勿盲目抄底,同時做空是也及時設置好止損,防止莊稼反人性心理。
從目前四小時以太坊技術指標解析:
布林帶(BOLL(20,2,0))中軌(MID):2118.25,上軌(UP):2192.25,下軌(LOW):2044.24,當前價格跌破中軌,接近下軌支撐,處於布林帶下行通道,短期偏空,下軌2044附近是第一支撐位,若跌破則下看1950-2000區間。
MACD(12,26,9)DIF:12.64,DEA:8.11,MACD:9.06,雖然MACD仍為正值,但DIF與DEA雙線向下,綠柱(空頭動能)持續放大,空頭趨勢明確,雙線若下穿0軸,將確認中期下跌趨勢。
KDJ(9,3,3)K:24.31,D:29.99,J:12.94,三線全部向下,J值已進入超賣區間(<20),短期超賣,存在技術性反彈需求,但K/D仍未金叉,反彈力度有限,反彈後仍有二次下探風險。
關鍵價位與操作思路
壓力位:2118(布林中軌)、2126(日內高點)、2192(布林上軌)
支撐位:2044(布林下軌)、2000(整數關口)、1950(前期低點)
操作建議:
若跌破2050,可順勢持有空單
查看原文昨日以太坊2070-2080空單再次完美止盈出局,再次恭喜相信參謀長的朋友!從目前的趨勢來看,以太坊目前趨勢還是較為弱勢,操作時切勿盲目抄底,同時做空是也及時設置好止損,防止莊稼反人性心理。
從目前四小時以太坊技術指標解析:
布林帶(BOLL(20,2,0))中軌(MID):2118.25,上軌(UP):2192.25,下軌(LOW):2044.24,當前價格跌破中軌,接近下軌支撐,處於布林帶下行通道,短期偏空,下軌2044附近是第一支撐位,若跌破則下看1950-2000區間。
MACD(12,26,9)DIF:12.64,DEA:8.11,MACD:9.06,雖然MACD仍為正值,但DIF與DEA雙線向下,綠柱(空頭動能)持續放大,空頭趨勢明確,雙線若下穿0軸,將確認中期下跌趨勢。
KDJ(9,3,3)K:24.31,D:29.99,J:12.94,三線全部向下,J值已進入超賣區間(<20),短期超賣,存在技術性反彈需求,但K/D仍未金叉,反彈力度有限,反彈後仍有二次下探風險。
關鍵價位與操作思路
壓力位:2118(布林中軌)、2126(日內高點)、2192(布林上軌)
支撐位:2044(布林下軌)、2000(整數關口)、1950(前期低點)
操作建議:
若跌破2050,可順勢持有空單

- 打賞
- 按讚
- 留言
- 轉發
- 分享
新主播500U爆倉記
484
- 打賞
- 按讚
- 留言
- 轉發
- 分享
關注一下這邊 很重要 突破就是拍賣拒絕往上走 這附近很關鍵如果明天你們看的時間級別出現反轉 跟延續往上走 可以追關注一下這邊 很重要 突破就是拍賣拒絕往上走 這附近很關鍵如果明天你們看的時間級別出現反轉 跟延續往上走 可以追
查看原文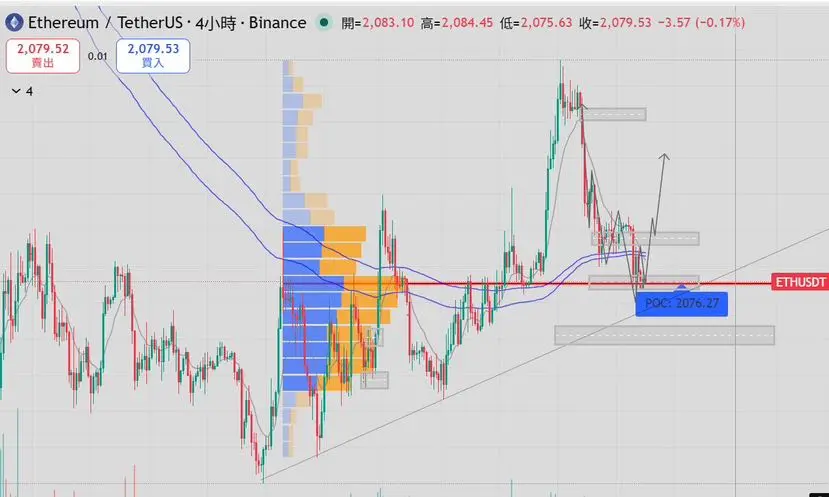

- 打賞
- 按讚
- 留言
- 轉發
- 分享
#晒出我的合约收益
今日第一單來了
標的:ETH
方向:反彈做空
交易邏輯:4小時和1小時都未扭轉空頭背景,15分鐘只是從低位技術性反彈;只要價格反彈到上方供給區但站不穩,就順主趨勢做空
關鍵位置:壓力 2062-2074,強壓力 2088-2112,支撐 2040,強支撐 2023
進場條件:優先等待價格反彈到 2064-2072 區間,15分鐘出現沖高回落或放量上影,再分批進空;如果直接在 2054 附近橫盤,不追單
止損條件:放在 2082 上方
止盈條件:第一目標 2042,第二目標 2025,第三目標 1992
失效條件:
1小時實體站穩 2074 上方,這次反彈空的邏輯開始削弱
1小時放量站上 2088,今天就不再優先看空,改為等待回踩再評估
若比特幣同步強收回關鍵壓力,二次比特幣空單也要主動降級
$ETH
ETH-2.12%
【當前用戶分享了他的交易卡片,若想瞭解更多優質交易資訊,請到 App 版查看】
- 打賞
- 2
- 留言
- 轉發
- 分享
#OpenAIPlansDesktopSuperApp 科技界因OpenAI據報計劃推出一款功能強大的桌面超級應用而興奮不已,這一舉措可能會重新定義我們在日常生活中與人工智能的互動方式。這一雄心勃勃的步驟標誌著AI從單純工具轉變為完全集成的數字伴侶,可以管理任務、提升生產力並增強創意——所有這些都來自單一平台。
「超級應用」不只是另一個軟體更新;它是一個完整的生態系統。可以將其視為一個統一的工作空間,多個功能——聊天、內容創建、編碼、研究、日程安排,甚至業務運營——都無縫連接。OpenAI的願景似乎圍繞將所有這些功能引入一個桌面應用程式,消除在多個工具和平台之間切換的必要性。
該發展最令人興奮的方面之一是深度個性化的潛力。該應用可以從用戶行為、偏好和工作流程中學習,提供高度定制的建議和自動化。無論你是學生、內容創作者、交易員還是開發人員,AI都可以適應你的具體需求,使你的工作更快、更高效。
對於專業人士而言,這可能是一個遊戲改變者。想象在一個由先進AI驅動的界面中撰寫報告、分析數據、生成演示文稿並與團隊溝通——所有這些都在一個界面內完成。開發人員可以更有效地編寫和調試代碼,而營銷人員和作家可以在短時間內創建高品質內容。這種級別的集成可以大大減少日常任務中的摩擦。
另一個主要優勢是離線和桌面級別的性能。與基於瀏覽器的工具不同,桌面超級應用可以更有效地利用系統資源,提供更快的響應時間
查看原文「超級應用」不只是另一個軟體更新;它是一個完整的生態系統。可以將其視為一個統一的工作空間,多個功能——聊天、內容創建、編碼、研究、日程安排,甚至業務運營——都無縫連接。OpenAI的願景似乎圍繞將所有這些功能引入一個桌面應用程式,消除在多個工具和平台之間切換的必要性。
該發展最令人興奮的方面之一是深度個性化的潛力。該應用可以從用戶行為、偏好和工作流程中學習,提供高度定制的建議和自動化。無論你是學生、內容創作者、交易員還是開發人員,AI都可以適應你的具體需求,使你的工作更快、更高效。
對於專業人士而言,這可能是一個遊戲改變者。想象在一個由先進AI驅動的界面中撰寫報告、分析數據、生成演示文稿並與團隊溝通——所有這些都在一個界面內完成。開發人員可以更有效地編寫和調試代碼,而營銷人員和作家可以在短時間內創建高品質內容。這種級別的集成可以大大減少日常任務中的摩擦。
另一個主要優勢是離線和桌面級別的性能。與基於瀏覽器的工具不同,桌面超級應用可以更有效地利用系統資源,提供更快的響應時間

- 打賞
- 3
- 2
- 轉發
- 分享
Yusfirah:
直達月球 🌕查看更多
ETH
Following BTC's trend, the weekend phase is dominated by bearish sentiment
After dipping to the 2026 level in the early morning, supported by rebound
Currently experiencing pressure again in the 2075 zone
As the rebound momentum continues to weaken
The bears show signs of further downside movement
From a technical structure perspective, the overall pattern is bearish
4-hour and hourly charts resonate downward
All indicators diverge downward with bearish bias
The trading approach is to follow the trend
Reference: Short in the 2065-2090 zone
Target: 1980-1950 area
查看原文Following BTC's trend, the weekend phase is dominated by bearish sentiment
After dipping to the 2026 level in the early morning, supported by rebound
Currently experiencing pressure again in the 2075 zone
As the rebound momentum continues to weaken
The bears show signs of further downside movement
From a technical structure perspective, the overall pattern is bearish
4-hour and hourly charts resonate downward
All indicators diverge downward with bearish bias
The trading approach is to follow the trend
Reference: Short in the 2065-2090 zone
Target: 1980-1950 area
- 打賞
- 1
- 留言
- 轉發
- 分享
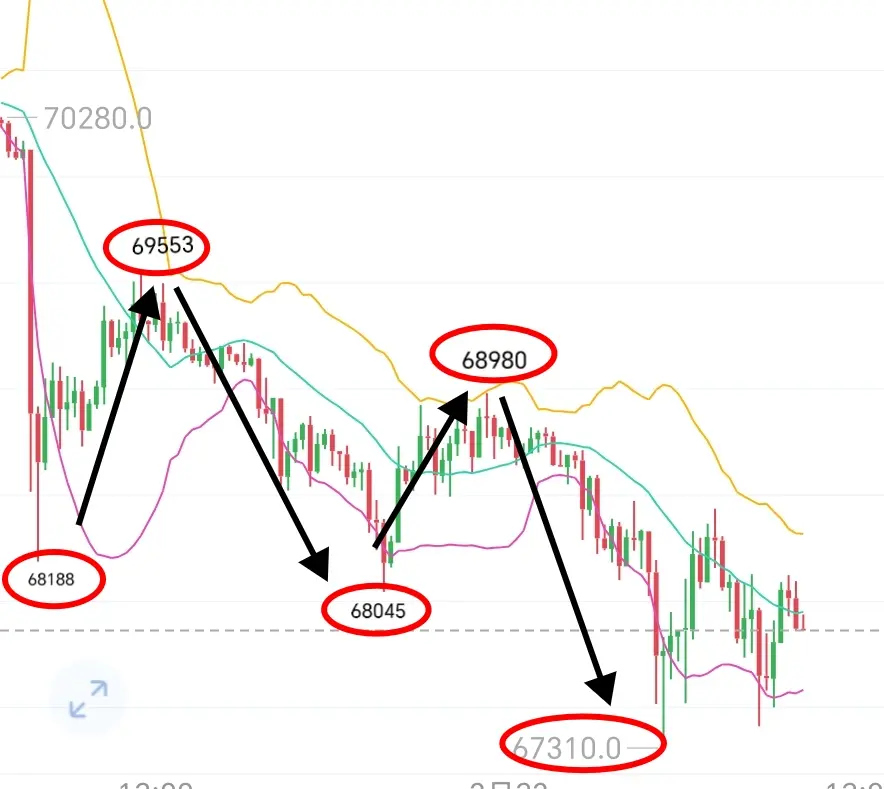
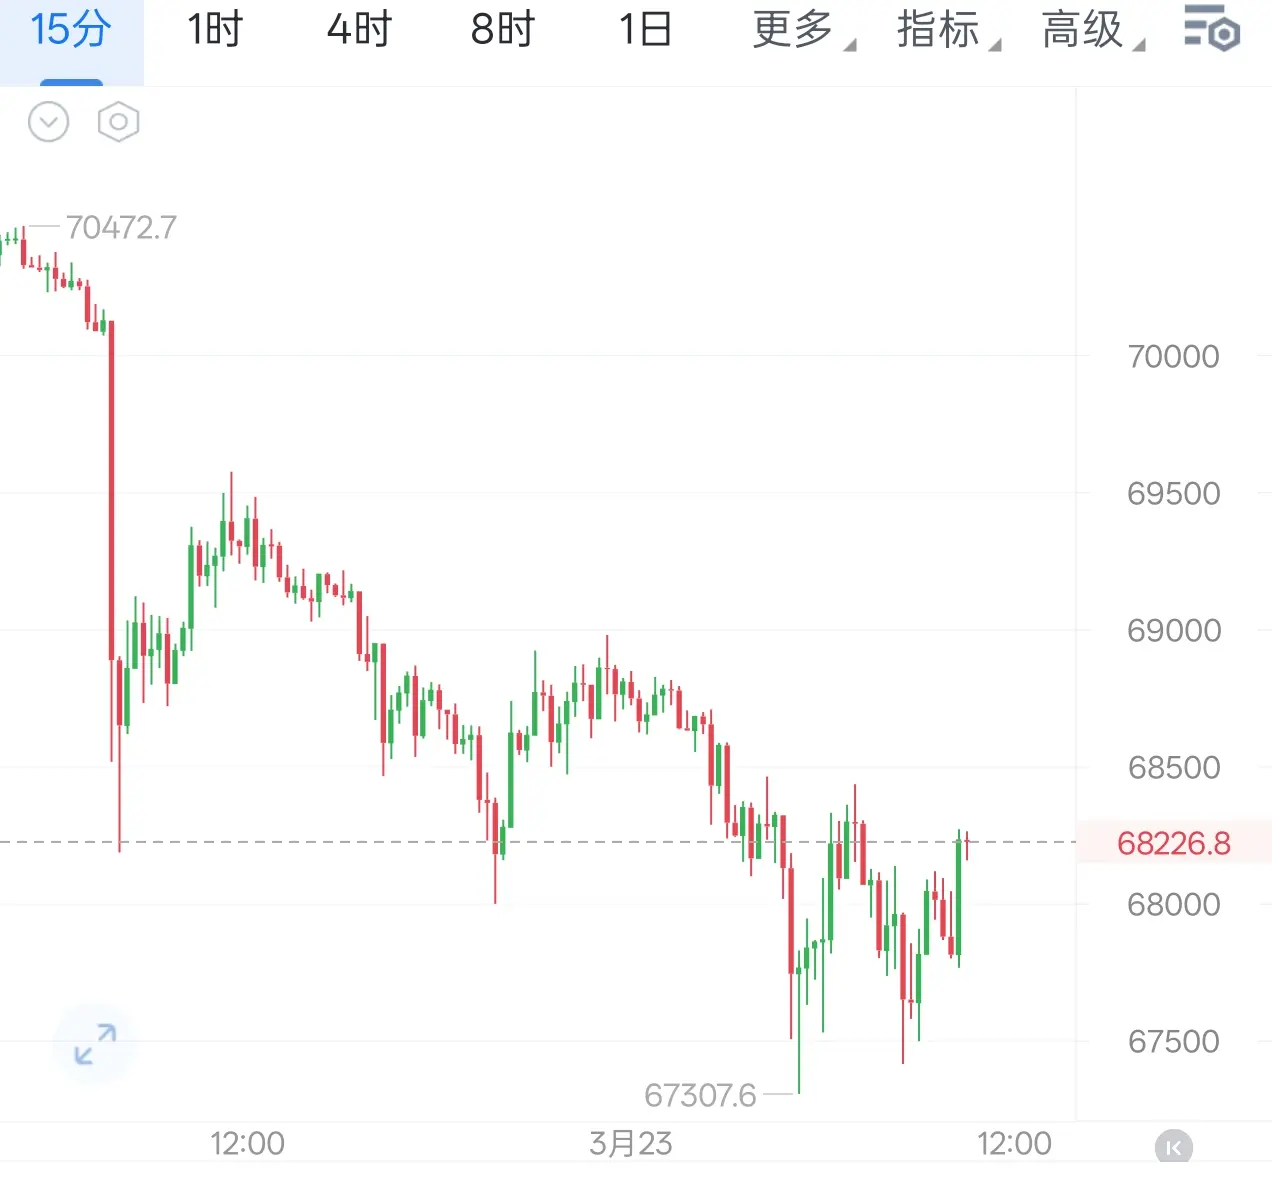
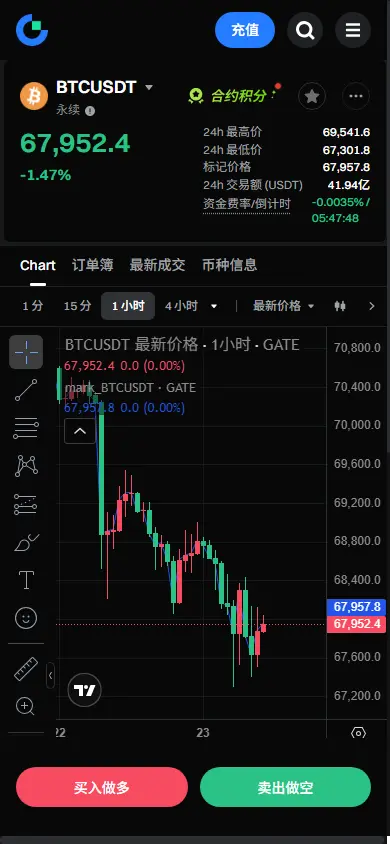
Bitcoin Today's Analysis
The price has descended from the high of 70992.7 to 67642.5, currently oscillating around 68200, which represents a weak rebound phase following the decline. The 15-minute level clearly shows a downtrend with continuously lower highs and declining lows, weak rebound momentum. Currently, 68500–69000 above is a small-level rebound resistance zone, further up is 69500–70000 strong resistance.
Support: 67600 below is the recent low, a break below will further open downside space, targeting 66500–66000.
Entry: Rebound to 68500–68800 zone, and 15-minute K-line shows stagnati
BTC-1.48%
- 打賞
- 2
- 留言
- 轉發
- 分享
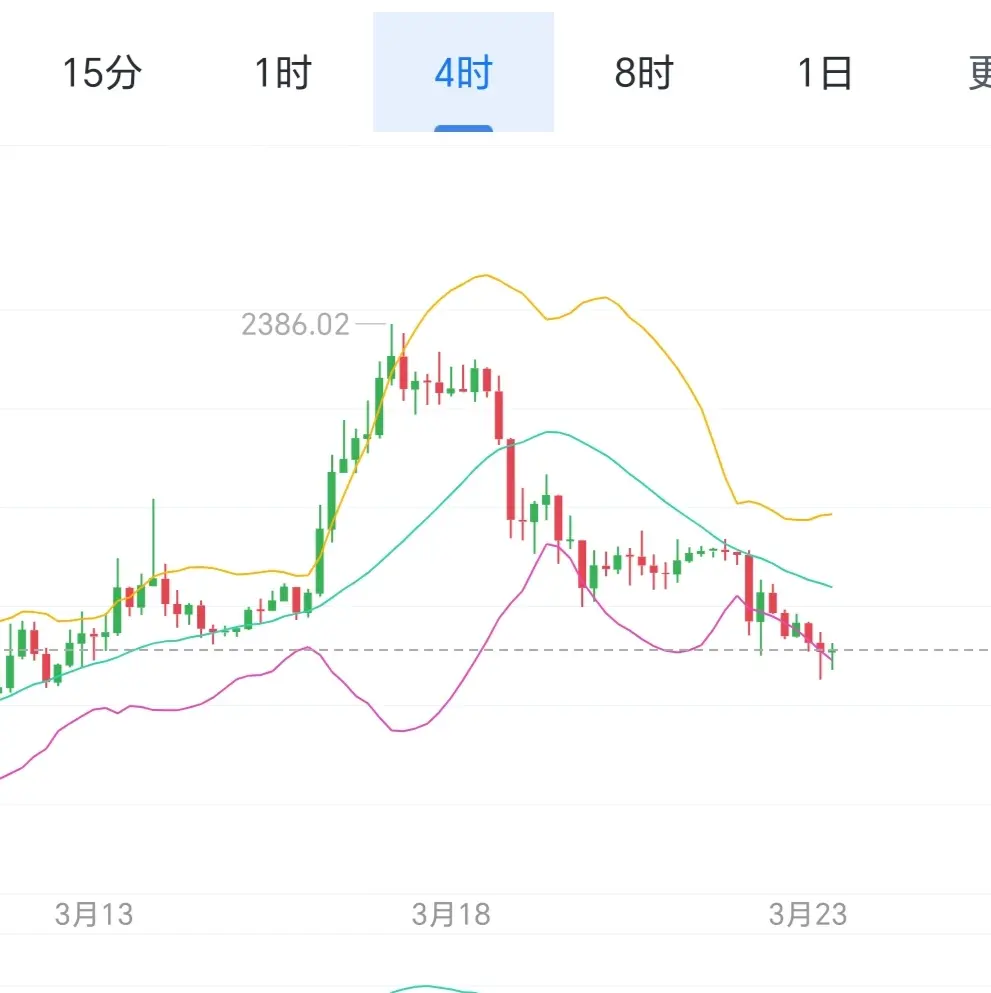
Monday Morning Bitcoin Technical Analysis Latest Insights:
In crypto, one day equals ten years in the real world. Those who can endure the lows are worthy of the peaks. This morning Bitcoin touched a high of 68474 before pulling back to a low of 67445. Ethereum reached a morning high of 2074 before falling to a morning low of 2034.
From the 4-hour timeframe perspective, the price has effectively broken through multiple short-term moving averages, with the moving average system showing a clear bearish alignment pattern, with upper moving averages forming layered resistance. In terms of price ac
BTC-1.48%
- 打賞
- 3
- 留言
- 轉發
- 分享

🎶
GTRS
創建人@2026我要赚100W
上市進度
0.00%
市值:
$0.1
更多代幣
【$BTCUSDT】多空博弈白热化
$BTC 價格在布林帶下軌附近反復測試,RSI跌至33,空頭動能看似主導。但4小時MACD柱狀圖在負值區域收窄,空頭力量衰竭的跡象開始浮現。盤中常規波動期,買賣盤深度嚴重失衡,賣一檔67892堆積了13.7個BTC的巨量賣單,而買盤深度稀薄,大戶在暗中吸籌,這種掛單結構更像是利用薄買盤製造恐慌。持倉量穩定,價格下跌並未引發大規模爆倉盤,資金並未真正離場。
現價67850附近可以嘗試輕倉接多,嚴格防守放在66650下方。第一目標看71300,突破後看73150。這筆交易盈虧比超過4倍,值得用有限風險去博弈一次空頭陷阱後的反彈。分批入場,推保本損。
查看實時行情 👇 $BTC
---
關注我:獲取更多加密市場實時分析與洞察! $BTC $ETH $SOL
#Gate13周年全球庆典 #TradFi首创多倍杠杆 #加密行情震荡
查看原文$BTC 價格在布林帶下軌附近反復測試,RSI跌至33,空頭動能看似主導。但4小時MACD柱狀圖在負值區域收窄,空頭力量衰竭的跡象開始浮現。盤中常規波動期,買賣盤深度嚴重失衡,賣一檔67892堆積了13.7個BTC的巨量賣單,而買盤深度稀薄,大戶在暗中吸籌,這種掛單結構更像是利用薄買盤製造恐慌。持倉量穩定,價格下跌並未引發大規模爆倉盤,資金並未真正離場。
現價67850附近可以嘗試輕倉接多,嚴格防守放在66650下方。第一目標看71300,突破後看73150。這筆交易盈虧比超過4倍,值得用有限風險去博弈一次空頭陷阱後的反彈。分批入場,推保本損。
查看實時行情 👇 $BTC
---
關注我:獲取更多加密市場實時分析與洞察! $BTC $ETH $SOL
#Gate13周年全球庆典 #TradFi首创多倍杠杆 #加密行情震荡
- 打賞
- 3
- 留言
- 轉發
- 分享
【報名領 210 USDT,完成任務再領 30g 金條】
🚨理財人速看!Gate余幣寶「贏好禮第1期」殺瘋了🔥
活動時間:2026 年 3 月 17 日 16:00 - 2026 年 3 月 31 日 16:00(UTC+8)
✅ 簡單報名 → 白拿 10 USDT(僅限 10000 份,先到先得)
✅ 參與理財 → 再賺最高 200 USDT
✅ VIP5-VIP14 專享 2.5% 年化 + 最高 30g 黃金
總獎勵拉滿:210 USDT + 實物黃金
⚠️最後提醒!
門檻低、獎勵實在,時間就到 3 月 31 號,收益&黃金一次薅爽👇
https://jump.do/zh-Hans/xlink?checkProxy=true&proxyId=5
查看原文🚨理財人速看!Gate余幣寶「贏好禮第1期」殺瘋了🔥
活動時間:2026 年 3 月 17 日 16:00 - 2026 年 3 月 31 日 16:00(UTC+8)
✅ 簡單報名 → 白拿 10 USDT(僅限 10000 份,先到先得)
✅ 參與理財 → 再賺最高 200 USDT
✅ VIP5-VIP14 專享 2.5% 年化 + 最高 30g 黃金
總獎勵拉滿:210 USDT + 實物黃金
⚠️最後提醒!
門檻低、獎勵實在,時間就到 3 月 31 號,收益&黃金一次薅爽👇
https://jump.do/zh-Hans/xlink?checkProxy=true&proxyId=5

- 打賞
- 2
- 留言
- 轉發
- 分享
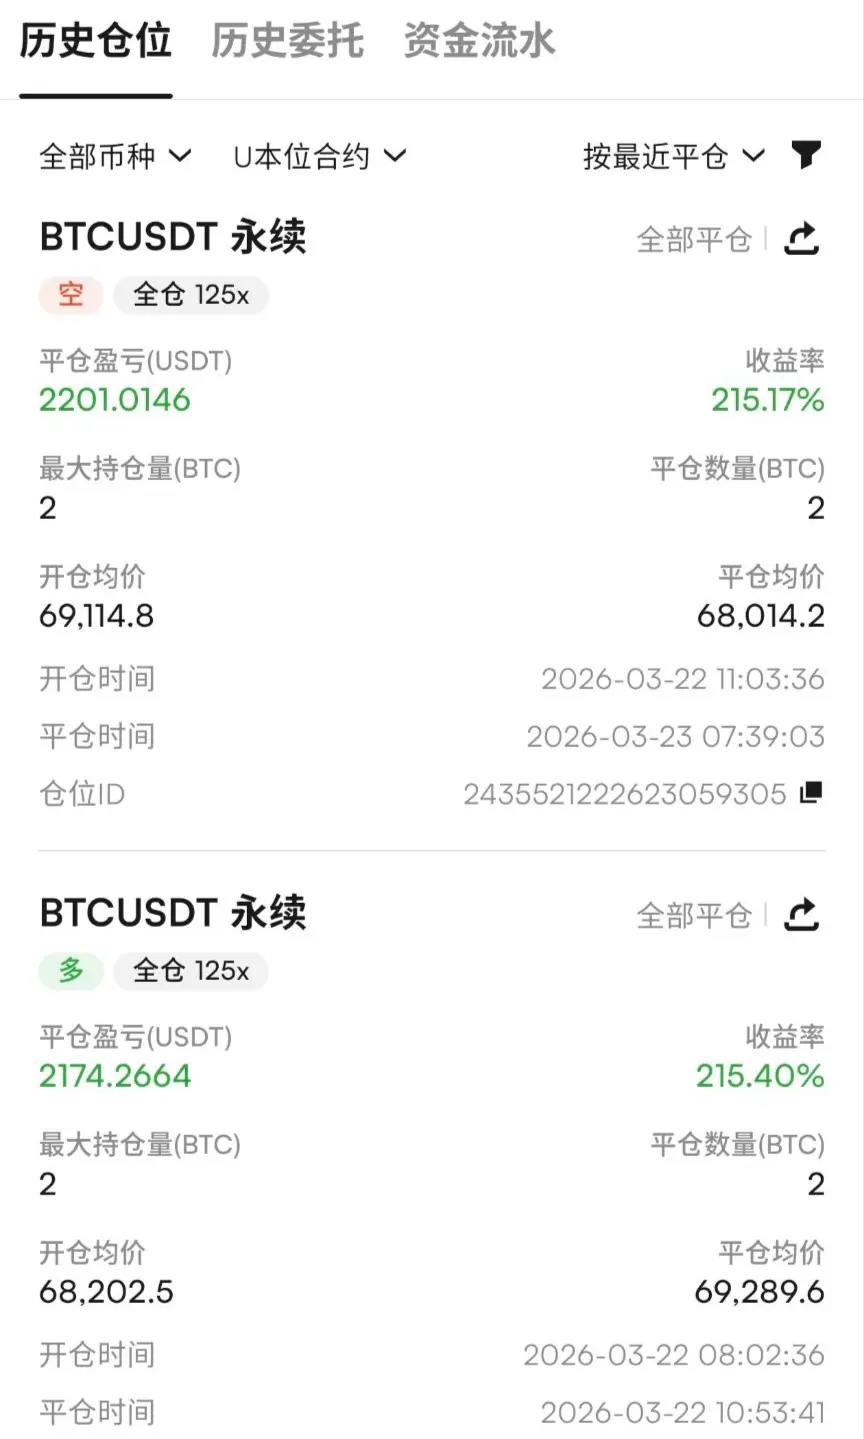
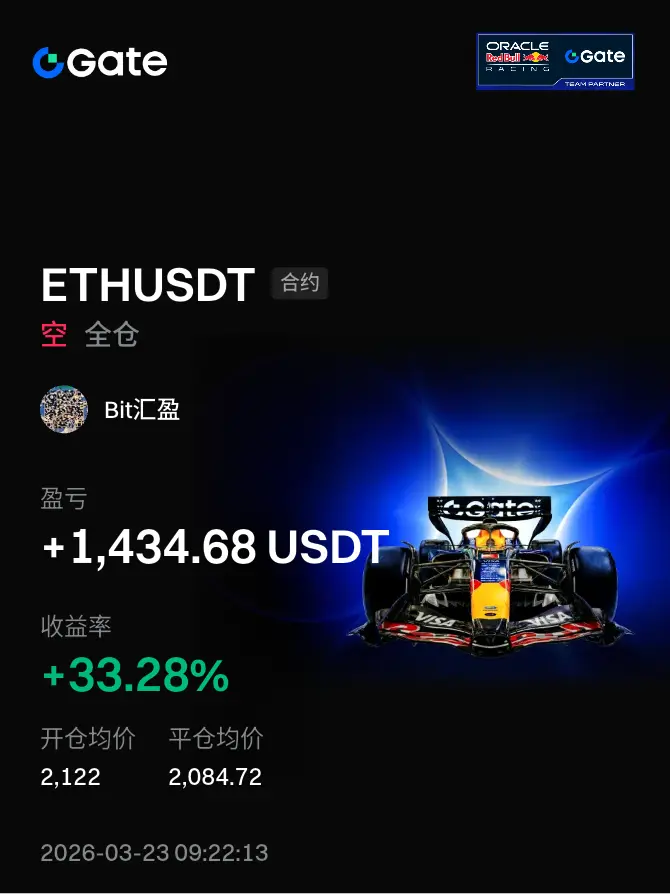
Last Wednesday, I shorted at three levels: 76,000, 74,700, and 71,200. For Ethereum, I shorted at 2,040-2,050. The profits have been very strong, and the market has been favorable, allowing me to hold positions with returns exceeding 1,000%. I'm monitoring whether the whales will wash back and forth, preparing to close positions and switch to going long.
查看原文
【當前用戶分享了他的交易卡片,若想瞭解更多優質交易資訊,請到 App 版查看】
- 打賞
- 2
- 留言
- 轉發
- 分享
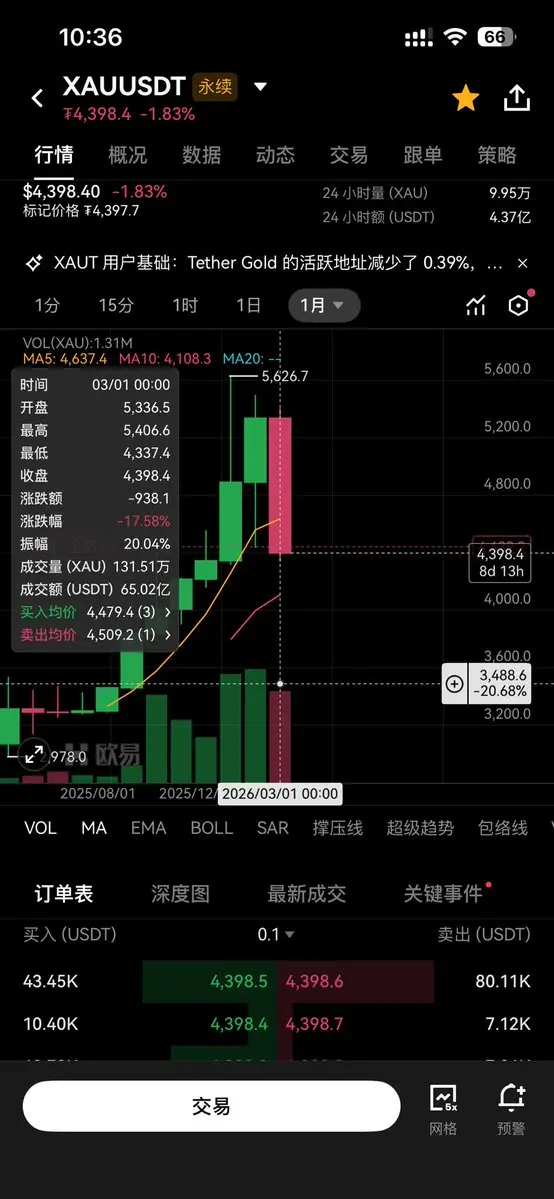
黃金3周跌了17%
但目前並沒有止跌跡象,很有可能還有一大段下跌空間。
為什麼?
1. 美元走強
2. 美債收益率上升
3. 降息預期被打破
4. 油價還在沖高
今天的市場已經不是避險先買黃金,而是用現金來避險,而美金就是最佳的避險現金,美債的年化已經高達5%
近期黃金連續承壓,核心原因就是更強的美元和更高的利率預期。
從技術面看,接下來可以重點觀察 4300、4200 一帶的支撐反應;
如果走勢繼續走弱,也不能排除進一步下探 4000 附近的可能。
所以目前階段不適合重倉抄底,還需要觀察接下來會不會出現止跌信號。
查看原文但目前並沒有止跌跡象,很有可能還有一大段下跌空間。
為什麼?
1. 美元走強
2. 美債收益率上升
3. 降息預期被打破
4. 油價還在沖高
今天的市場已經不是避險先買黃金,而是用現金來避險,而美金就是最佳的避險現金,美債的年化已經高達5%
近期黃金連續承壓,核心原因就是更強的美元和更高的利率預期。
從技術面看,接下來可以重點觀察 4300、4200 一帶的支撐反應;
如果走勢繼續走弱,也不能排除進一步下探 4000 附近的可能。
所以目前階段不適合重倉抄底,還需要觀察接下來會不會出現止跌信號。
- 打賞
- 1
- 留言
- 轉發
- 分享


Cboe股票交易所向美国证交会提交近24小时交易提案,目标2026年12月
全球交易所运营商Cboe Global Markets向美国证券交易委员会提交了一份提案,旨在推出美国股票近乎24小时交易,每周五天。
该计划将通过Cboe旗下的EDGX交易所实施,目标上线时间为2026年12月。如果获批,该系统将允许投资者在传统交易时间之外进行股票交易,这突破了以往的限制。
该举措反映了市场对交易时间灵活性的需求不断增加,特别是来自身处不同时区的全球投资者的需求。此外,电子交易技术的发展也为延长股票市场运营时间创造了机会。
近24小时交易被认为可以提高市场流动性和效率,但同时也带来了新的挑战,如在非主要交易时段可能出现的波动性增加,以及需要更严格的监管。
该提案目前正在等待监管部门批准后方可实施。如果获批,这一举措将可能成为美国股票市场未来运营方式的重大变化。
查看原文全球交易所运营商Cboe Global Markets向美国证券交易委员会提交了一份提案,旨在推出美国股票近乎24小时交易,每周五天。
该计划将通过Cboe旗下的EDGX交易所实施,目标上线时间为2026年12月。如果获批,该系统将允许投资者在传统交易时间之外进行股票交易,这突破了以往的限制。
该举措反映了市场对交易时间灵活性的需求不断增加,特别是来自身处不同时区的全球投资者的需求。此外,电子交易技术的发展也为延长股票市场运营时间创造了机会。
近24小时交易被认为可以提高市场流动性和效率,但同时也带来了新的挑战,如在非主要交易时段可能出现的波动性增加,以及需要更严格的监管。
该提案目前正在等待监管部门批准后方可实施。如果获批,这一举措将可能成为美国股票市场未来运营方式的重大变化。


- 打賞
- 2
- 留言
- 轉發
- 分享
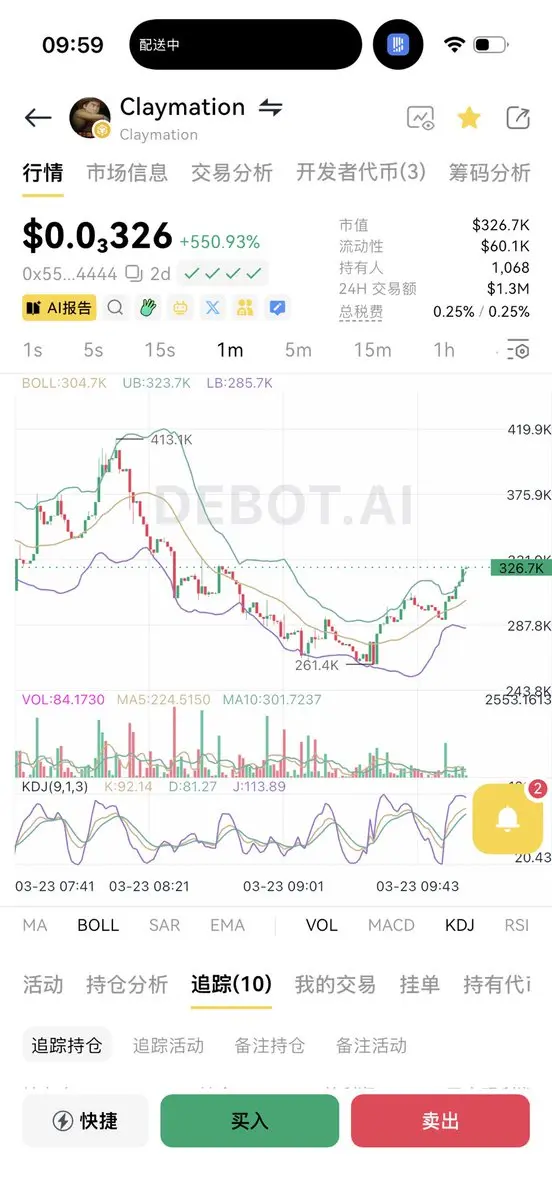
This clay token is showing fund inflows based on the trend
Yesterday I messaged two friends privately, didn't expect it to ferment this quickly
$claymation
查看原文Yesterday I messaged two friends privately, didn't expect it to ferment this quickly
$claymation

- 打賞
- 2
- 留言
- 轉發
- 分享
🌈 #GateLiveStreamingInspiration - Mar.23
立即上線以下主題以獲得額外官方支持和推廣曝光!
今日主題建議:
🔹 礦工退場?BTC挖礦難度下降7.8%,算力流向AI——底部信號浮現?
🔹 鯨魚持續買入ETH!再購入2,013枚ETH,總持倉達122,300枚
🔹 預測市場變得有趣!Polymarket推出新市場:"特朗普本週會說什麼?"
🔹 美伊談判升溫!強硬立場曝光——短期停火仍不太可能
🔹 恐慌見頂!恐懼指數跌至8,市場進入"極度恐懼"區域
🔹 大幅寬鬆!美國取消加密貨幣ETF期權持倉限制——機構資本終於要all-in?
🔹 大玩家再平衡!Rune黃金20倍做多同時清算標普空頭
🔹 富達呼籲SEC:建立新規則允許券商直接交易加密貨幣
🔹 利率路徑搖擺!4月維持不變概率87.6%,但市場仍警惕意外動向
🔥 現在開始直播:https://www.gate.com/live/apply
查看原文立即上線以下主題以獲得額外官方支持和推廣曝光!
今日主題建議:
🔹 礦工退場?BTC挖礦難度下降7.8%,算力流向AI——底部信號浮現?
🔹 鯨魚持續買入ETH!再購入2,013枚ETH,總持倉達122,300枚
🔹 預測市場變得有趣!Polymarket推出新市場:"特朗普本週會說什麼?"
🔹 美伊談判升溫!強硬立場曝光——短期停火仍不太可能
🔹 恐慌見頂!恐懼指數跌至8,市場進入"極度恐懼"區域
🔹 大幅寬鬆!美國取消加密貨幣ETF期權持倉限制——機構資本終於要all-in?
🔹 大玩家再平衡!Rune黃金20倍做多同時清算標普空頭
🔹 富達呼籲SEC:建立新規則允許券商直接交易加密貨幣
🔹 利率路徑搖擺!4月維持不變概率87.6%,但市場仍警惕意外動向
🔥 現在開始直播:https://www.gate.com/live/apply

- 打賞
- 2
- 留言
- 轉發
- 分享
加載更多
加入 4000萬 人匯聚的頭部社群
⚡️ 與 4000萬 人一起參與加密貨幣熱潮討論
💬 與喜愛的頭部創作者互動
👍 查看感興趣的內容
熱門話題
查看更多1677.18萬 熱度
59.04萬 熱度
117.63萬 熱度
5.76萬 熱度
67.9萬 熱度
熱門 Gate Fun
查看更多- 市值:$2300持有人數:10.00%
- 市值:$0.1持有人數:10.00%
- 市值:$2303.72持有人數:10.00%
- 市值:$2279.31持有人數:10.00%
- 市值:$2275.86持有人數:00.00%
最新消息
查看更多置頂
📢 Gate 廣場創作者衝榜火熱開啟!
發文贏獎勵,瓜分 1,500 USDT 總獎池 🔥
活動採用 曝光、互動、交易三重積分制——獲得更多曝光、贏得用戶互動、帶動真實交易,每一項都能為你累積積分,讓優質內容被看見、被獎勵。
✅ 總榜大獎:Top 10 創作者分享 1,050 USDT
✅ 新人 & 回歸激勵:5 位潛力作者各得 30 USDT
✅ 深度內容獎:6 篇優質長文各獲 50 USDT
📅 活動時間:3 月 19 日 - 4 月 4 日
📍 報名鏈接:https://www.gate.com/questionnaire/7494
📄 活動詳情:https://www.gate.com/zh/announcements/article/50265
原創內容、深度思考、真實互動——讓創作更有價值。
#Gate广场 #GateSquare #创作者冲榜 #内容挖矿福利加码,Gate 廣場明星帶單交易員三期招募開啟!
入駐發帖 · 瓜分 $30,000 月度獎池 & 千萬級流量扶持!
如何參與:
1️⃣ 報名成為跟單交易員:https://www.gate.com/copytrading/lead-trader-registration/futures
2️⃣ 報名活動:https://www.gate.com/questionnaire/7355
3️⃣ 入駐 Gate 廣場,持續發布交易相關原創內容
豐厚獎勵等你拿:
首發優質內容即得 $30 跟單體驗金
每雙周瓜分 $10,000U 內容獎池
Top 10 交易員額外瓜分 $20,000U 登榜獎池
精選帖推流、首頁推薦、周度明星交易員曝光
詳情:https://www.gate.com/announcements/article/50291🤖 尋找 Gate 廣場 AI 評測官!$50,000 懸賞令發布!
發帖聊 AI,獎金拿到手軟!新人首帖獎勵翻倍,單帖最高 200U!
📝 立即報名:https://www.gate.com/questionnaire/7477
1️⃣ 發帖得紅包,單帖最高 100U!
2️⃣ Top 體驗分享官:帶 #Gate广场AI测评官 聊技巧,贏國米球衣!
3️⃣ 收益率 PK 王:曬 AI 收益截圖,贏 Gate 定制運動套裝!
4️⃣ 深度好文額外加碼 30U 每篇張榜公布!
💬 來 Gate 廣場,把握行業新趨勢:https://www.gate.com/post
時間:3/12 18:00 – 3/27 24:00 (UTC+8)
詳情:https://www.gate.com/announcements/article/50206Gate 廣場內容挖礦獎勵繼續升級!無論您是創作者還是用戶,挖礦新人還是頭部作者都能贏取好禮獲得大獎。現在就進入廣場探索吧!
創作者享受最高60%創作返佣
創作者獎勵加碼1500USDT:更多新人作者能瓜分獎池!
觀眾點擊交易組件交易贏大禮!最高50GT等新春壕禮等你拿!
詳情:https://www.gate.com/announcements/article/49802