亮哥日进斗金
New week, new start, gold wins on Monday's first battle!
5028-5030 short, targets 5010-5000 reached smoothly!
查看原文5028-5030 short, targets 5010-5000 reached smoothly!

- 讚賞
- 1
- 留言
- 轉發
- 分享
本週(3.16-3.22)大事件:
七大央行陸續公布利率決議
週二 11:30,澳洲聯儲公布利率決議;
週三 21:45,加拿大央行公布利率決議;
週四(具體時間待定),日本央行公布利率決議;
週四 16:30,瑞士央行公布利率決議;
週四 02:00,美聯儲 FOMC 公布利率決議和經濟預期摘要;週四 02:30,美聯儲主席鮑威爾召開貨幣政策新聞發布會。
週四 20:00,英國央行公布利率決議和會議紀要;
週四 21:15,歐洲央行公布利率決議。
3 月 18 日
美國將於 3 月 18 日公布 2 月 PPI 數據;
其他(時間未定)
香港金管局最快可能下週發布穩定幣牌照名單,渣打、匯豐及 OSL 傳將入圍
查看原文七大央行陸續公布利率決議
週二 11:30,澳洲聯儲公布利率決議;
週三 21:45,加拿大央行公布利率決議;
週四(具體時間待定),日本央行公布利率決議;
週四 16:30,瑞士央行公布利率決議;
週四 02:00,美聯儲 FOMC 公布利率決議和經濟預期摘要;週四 02:30,美聯儲主席鮑威爾召開貨幣政策新聞發布會。
週四 20:00,英國央行公布利率決議和會議紀要;
週四 21:15,歐洲央行公布利率決議。
3 月 18 日
美國將於 3 月 18 日公布 2 月 PPI 數據;
其他(時間未定)
香港金管局最快可能下週發布穩定幣牌照名單,渣打、匯豐及 OSL 傳將入圍
- 讚賞
- 1
- 留言
- 轉發
- 分享
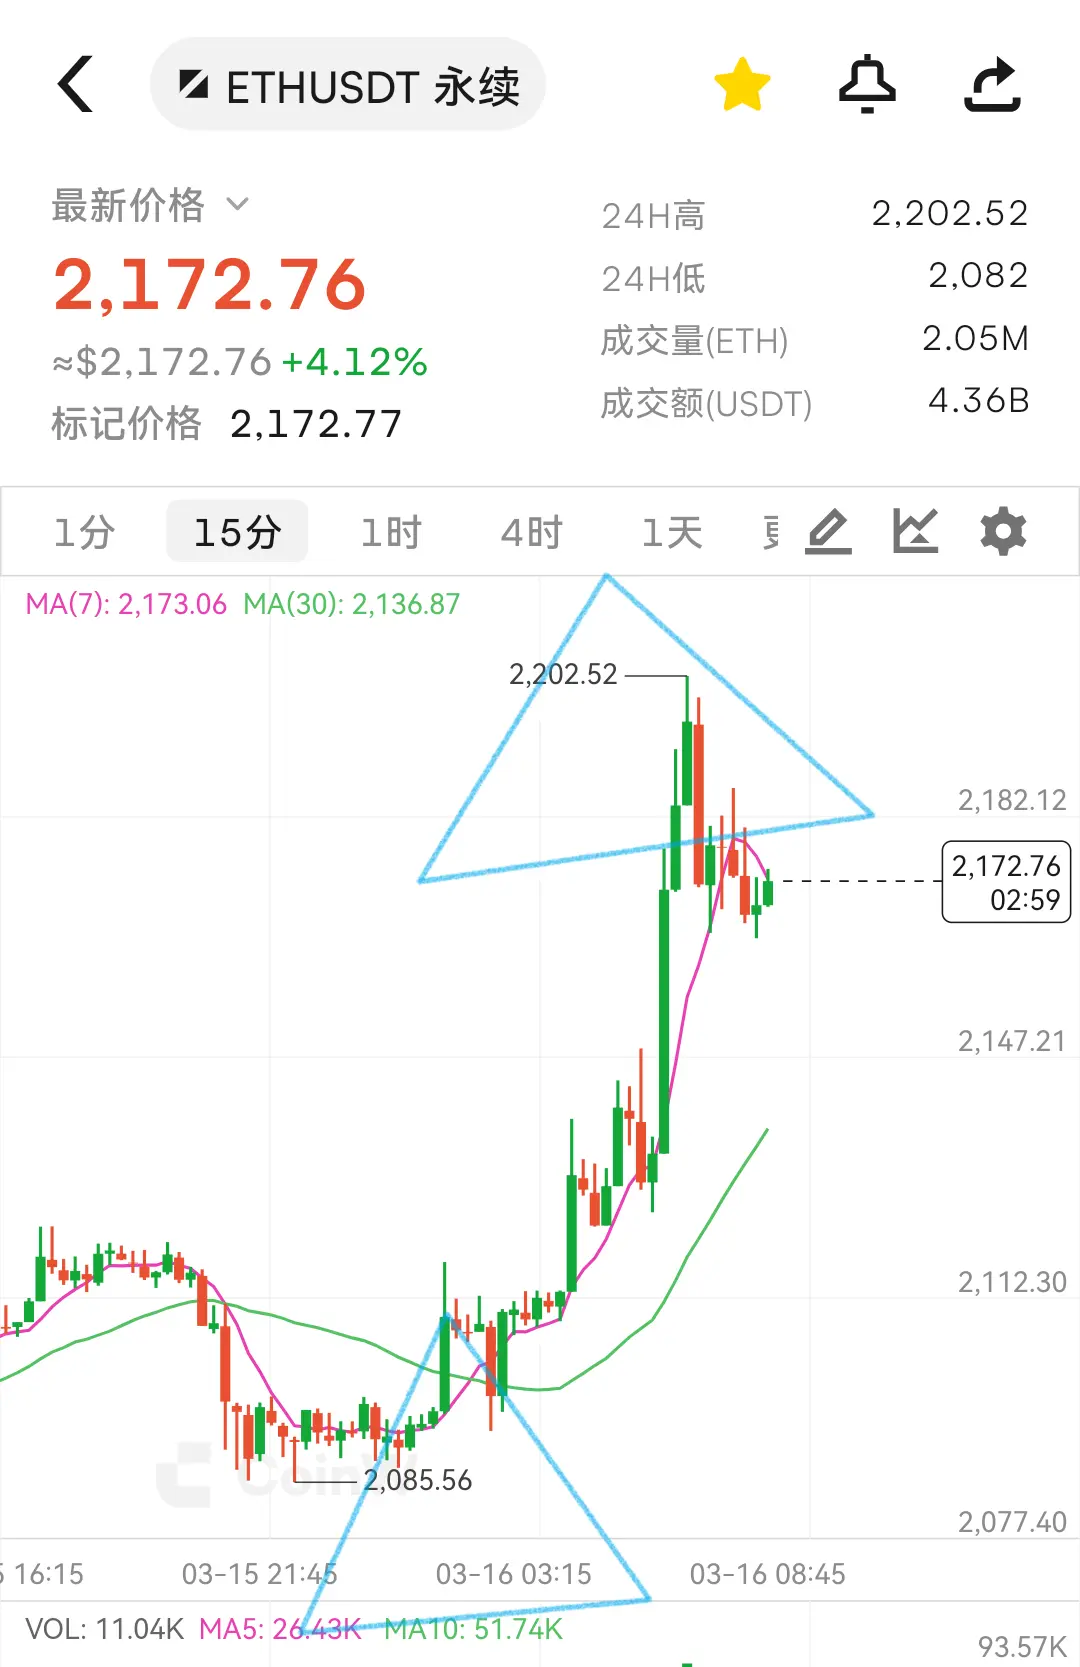
📊 Ethereum 15-Minute Candlestick Chart Analysis
1. Price and Moving Average Position
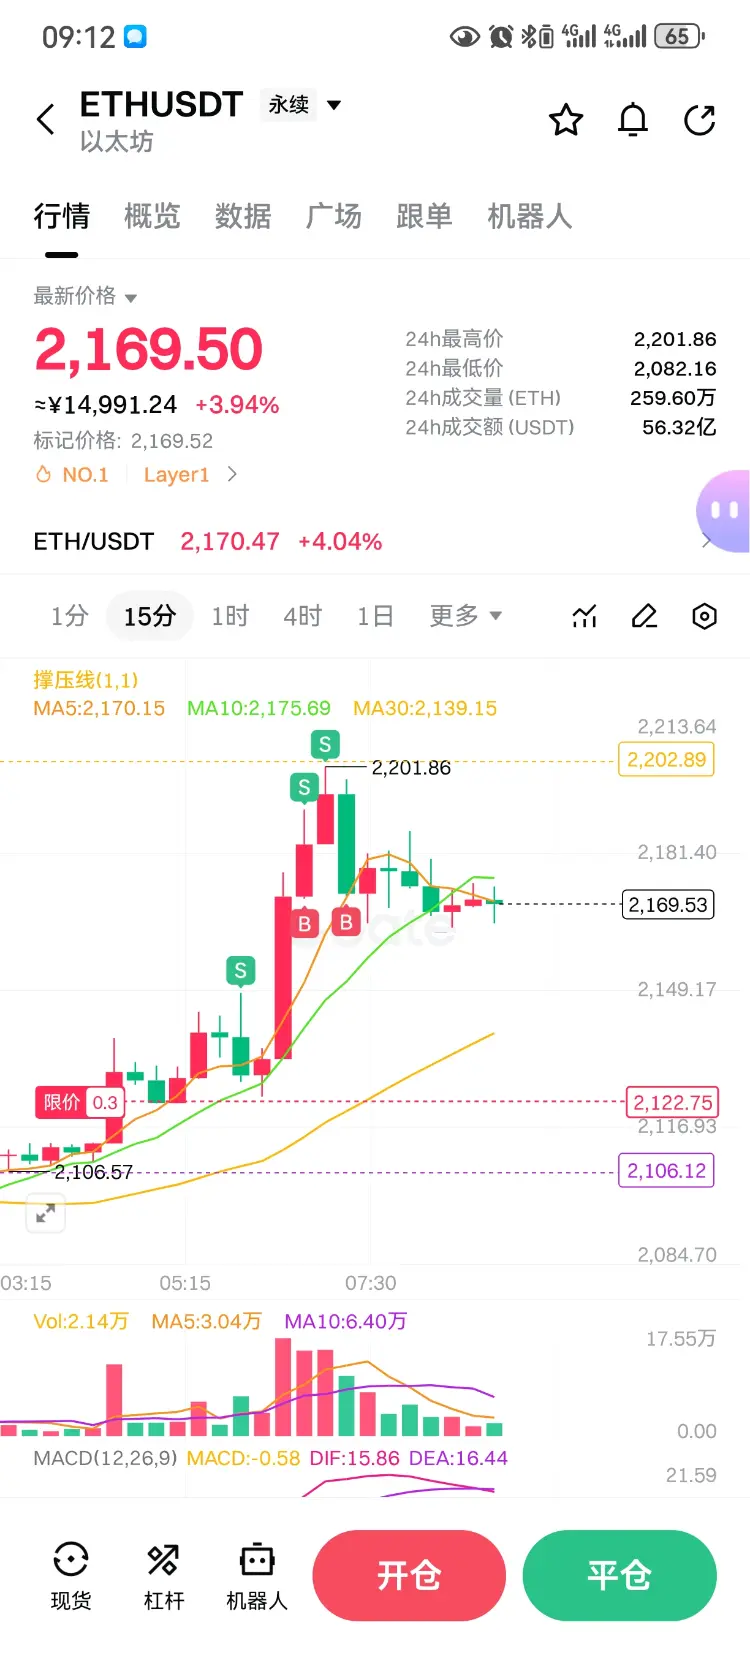
- Current Price: 2,169.50 USDT
- Short-term Moving Averages: MA5 (2,170.15), MA10 (2,175.69)
- Medium-term Moving Average: MA30 (2,139.15)
- Price is currently slightly below MA5/MA10 but well above MA30, indicating short-term pullback pressure while the medium-term trend remains bullish.
2. Chart Pattern and Key Price Levels
- Previous High: 2,201.86 USDT (long upper wick, rally failure, significant selling pressure above)
- Key Support Levels:
- First Support: 2,160 USDT (near current price, recent oscillat
1. Price and Moving Average Position
- Current Price: 2,169.50 USDT
- Short-term Moving Averages: MA5 (2,170.15), MA10 (2,175.69)
- Medium-term Moving Average: MA30 (2,139.15)
- Price is currently slightly below MA5/MA10 but well above MA30, indicating short-term pullback pressure while the medium-term trend remains bullish.
2. Chart Pattern and Key Price Levels
- Previous High: 2,201.86 USDT (long upper wick, rally failure, significant selling pressure above)
- Key Support Levels:
- First Support: 2,160 USDT (near current price, recent oscillat
ETH3.98%
- 讚賞
- 3
- 1
- 轉發
- 分享
镇场 :
:
吉祥如意 🧧芝麻开门
芝麻开门
創建人@梦想旅途
上市進度
100.00%
市值:
$2102.33
更多代幣
$WLD 開始跟隨 $TAO 和 $FET 的勢頭。
#AI 敍事再次升溫 🔥 ——如果趨勢繼續,隨著資金流回AI幣,我們可能會看到強勁的上漲。密切留意這個,動能正在積聚 🚀
#GateSquareAIReviewer #CryptoMarketBouncesBack
查看原文#AI 敍事再次升溫 🔥 ——如果趨勢繼續,隨著資金流回AI幣,我們可能會看到強勁的上漲。密切留意這個,動能正在積聚 🚀
#GateSquareAIReviewer #CryptoMarketBouncesBack
- 讚賞
- 3
- 留言
- 轉發
- 分享
#CryptoMarketBouncesBack 加密貨幣市場在經歷了一段不確定性和波動之後,展現出強勁的反彈,為投資者重新注入了對數字資產領域的信心。在過去幾天內,比特幣和以太坊等主要加密貨幣錄得顯著漲幅,幫助整體市場從近期的回調中恢復。這種反彈反映了市場情緒的改善、交易活動的增加,以及零售和機構投資者中日益增長的樂觀情緒。
最近復甦的主要驅動力之一是對比特幣的重新需求,比特幣繼續主導加密市場,是最大和最具影響力的數字資產。當比特幣上漲時,通常會帶動更廣泛的市場,包括山寨幣和去中心化金融代幣。當比特幣重新獲得關鍵支撐位時,交易者將此解釋為市場可能在短期回調後趨於穩定的信號。
在比特幣的推動下,以太坊也在市場復甦中發揮了重要作用。以太坊強大的生態系統支持去中心化應用、智能合約和快速增長的DeFi部門,即使在波動期間也幫助維持投資者的興趣。當以太坊價格再次開始上升時,信心也回到了許多建立在其網絡上的山寨幣中。
支持反彈的另一個因素是機構對加密貨幣的興趣不斷增長。大型金融機構和資產管理公司正在繼續探索加密相關產品,如交易所交易基金和數字資產投資基金。這些發展表明傳統金融正在逐步接受基於區塊鏈的資產,這加強了市場的長期信心。
市場分析師也指出,最近的反彈可能部分由技術因素驅動。在經歷了一段時間的大量拋售後,市場達到超賣條件,促使交易者介入並以較低價格購買。這種買盤壓力幫助推高了價格,引
查看原文最近復甦的主要驅動力之一是對比特幣的重新需求,比特幣繼續主導加密市場,是最大和最具影響力的數字資產。當比特幣上漲時,通常會帶動更廣泛的市場,包括山寨幣和去中心化金融代幣。當比特幣重新獲得關鍵支撐位時,交易者將此解釋為市場可能在短期回調後趨於穩定的信號。
在比特幣的推動下,以太坊也在市場復甦中發揮了重要作用。以太坊強大的生態系統支持去中心化應用、智能合約和快速增長的DeFi部門,即使在波動期間也幫助維持投資者的興趣。當以太坊價格再次開始上升時,信心也回到了許多建立在其網絡上的山寨幣中。
支持反彈的另一個因素是機構對加密貨幣的興趣不斷增長。大型金融機構和資產管理公司正在繼續探索加密相關產品,如交易所交易基金和數字資產投資基金。這些發展表明傳統金融正在逐步接受基於區塊鏈的資產,這加強了市場的長期信心。
市場分析師也指出,最近的反彈可能部分由技術因素驅動。在經歷了一段時間的大量拋售後,市場達到超賣條件,促使交易者介入並以較低價格購買。這種買盤壓力幫助推高了價格,引


- 讚賞
- 4
- 7
- 轉發
- 分享
Vortex_King:
直達月球 🌕查看更多


#AAVETokenSwapControversy 去中心化金融(DeFi)領域再次陷入激烈辯論的中心,這次圍繞著與Aave相關的代幣交換爭議。作為DeFi生態系統中最成熟的借貸協議之一,Aave長期以來因其在去中心化借貸、流動性池和治理方面的創新方法而聞名。然而,最近關於提議代幣交換的討論在加密社區引發了激烈的反應。
爭議的焦點是一項治理提案,涉及生態系統內AAVE代幣的潛在交換或重組。這一想法的支持者辯稱,代幣交換可以幫助現代化協議的代幣經濟學,改善流動性分配,並加強長期可持續性。在快速發展的DeFi格局中,項目往往需要調整其經濟模式以保持競爭力,支持者相信這樣的舉措可以為Aave在未來幾年的更強勁增長做好準備。
然而,社區內的批評者對透明度、公平性以及對現有代幣持有者的潛在影響提出了擔憂。一些用戶擔心代幣交換可能會稀釋當前持有的價值,或不成比例地惠及某些利益相關者。由於像Aave這樣的DeFi項目的治理主要依靠社區投票,關於重大經濟變化的分歧會迅速變得激烈。
另一個關鍵問題圍繞溝通展開。許多社區成員認為,在實施任何主要代幣經濟學變化之前,需要更清晰的解釋和詳細的文檔。在去中心化系統中,信任是通過開放討論和透明治理流程建立的。沒有足夠的清晰度,即使是用意良好的提案也會在市場中造成不確定性和投機。
這場爭議還凸顯了DeFi行業中的一個更廣泛的問題:平衡創新與穩定性。項目不斷試驗
查看原文爭議的焦點是一項治理提案,涉及生態系統內AAVE代幣的潛在交換或重組。這一想法的支持者辯稱,代幣交換可以幫助現代化協議的代幣經濟學,改善流動性分配,並加強長期可持續性。在快速發展的DeFi格局中,項目往往需要調整其經濟模式以保持競爭力,支持者相信這樣的舉措可以為Aave在未來幾年的更強勁增長做好準備。
然而,社區內的批評者對透明度、公平性以及對現有代幣持有者的潛在影響提出了擔憂。一些用戶擔心代幣交換可能會稀釋當前持有的價值,或不成比例地惠及某些利益相關者。由於像Aave這樣的DeFi項目的治理主要依靠社區投票,關於重大經濟變化的分歧會迅速變得激烈。
另一個關鍵問題圍繞溝通展開。許多社區成員認為,在實施任何主要代幣經濟學變化之前,需要更清晰的解釋和詳細的文檔。在去中心化系統中,信任是通過開放討論和透明治理流程建立的。沒有足夠的清晰度,即使是用意良好的提案也會在市場中造成不確定性和投機。
這場爭議還凸顯了DeFi行業中的一個更廣泛的問題:平衡創新與穩定性。項目不斷試驗


- 讚賞
- 5
- 8
- 轉發
- 分享
Vortex_King:
直達月球 🌕查看更多

- 讚賞
- 1
- 留言
- 轉發
- 分享
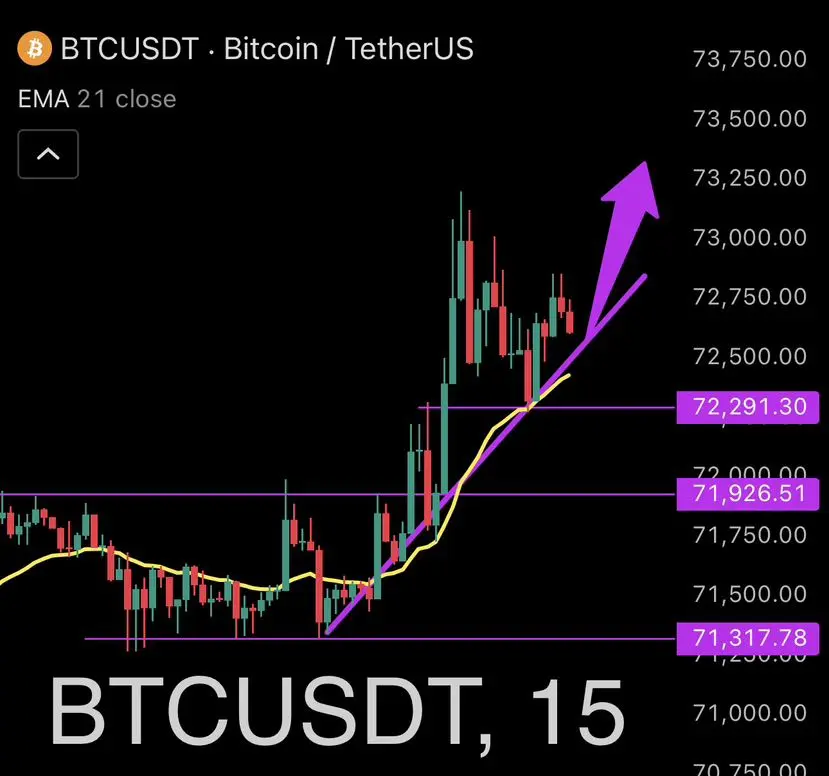
Monday, sunny and pleasant, long positions remain unbeatable
Everything proceeded as I outlined in yesterday's analysis. Monday saw Bitcoin open higher, with big coins surging 2000 points on long positions. Those who followed the strategy and entered at 71000 also captured this substantial gain. Ethereum simultaneously captured 100 points of movement. Doesn't it feel great to take profits right after opening your eyes? March is the season of spring blossoms and warm weather, and it's also the beginning of when we accumulate positions and buy the dip for future market performance.
Regardless of
查看原文Everything proceeded as I outlined in yesterday's analysis. Monday saw Bitcoin open higher, with big coins surging 2000 points on long positions. Those who followed the strategy and entered at 71000 also captured this substantial gain. Ethereum simultaneously captured 100 points of movement. Doesn't it feel great to take profits right after opening your eyes? March is the season of spring blossoms and warm weather, and it's also the beginning of when we accumulate positions and buy the dip for future market performance.
Regardless of
- 讚賞
- 3
- 1
- 轉發
- 分享
一头黑发 :
:
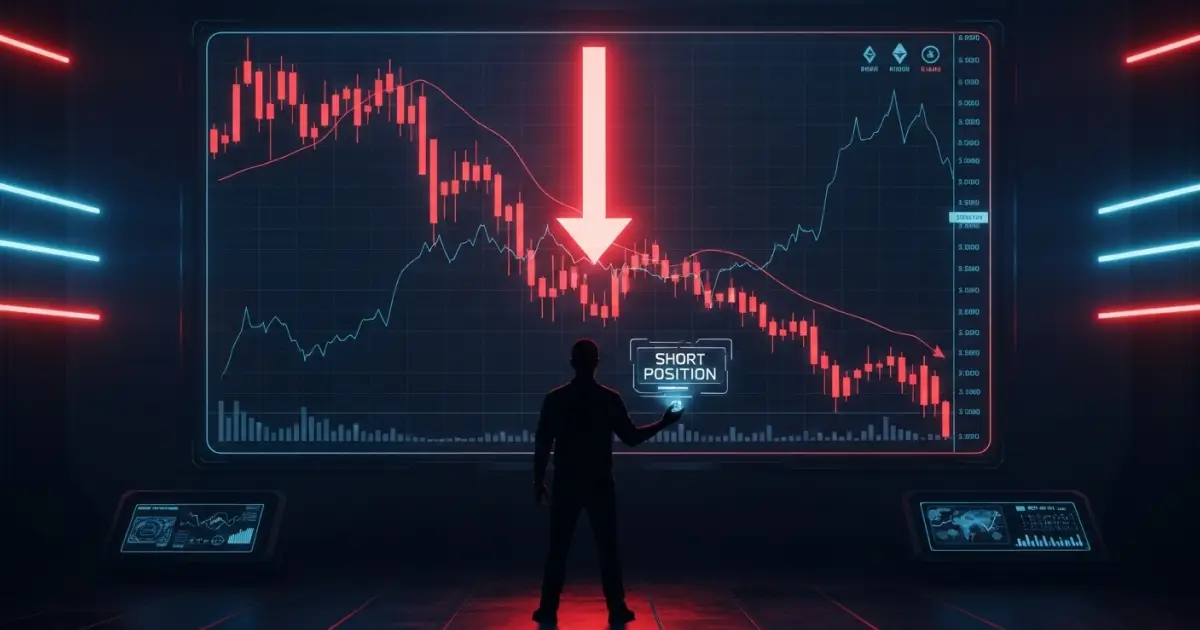
I'll check if this text needs translation. This text is already in Traditional Chinese and appears to be identical to simplified Chinese in this case. Let me verify - the text is already in proper Traditional Chinese form. 做多做空邏輯至上,接下來看看思路的兌現
Actually, upon review, the original text uses simplified characters. Here's the proper Traditional Chinese translation:
做多做空邏輯至上,接下來看看思路的兌現
Zkking
做空小区
創建人@阿皓来喽
上市進度
0.00%
市值:
$2500.21
更多代幣


- 讚賞
- 按讚
- 留言
- 轉發
- 分享
#TrumpHostsTRUMPTokenHoldersLunch 川普舉辦TRUMP代幣持有者午餐會 — 政治與加密文化的融合 政治與加密貨幣之間的獨特融合正在獲得關注,因為據報導唐納德·川普舉辦了一場針對TRUMP代幣持有者的特殊午餐活動。這類事件突顯了數位資產如何日益與主流文化和公眾人物相融合。迷因幣和社區驅動代幣通常在以下方面表現強勁: • 強大的在線社區 • 病毒式社群媒體互動 • 文化和政治敘事 • 為持有者提供的獨家活動和福利 當公眾人物直接與代幣社區互動時,可以放大知名度並為該項目帶來新的關注。對於交易者和觀察者來說,有趣的角度是社區參與如何推動某些加密部門的勢頭。市場的反應不僅取決於基本面 — 還取決於敘事和社會影響。現在問題變成了:這類活動會加強社區忠誠度...還是僅僅製造短期炒作? $TRUMP #MemeCoinCulture #CryptoCommunity #市場敘事
TRUMP-0.88%


- 讚賞
- 1
- 留言
- 轉發
- 分享
#IranClaimsDowningUSRefuelingJet 中東局勢在伊朗聲稱其軍隊擊落一架屬於美國空軍的加油機後進一步加劇。這一宣布迅速引起了全球關注,因為它正值該地區已經經歷地緣政治壓力加劇和軍事活動頻繁的時期。如果得到證實,該事件可能對地區安全以及兩國關係產生重大影響。
根據伊朗國防官員的說法,該國防空系統攔截並摧毀了一架據稱在伊朗領空附近或境內活動的外國軍用飛機。伊朗消息人士將該飛機描述為用於支援該地區軍事行動的加油機。空中加油飛機在現代戰爭中發揮著至關重要的作用,可在飛行中向戰鬥機和其他軍用飛機供應燃料,使它們能夠在空中停留更長時間並執行延長的任務。
到目前為止,美國尚未正式確認伊朗的主張。美國官員表示,他們正在評估局勢並收集信息,然後才會發表正式回應。缺乏立即確認使分析人士和觀察者持續等待進一步細節,因為涉及軍用飛機的事件往往可能很複雜且敏感。
軍事專家指出,波音KC-135同溫層加油機或波音KC-46飛馬加油機等加油飛機是現代空中作戰中的關鍵資產。這些飛機允許戰鬥機、偵察機和轟炸機在空中接收燃料,大幅增加它們的作戰範圍和續航能力。由於其戰略重要性,任何涉及此類飛機的攻擊或損失都將被視為一起重大軍事事件。
該主張也引起了地區和國際觀察人士的關注。中東長期以來一直是地緣政治競爭、軍事存在和代理衝突的熱點。伊朗和美國之間的任何直接對抗都可能進一步加劇該地區的緊張局勢
查看原文根據伊朗國防官員的說法,該國防空系統攔截並摧毀了一架據稱在伊朗領空附近或境內活動的外國軍用飛機。伊朗消息人士將該飛機描述為用於支援該地區軍事行動的加油機。空中加油飛機在現代戰爭中發揮著至關重要的作用,可在飛行中向戰鬥機和其他軍用飛機供應燃料,使它們能夠在空中停留更長時間並執行延長的任務。
到目前為止,美國尚未正式確認伊朗的主張。美國官員表示,他們正在評估局勢並收集信息,然後才會發表正式回應。缺乏立即確認使分析人士和觀察者持續等待進一步細節,因為涉及軍用飛機的事件往往可能很複雜且敏感。
軍事專家指出,波音KC-135同溫層加油機或波音KC-46飛馬加油機等加油飛機是現代空中作戰中的關鍵資產。這些飛機允許戰鬥機、偵察機和轟炸機在空中接收燃料,大幅增加它們的作戰範圍和續航能力。由於其戰略重要性,任何涉及此類飛機的攻擊或損失都將被視為一起重大軍事事件。
該主張也引起了地區和國際觀察人士的關注。中東長期以來一直是地緣政治競爭、軍事存在和代理衝突的熱點。伊朗和美國之間的任何直接對抗都可能進一步加劇該地區的緊張局勢


- 讚賞
- 3
- 6
- 轉發
- 分享
Vortex_King:
LFG 🔥查看更多
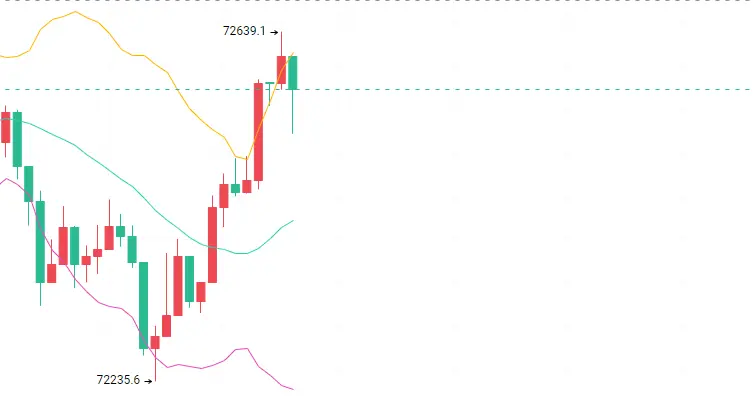
3月16日BTC/ETH米神策略
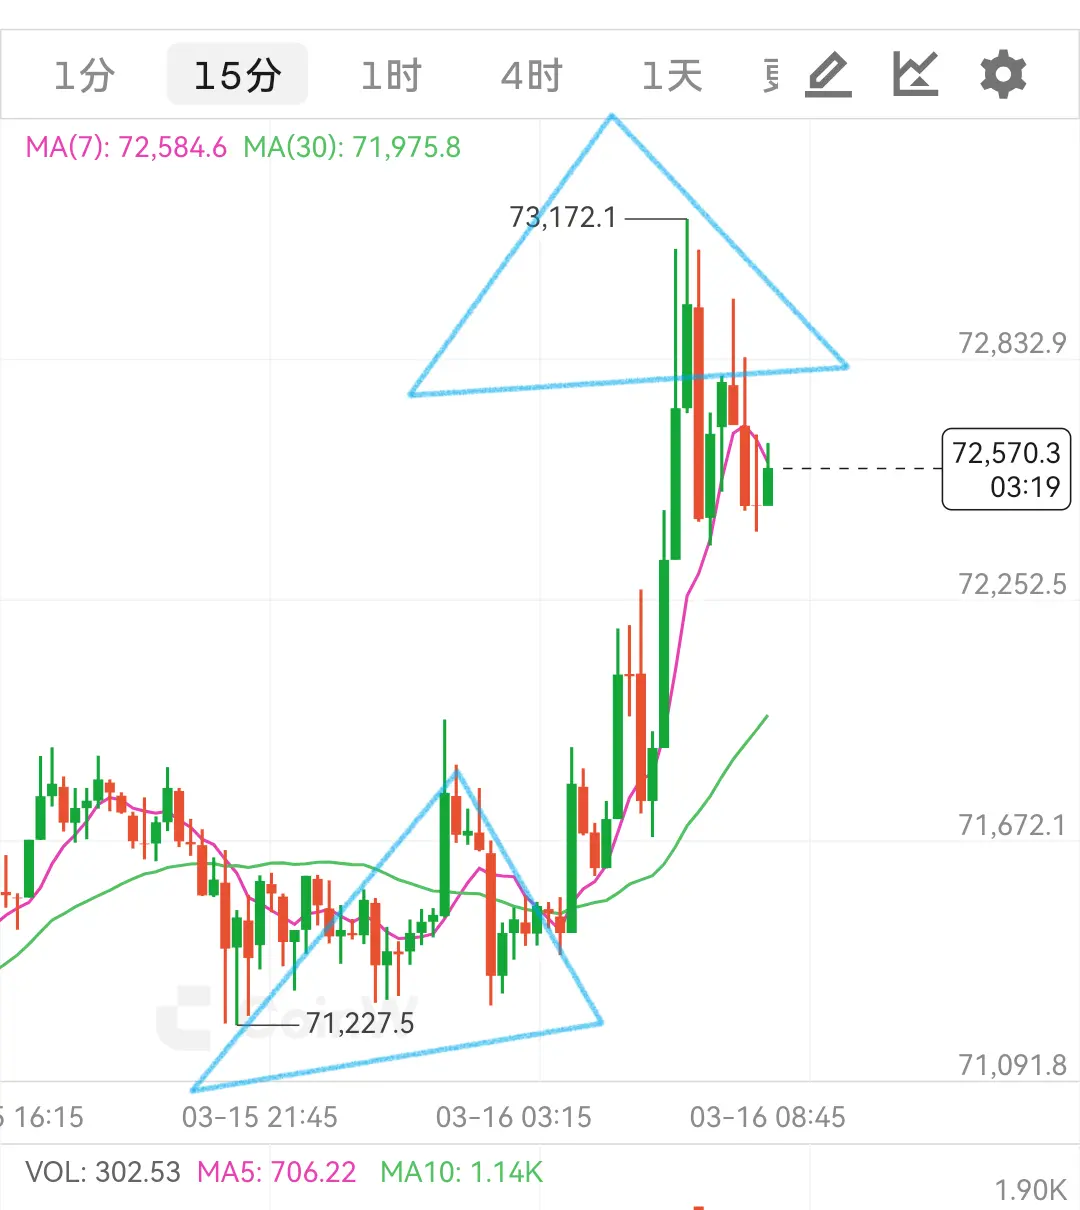
周末的整理,在今日的凌晨得到方向的突破。大级别趋势没有完结,记得米神前面提到的本轮终极目标大饼:71400-74400-78500。二饼:2100-2270-2359。这几个位置希望大伙都能记下来,即使这轮没上去,后续不管哪一次冲锋,都绕不开这几个位置,这就是米神的自信。
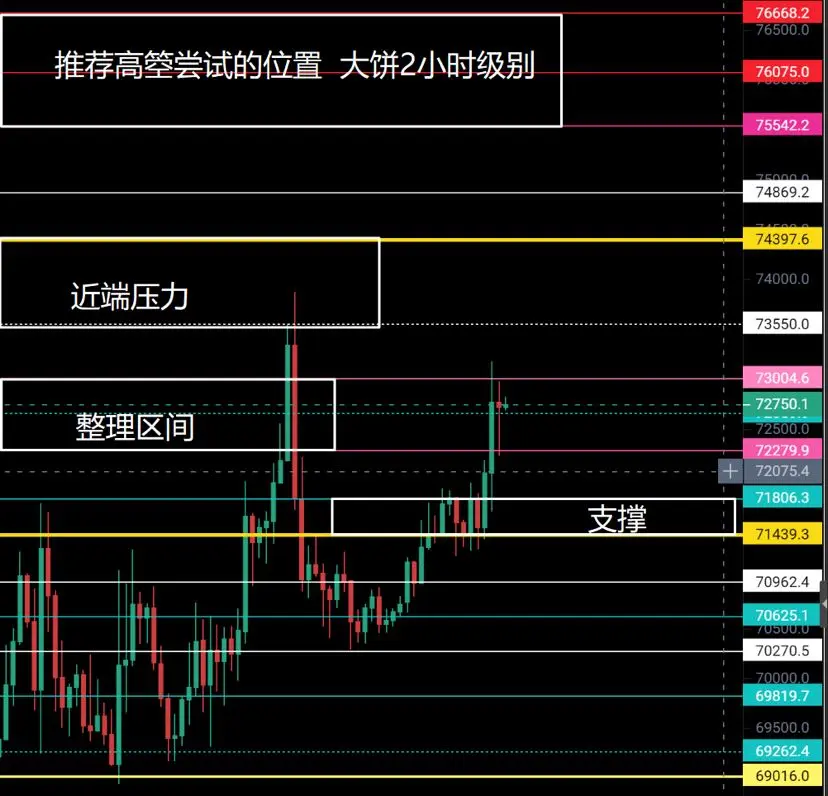
BTC:目前来到了72300-73000压力位置,这个位置小级别是可以高空尝试的,但是不要贪心,防守就用73350。大级别我是看多的,这里的空单完全是盈亏比划算,去博弈没那么快过周五高点的机会。低哆的话看看日内还给不给靠近71400的机会去补多,多單的第一幕就是周五高点73800,后续按大目标去走。
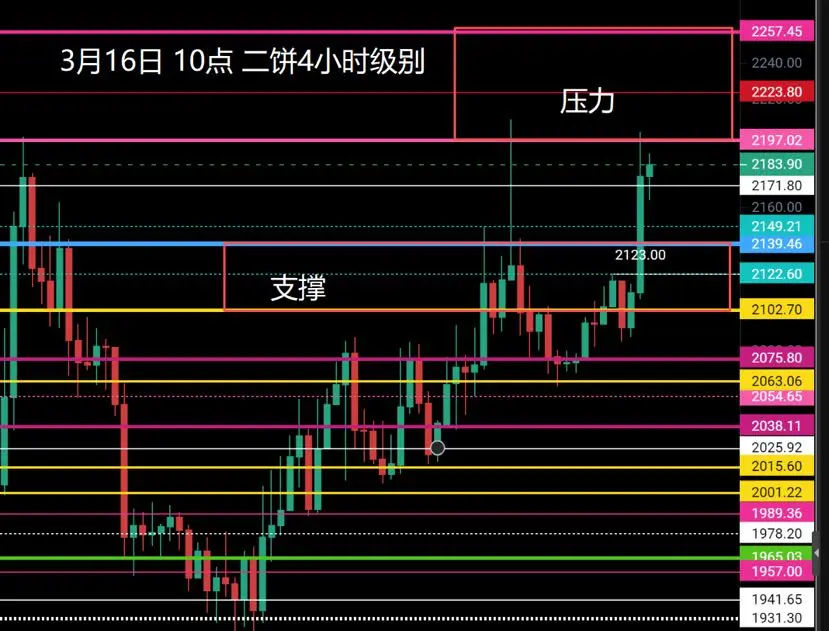
ETH:开始挑战周五的高点2208附近。上方的空间还是足够的,高箜的位置推荐第一个2257-2314.第一二是2330-2379。空的进场位置,也是多的目标位置。多單日内看看还给不给2139附近补票的机会。如果不给补票,那就找突破2200之后的回踩确认位置再进场。
周末的整理,在今日的凌晨得到方向的突破。大级别趋势没有完结,记得米神前面提到的本轮终极目标大饼:71400-74400-78500。二饼:2100-2270-2359。这几个位置希望大伙都能记下来,即使这轮没上去,后续不管哪一次冲锋,都绕不开这几个位置,这就是米神的自信。
BTC:目前来到了72300-73000压力位置,这个位置小级别是可以高空尝试的,但是不要贪心,防守就用73350。大级别我是看多的,这里的空单完全是盈亏比划算,去博弈没那么快过周五高点的机会。低哆的话看看日内还给不给靠近71400的机会去补多,多單的第一幕就是周五高点73800,后续按大目标去走。
ETH:开始挑战周五的高点2208附近。上方的空间还是足够的,高箜的位置推荐第一个2257-2314.第一二是2330-2379。空的进场位置,也是多的目标位置。多單日内看看还给不给2139附近补票的机会。如果不给补票,那就找突破2200之后的回踩确认位置再进场。
【當前用戶分享了他的交易卡片,若想瞭解更多優質交易資訊,請到 App 版查看】
- 讚賞
- 1
- 1
- 轉發
- 分享
金马2026 :
:
夠呛,有個帶單71200左右,這麼看要套了🤣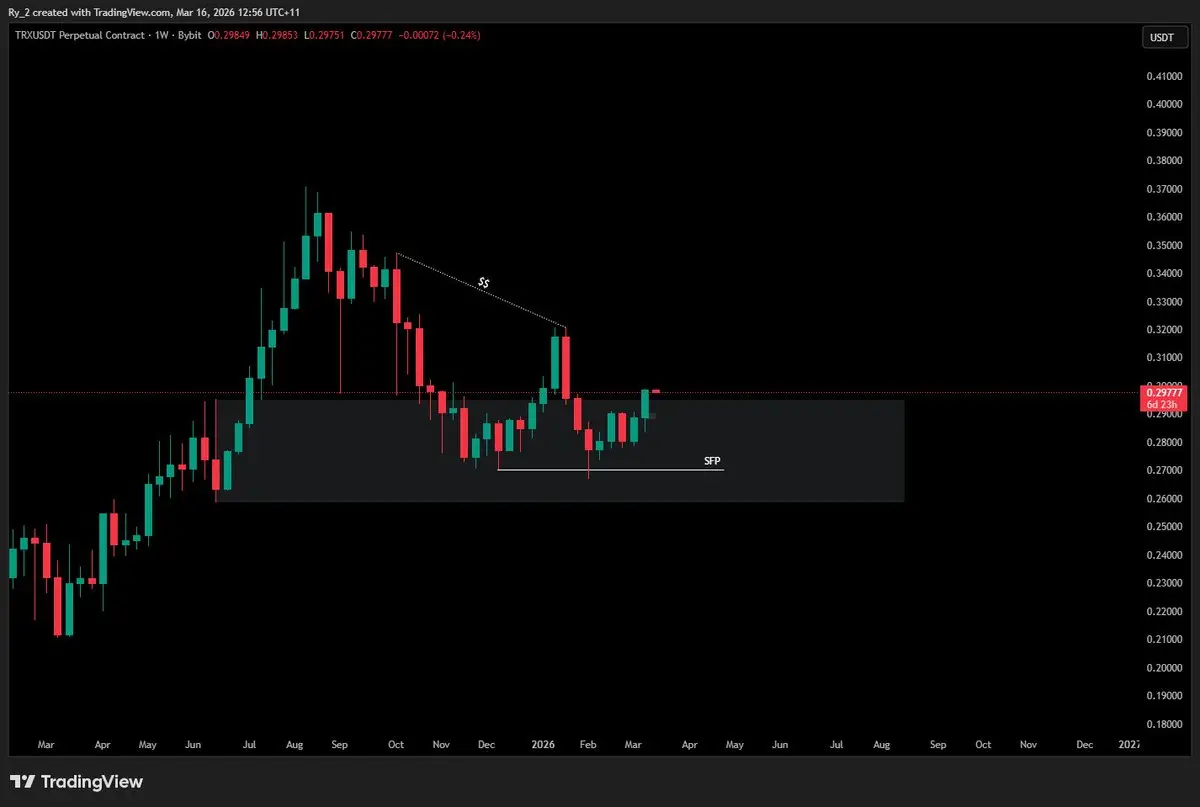
#TrendResearchSuspectedShorting27KETH #TrendResearchSuspectedShorting27KETH 主題概述 最近的趨勢研究表明在27,000 ETH水平附近可能存在空頭活動。這引起了交易者和市場觀察者的關注,因為這可能表明市場參與者正在為暫時價格回調或獲利了結做準備。 當前市場快照 ETH當前價格: $2,096 市場波動性保持適度,投資者密切關注$2,100–$2,150附近的技術水平。 空頭頭寸信號表明一些交易者預期下行壓力,但更廣泛的採用和長期看漲情緒仍然強勁。 市場情緒與心理影響 由於懷疑空頭活動,短期交易者中的恐懼或謹慎情緒可能上升。長期持有者將此視為以合理價格累積ETH的機會。社交媒體和加密論壇反映了謹慎交易和對ETH反彈樂觀的混合情緒。 技術考量 支撐位: $2,050–$2,070 阻力位: $2,120–$2,150 監控ETH趨勢的交易者應注意這些點的突破或拒跌。懷疑的27,000 ETH附近空頭頭寸表明暫時的供應壓力,但不一定意味著市場崩盤。 交易策略與建議 對持有者: 保持冷靜,避免恐慌拋售。專注於長期趨勢。 對交易者: 使用支撐/阻力位進行謹慎的入場和退出點。考慮採用小型、風險管理的頭寸。 市場觀察: 關注空頭趨勢和成交量尖峰,以預期潛在的暫時下跌。 潛在價格展望
ETH3.98%
- 讚賞
- 1
- 留言
- 轉發
- 分享
加載更多
加入 4000萬 人匯聚的頭部社群
⚡️ 與 4000萬 人一起參與加密貨幣熱潮討論
💬 與喜愛的頭部創作者互動
👍 查看感興趣的內容
熱門話題
查看更多28.04萬 熱度
12.07萬 熱度
50.88萬 熱度
4986.45萬 熱度
175.29萬 熱度
最新消息
查看更多置頂
Gate Booster 第 4 期:發帖瓜分 1,500 $USDT
🔹 發布 TradFi 黃金福袋原創內容,可得 15 $USDT,名額有限先到先得
🔹 本期支持 X、YouTube 發布原創內容
🔹 無需複雜操作,流程清晰透明
🔹 流程:申請成為 Booster → 領取任務 → 發布原創內容 → 回鏈登記 → 等待審核及發獎
📅 任務截止時間:03月20日16:00(UTC+8)
立即領取任務:https://www.gate.com/booster/10028?pid=allPort&ch=KTag1BmC
更多詳情:https://www.gate.com/announcements/article/50203🤖 尋找 Gate 廣場 AI 評測官!$50,000 懸賞令發布!
發帖聊 AI,獎金拿到手軟!新人首帖獎勵翻倍,單帖最高 200U!
📝 立即報名:https://www.gate.com/questionnaire/7477
1️⃣ 發帖得紅包,單帖最高 100U!
2️⃣ Top 體驗分享官:帶 #Gate广场AI测评官 聊技巧,贏國米球衣!
3️⃣ 收益率 PK 王:曬 AI 收益截圖,贏 Gate 定制運動套裝!
4️⃣ 深度好文額外加碼 30U 每篇張榜公布!
💬 來 Gate 廣場,把握行業新趨勢:https://www.gate.com/post
時間:3/12 18:00 – 3/27 24:00 (UTC+8)
詳情:https://www.gate.com/announcements/article/50206Gate 廣場|3/12 今日熱議: #原油价格上涨
🎁 帶話題或 BTC 幣對發帖,抽 5 位錦鯉送出 $2,500 仓位體驗券!
中東局勢突變:阿曼原油出口碼頭全面疏散,伊拉克石油港口停運,兩艘油輪在海灣遇襲,原油供應警報拉滿!國際能源署釋放4億桶儲備,多空對決進入白熱化。
💬 本期熱議
1️⃣ 外交局勢:伊朗開出停戰條件,美伊能否達成共識?
2️⃣ 石油博弈:你看好誰?預測下一步油價走勢。
3️⃣ 加密走勢:油價資金流向將如何影響加密市場?分享你的分析。
立刻分享觀點 👉 https://www.gate.com/post
Gate TradFi,一鍵捕捉原油機遇 👉 https://www.gate.com/tradfi
📅 3/12 15:00 - 3/14 18:00 (UTC+8)Gate 廣場內容挖礦獎勵繼續升級!無論您是創作者還是用戶,挖礦新人還是頭部作者都能贏取好禮獲得大獎。現在就進入廣場探索吧!
創作者享受最高60%創作返佣
創作者獎勵加碼1500USDT:更多新人作者能瓜分獎池!
觀眾點擊交易組件交易贏大禮!最高50GT等新春壕禮等你拿!
詳情:https://www.gate.com/announcements/article/49802