K线定海神针
Today's Bitcoin Analysis:
Daily chart shows an ascending flag pattern with Bollinger Band midline turning upward, indicating a mid-term bullish bias; 4-hour MACD shows bearish crossover and RSI is neutral, with bulls facing resistance after an upward surge; hourly chart oscillates with low volume in the 69500–71500 range, waiting for directional confirmation.
Bitcoin:
If northbound near 72,800-73300, targets are 73,500-74000
$BTC
BTC2.07%

- 讚賞
- 3
- 留言
- 轉發
- 分享
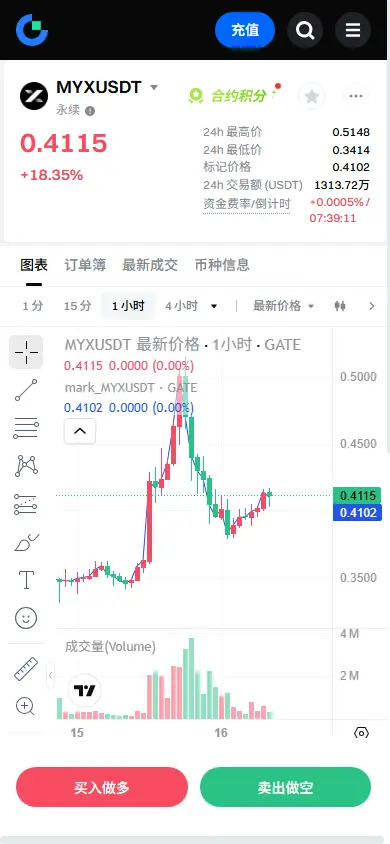
【MYXUSDT 信號】多頭:4H 放量突破後回調的確認
價格在3月15日完成了4H時間框架內的關鍵突破。第一根4H蠟燭 (04:00-08:00 從0.3628升至0.4357,成交量為6047萬,隨後第二根蠟燭 )08:00-12:00 繼續擴大成交量至1.02億,價格達到高點0.5164。這是典型的量價共鳴突破,機構資金入場跡象明顯。
突破後價格回調,但回調過程中成交量有所下降。從12:00到20:00,三根4H蠟燭的成交量分別從5200萬遞減至2586萬,再到1853萬。在1H水平上,價格在0.3883至0.4025的範圍內震蕩,買方深度明顯超過賣方。訂單簿顯示,1至10檔位的總買單達到183,000,而1至10檔位的總賣單僅為47,700,買方深度是賣方的3.84倍,形成堅實的支撐牆。
未平倉合約 (OI ) 保持穩定,回調期間未大幅下降,表明突破期間建立的多頭頭寸未出現恐慌平倉。當前價格0.408正在回調至由1H EMA20 (0.4033 和 EMA50 )0.3817 形成的動態支撐區。4H RSI為64.66,處於健康的看漲區間,無超買壓力。
🎯方向:多頭
⚡入場:0.395 - 0.405
🛑止損:0.382
🚀目標:0.480 / 0.519
🛡策略:在0.480處平倉一半頭寸,將剩餘頭寸的止損移至入場價格以瞄準第二目標。
邏輯:訂單簿深度揭示了對手單
查看原文價格在3月15日完成了4H時間框架內的關鍵突破。第一根4H蠟燭 (04:00-08:00 從0.3628升至0.4357,成交量為6047萬,隨後第二根蠟燭 )08:00-12:00 繼續擴大成交量至1.02億,價格達到高點0.5164。這是典型的量價共鳴突破,機構資金入場跡象明顯。
突破後價格回調,但回調過程中成交量有所下降。從12:00到20:00,三根4H蠟燭的成交量分別從5200萬遞減至2586萬,再到1853萬。在1H水平上,價格在0.3883至0.4025的範圍內震蕩,買方深度明顯超過賣方。訂單簿顯示,1至10檔位的總買單達到183,000,而1至10檔位的總賣單僅為47,700,買方深度是賣方的3.84倍,形成堅實的支撐牆。
未平倉合約 (OI ) 保持穩定,回調期間未大幅下降,表明突破期間建立的多頭頭寸未出現恐慌平倉。當前價格0.408正在回調至由1H EMA20 (0.4033 和 EMA50 )0.3817 形成的動態支撐區。4H RSI為64.66,處於健康的看漲區間,無超買壓力。
🎯方向:多頭
⚡入場:0.395 - 0.405
🛑止損:0.382
🚀目標:0.480 / 0.519
🛡策略:在0.480處平倉一半頭寸,將剩餘頭寸的止損移至入場價格以瞄準第二目標。
邏輯:訂單簿深度揭示了對手單
- 讚賞
- 2
- 留言
- 轉發
- 分享
LB
龙币
創建人@亿元负翁
上市進度
0.00%
市值:
$2462.06
更多代幣
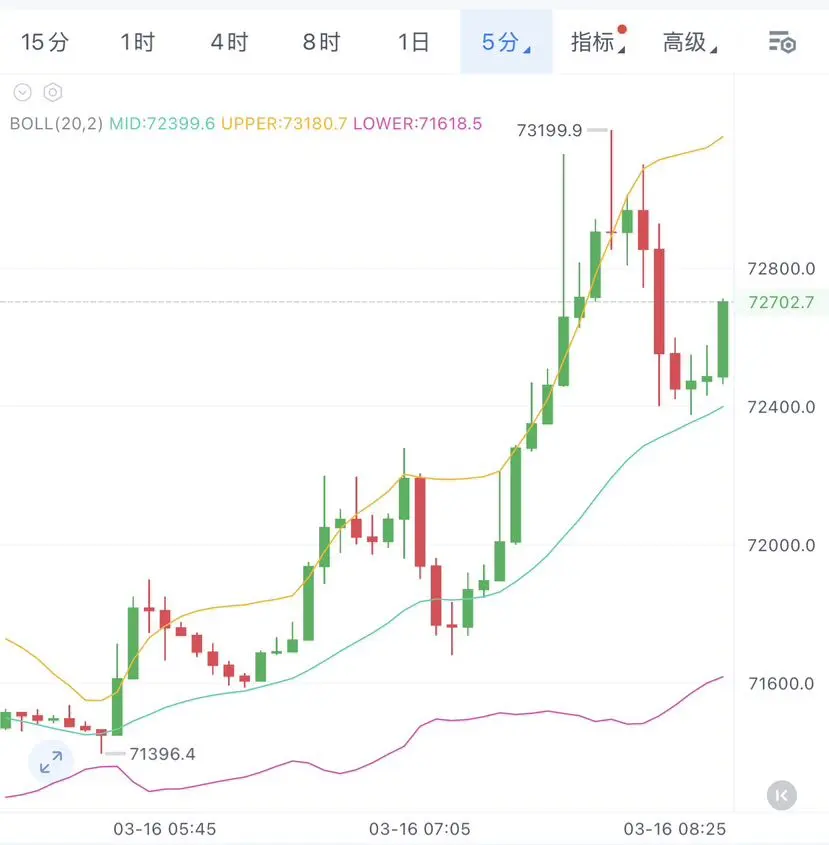
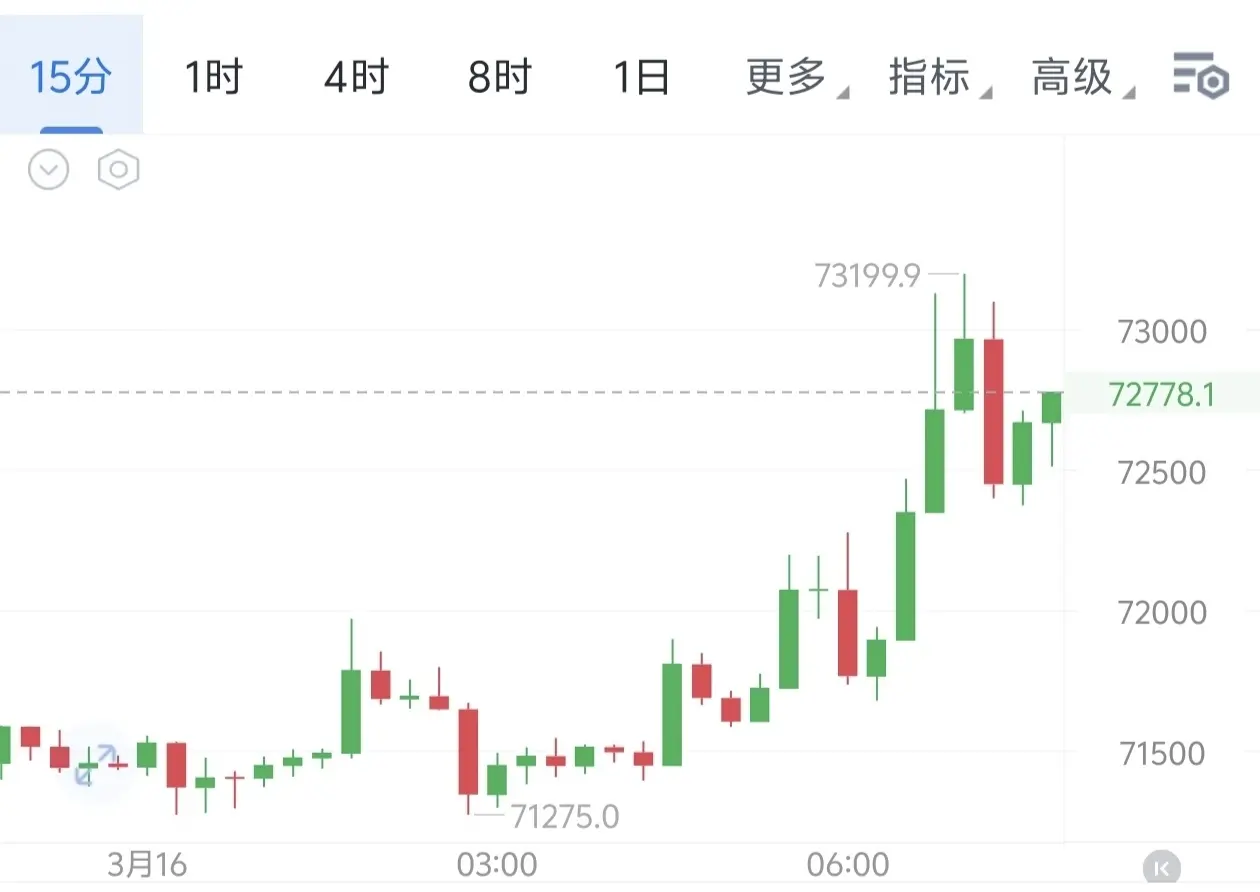
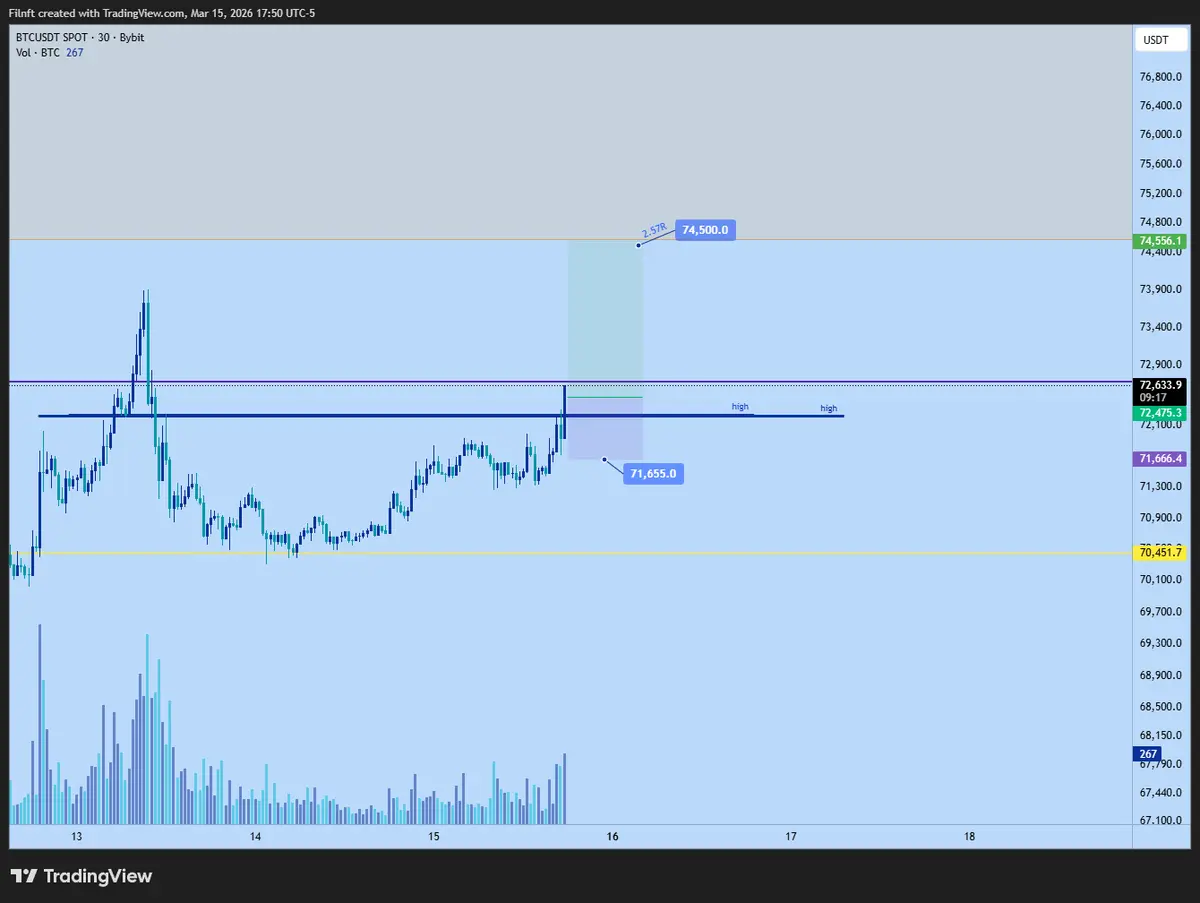
March 16th Early Morning BTC Analysis:
Price surged to the 73200 level then entered technical pullback, currently consolidating in the 72700 range, which is a normal manifestation of bulls accumulating strength.
- Key Resistance: 73200 is the recent resistance level; if accompanied by volume breakthrough, the upside can target 74000
- Core Support: 72000 is the short-term trend lifeline; effective breakdown will open downside space
- Trading Reference: If holding steady at 72800, consider light long positions with target 73200; if volume breaks below 72500, avoid pullback risk and wait for
查看原文Price surged to the 73200 level then entered technical pullback, currently consolidating in the 72700 range, which is a normal manifestation of bulls accumulating strength.
- Key Resistance: 73200 is the recent resistance level; if accompanied by volume breakthrough, the upside can target 74000
- Core Support: 72000 is the short-term trend lifeline; effective breakdown will open downside space
- Trading Reference: If holding steady at 72800, consider light long positions with target 73200; if volume breaks below 72500, avoid pullback risk and wait for
- 讚賞
- 3
- 1
- 轉發
- 分享
趋势蛟龙:
2~1~7~9~3~4~9~8~1~7=🐧 看
⬆️
面
=哏
䒟
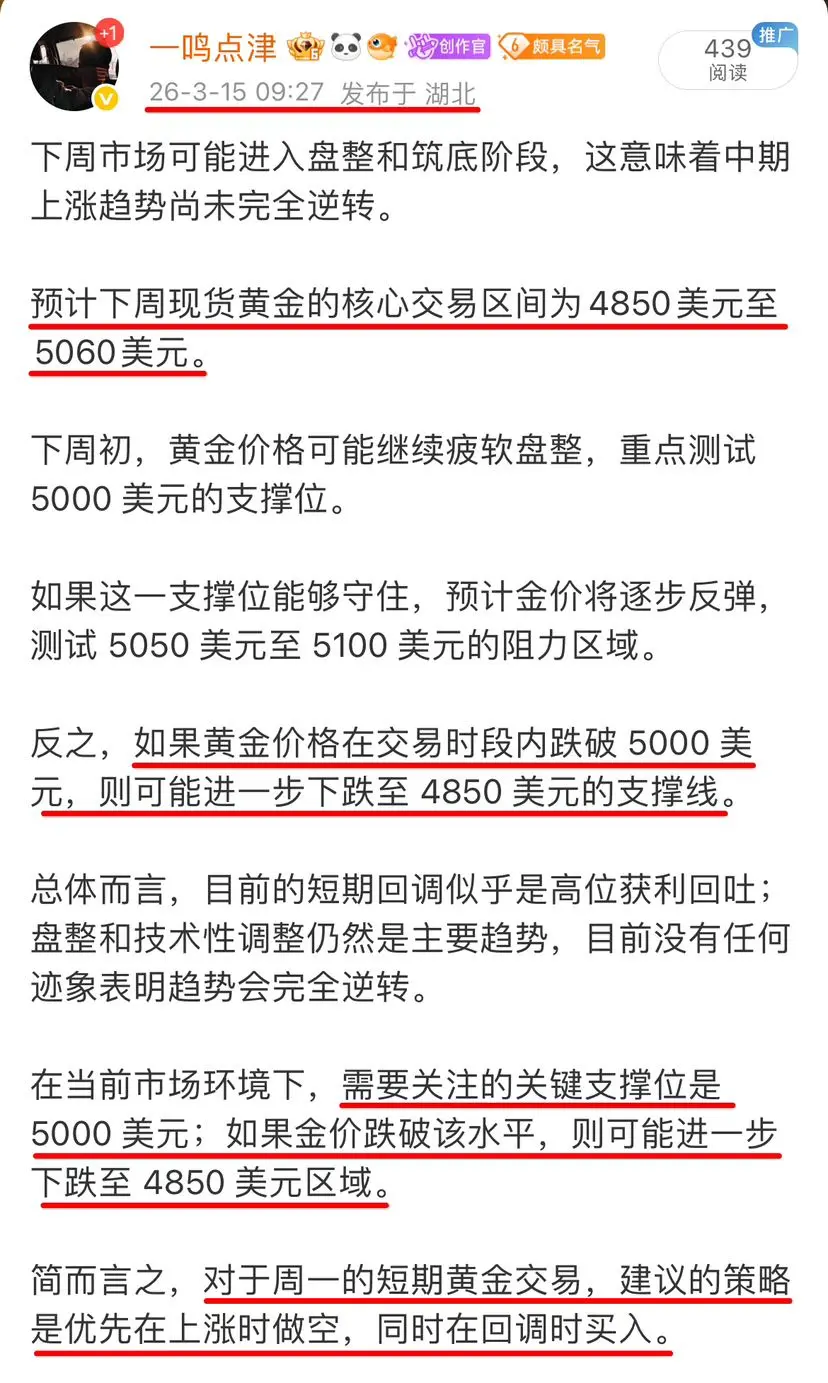
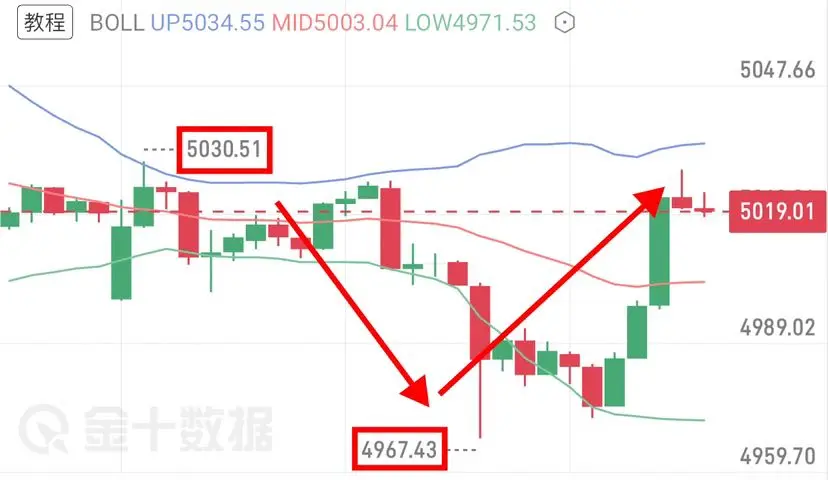
🚨 市場警報:伊朗戰爭持續搖撼全球市場。
如果衝突繼續,比特幣和山寨幣可能會因為投資者在地緣政治風險上升之際轉向加密貨幣而飆升至新的高峰。
戰爭造成不穩定,市場反應迅速。
#finance
如果衝突繼續,比特幣和山寨幣可能會因為投資者在地緣政治風險上升之際轉向加密貨幣而飆升至新的高峰。
戰爭造成不穩定,市場反應迅速。
#finance
BTC2.17%

- 讚賞
- 1
- 留言
- 轉發
- 分享
🚀 $ADA 更新
$ADA 已突破關鍵阻力位,顯示強勁的看漲勢頭。如果價格維持在此水平之上,接下來的走勢中可能會出現大漲。📈
買家開始掌控局面,所以要密切關注圖表——可能會出現強勁走勢!🔥
#ADA #GateSquareAIReviewer
$ADA 已突破關鍵阻力位,顯示強勁的看漲勢頭。如果價格維持在此水平之上,接下來的走勢中可能會出現大漲。📈
買家開始掌控局面,所以要密切關注圖表——可能會出現強勁走勢!🔥
#ADA #GateSquareAIReviewer
ADA3.04%
- 讚賞
- 3
- 留言
- 轉發
- 分享
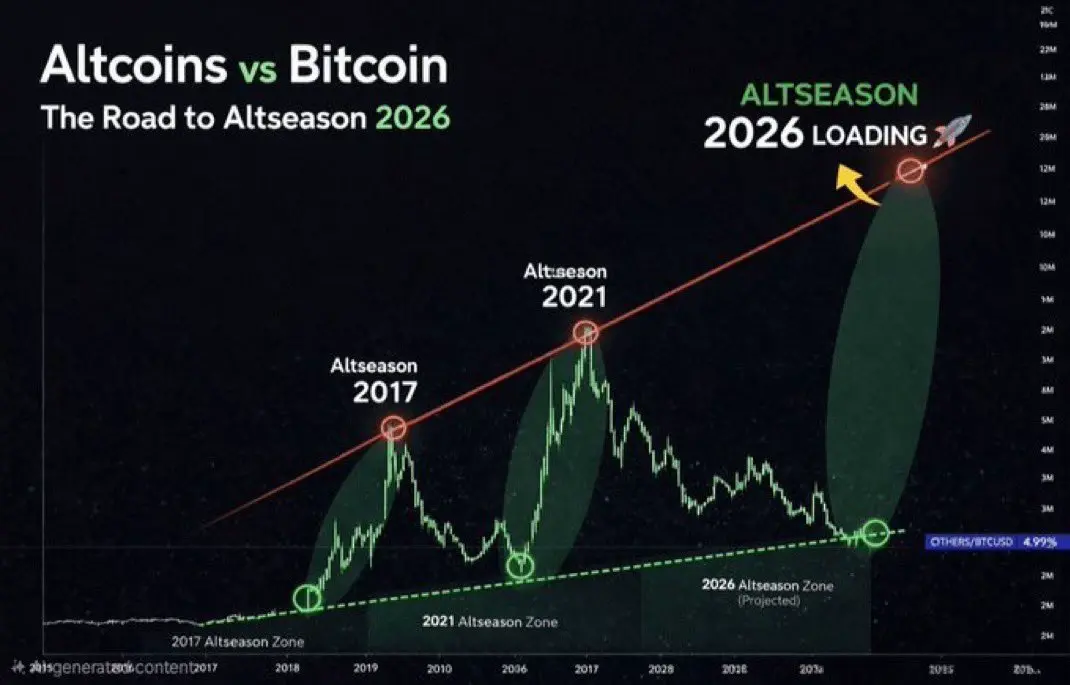
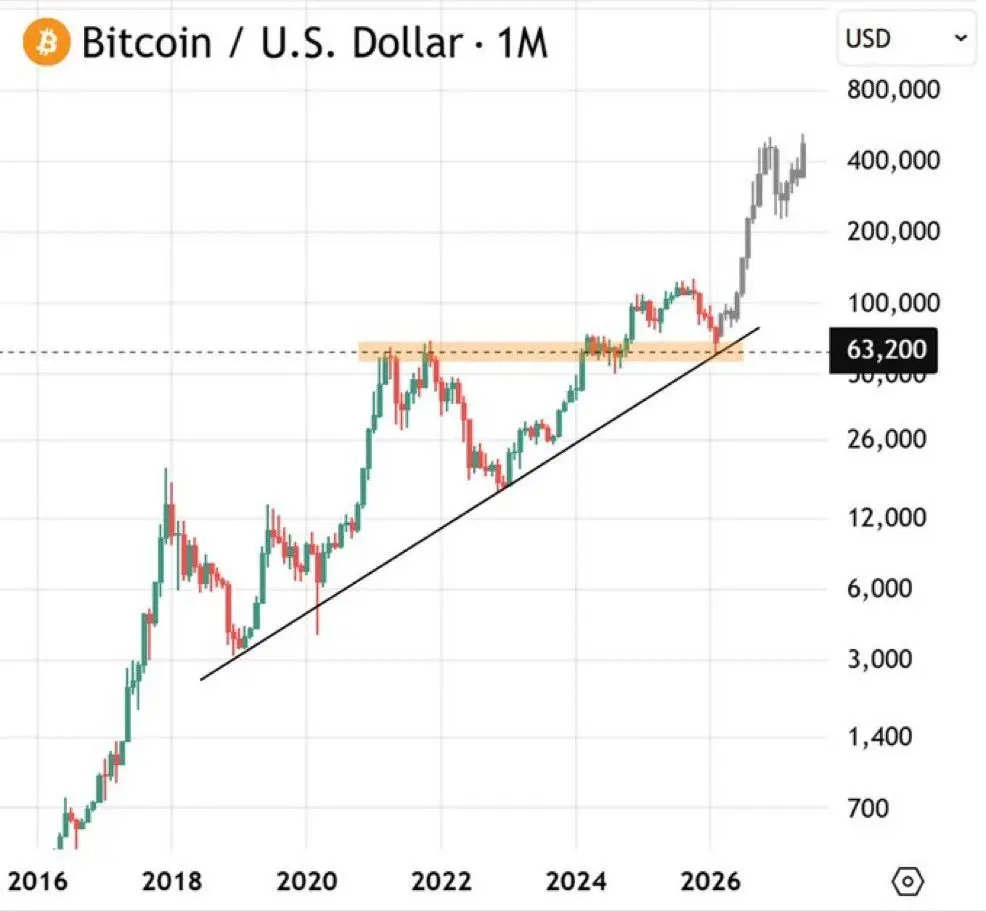
人們不懂2026年的ALTSEASON會是什麼樣子。
唐納德·特朗普。
黑石集團。
銀行、政府、機構……
都在公開建立一個基於區塊鏈的金融系統。
多年來壓力逐漸累積。
高點越來越低。
低點越來越高。
每個前一個周期在起飛前都會做同樣的事情。
2017年:約+2,500%到+3,000%
2020–2021年:約+1,300%到+1,800%
市場在沒有人再相信的時候觸底。
黃金和白銀像沒事一樣增加了數萬億。
那的一小部分,我們就看到處都是100倍的增長。
這個周期不僅會超越金屬……還會讓它們難堪。
最後的機會。裝滿你的籃子。
我通常做的事情恰恰相反於大眾的行為。
這就是我在過去10年裡每次在底部買入、每次在頂部賣出的原因。
如果你還沒有跟隨我,你會後悔的。
查看原文唐納德·特朗普。
黑石集團。
銀行、政府、機構……
都在公開建立一個基於區塊鏈的金融系統。
多年來壓力逐漸累積。
高點越來越低。
低點越來越高。
每個前一個周期在起飛前都會做同樣的事情。
2017年:約+2,500%到+3,000%
2020–2021年:約+1,300%到+1,800%
市場在沒有人再相信的時候觸底。
黃金和白銀像沒事一樣增加了數萬億。
那的一小部分,我們就看到處都是100倍的增長。
這個周期不僅會超越金屬……還會讓它們難堪。
最後的機會。裝滿你的籃子。
我通常做的事情恰恰相反於大眾的行為。
這就是我在過去10年裡每次在底部買入、每次在頂部賣出的原因。
如果你還沒有跟隨我,你會後悔的。
- 讚賞
- 2
- 留言
- 轉發
- 分享

- 讚賞
- 4
- 留言
- 轉發
- 分享

WLORV
WORLD OIL RESERVE
創建人@RIBBTFOUNDER
認購進度
0.00%
市值:
$0
更多代幣


#GateDerivativesHitsNewHighInFebruary #GateSquareAIReviewer
**認識Gate.io AI:市場的無聲顧問**
加密貨幣世界很吵鬧。市場不是說話——它在尖叫。每一秒都帶來新的聲音:鯨魚動向、流動性陷阱、新聞轟炸、社交媒體風暴。全部同時襲來。
舊的解決方案?更多螢幕、更快的手指、更少的睡眠。
Gate.io 走了另一條路。通過 GateAI 和 Gate for AI,交易所不再只是一個平台。它是與你一起呼吸的東西,在同一時刻消化相同的數據,但將其以遠為冷靜和清晰的方式返回給你。
你某天早晨醒來,手握咖啡。BTC 在4小時圖表上表現奇怪。過去你會打開15個標籤。現在你輸入一句話:
"BTC 現在發生了什麼?鯨魚方面、流動性、情緒,如果下跌繼續,給我一個安全的空頭想法。"
答案到達了。乾淨、直接、有來源。
- 鯨魚錢包在過去24小時內顯示淨流入+12.4k BTC
- 現貨流動性牆在58,200厚度增加
- 恐懼&貪婪跌至38,社交交易量趨勢下降
- 建議:在58,800下方開空頭,止損設在57,200,目標56,000——網格機器人已預設參數
你閱讀。如果你喜歡,批准。如果不是,說「改變這個,把止損移到59,100」。機器聽著,重新計算。
這不再是工具了。它是一個夥伴。
我最喜歡的是:GateAI 穿透噪音,只向你展示真正
BTC2.17%

- 讚賞
- 按讚
- 留言
- 轉發
- 分享
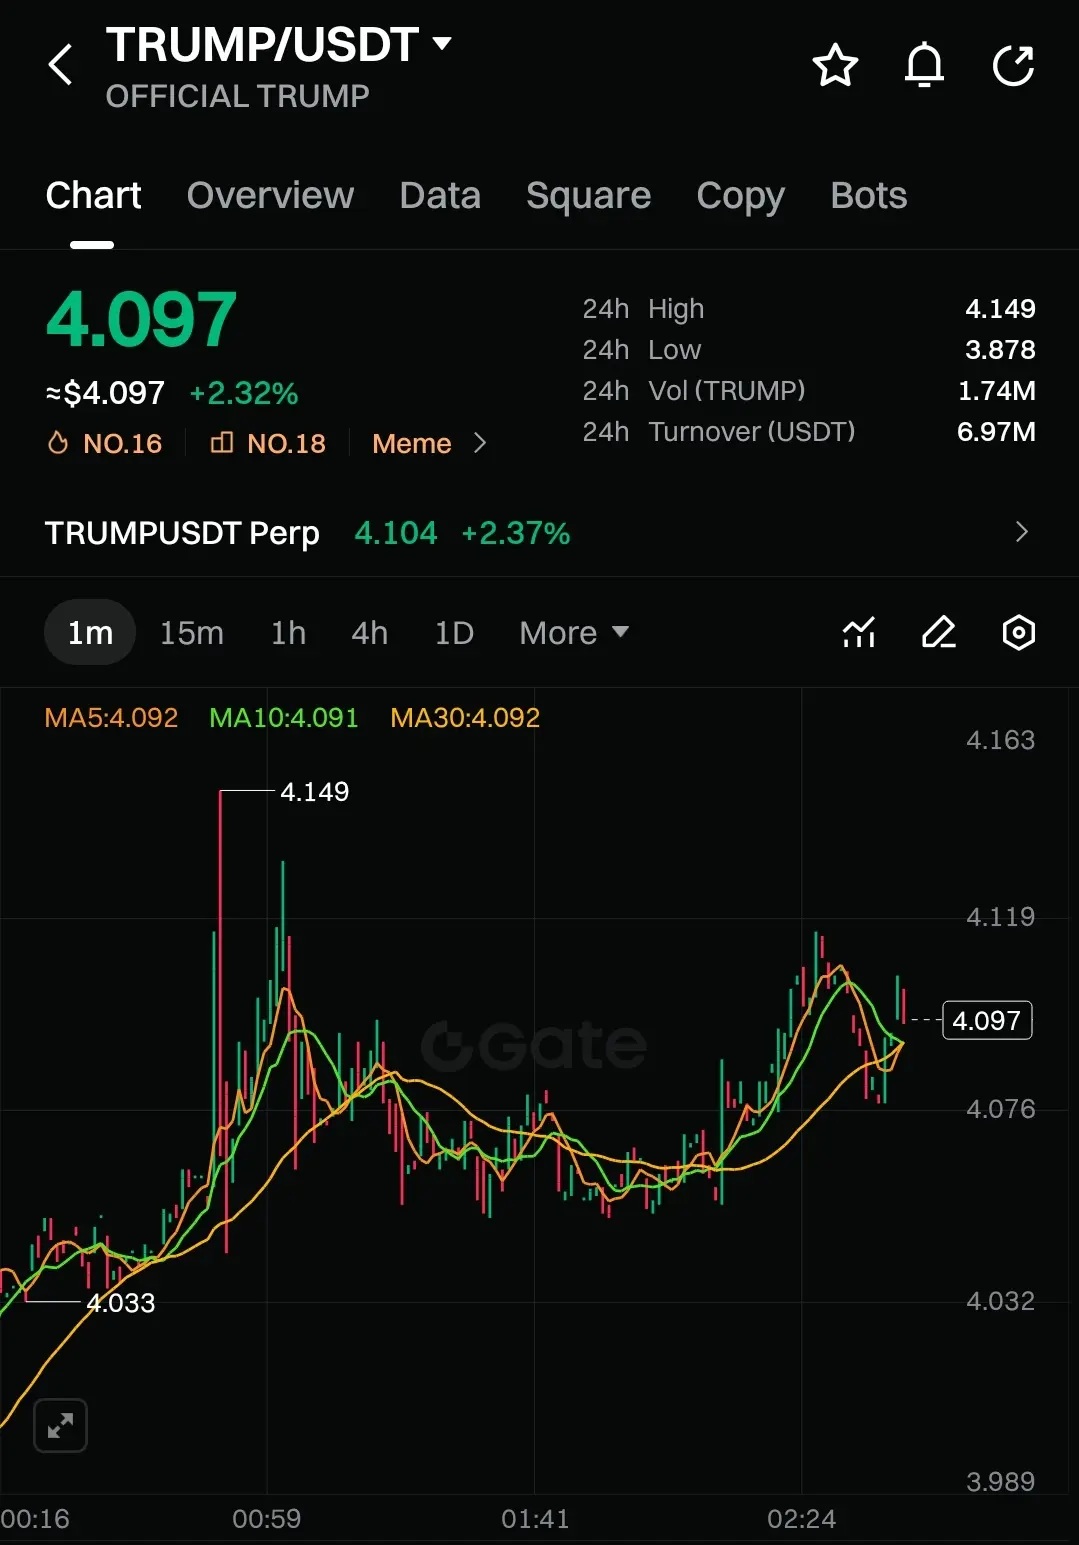
$TRUMP 在 $4.097 附近壓制......現在是一個相當有趣的區域。
只要它守住 $4.05–$4.07 支撐區域,就有空間上推到 $4.12 – $4.15 區域。
但如果跌破 $4.05,動能會迅速減弱,我們可能會回撤到 $4.00 – $4.03 範圍。
#TRUMP #Rmj-Trades
只要它守住 $4.05–$4.07 支撐區域,就有空間上推到 $4.12 – $4.15 區域。
但如果跌破 $4.05,動能會迅速減弱,我們可能會回撤到 $4.00 – $4.03 範圍。
#TRUMP #Rmj-Trades
TRUMP-2.36%
- 讚賞
- 1
- 留言
- 轉發
- 分享
加載更多
加入 4000萬 人匯聚的頭部社群
⚡️ 與 4000萬 人一起參與加密貨幣熱潮討論
💬 與喜愛的頭部創作者互動
👍 查看感興趣的內容
熱門話題
查看更多27.94萬 熱度
11.85萬 熱度
46.77萬 熱度
4986.28萬 熱度
175.24萬 熱度
最新消息
查看更多置頂
Gate Booster 第 4 期:發帖瓜分 1,500 $USDT
🔹 發布 TradFi 黃金福袋原創內容,可得 15 $USDT,名額有限先到先得
🔹 本期支持 X、YouTube 發布原創內容
🔹 無需複雜操作,流程清晰透明
🔹 流程:申請成為 Booster → 領取任務 → 發布原創內容 → 回鏈登記 → 等待審核及發獎
📅 任務截止時間:03月20日16:00(UTC+8)
立即領取任務:https://www.gate.com/booster/10028?pid=allPort&ch=KTag1BmC
更多詳情:https://www.gate.com/announcements/article/50203🤖 尋找 Gate 廣場 AI 評測官!$50,000 懸賞令發布!
發帖聊 AI,獎金拿到手軟!新人首帖獎勵翻倍,單帖最高 200U!
📝 立即報名:https://www.gate.com/questionnaire/7477
1️⃣ 發帖得紅包,單帖最高 100U!
2️⃣ Top 體驗分享官:帶 #Gate广场AI测评官 聊技巧,贏國米球衣!
3️⃣ 收益率 PK 王:曬 AI 收益截圖,贏 Gate 定制運動套裝!
4️⃣ 深度好文額外加碼 30U 每篇張榜公布!
💬 來 Gate 廣場,把握行業新趨勢:https://www.gate.com/post
時間:3/12 18:00 – 3/27 24:00 (UTC+8)
詳情:https://www.gate.com/announcements/article/50206Gate 廣場|3/12 今日熱議: #原油价格上涨
🎁 帶話題或 BTC 幣對發帖,抽 5 位錦鯉送出 $2,500 仓位體驗券!
中東局勢突變:阿曼原油出口碼頭全面疏散,伊拉克石油港口停運,兩艘油輪在海灣遇襲,原油供應警報拉滿!國際能源署釋放4億桶儲備,多空對決進入白熱化。
💬 本期熱議
1️⃣ 外交局勢:伊朗開出停戰條件,美伊能否達成共識?
2️⃣ 石油博弈:你看好誰?預測下一步油價走勢。
3️⃣ 加密走勢:油價資金流向將如何影響加密市場?分享你的分析。
立刻分享觀點 👉 https://www.gate.com/post
Gate TradFi,一鍵捕捉原油機遇 👉 https://www.gate.com/tradfi
📅 3/12 15:00 - 3/14 18:00 (UTC+8)Gate 廣場內容挖礦獎勵繼續升級!無論您是創作者還是用戶,挖礦新人還是頭部作者都能贏取好禮獲得大獎。現在就進入廣場探索吧!
創作者享受最高60%創作返佣
創作者獎勵加碼1500USDT:更多新人作者能瓜分獎池!
觀眾點擊交易組件交易贏大禮!最高50GT等新春壕禮等你拿!
詳情:https://www.gate.com/announcements/article/49802