Crypto Beat
剛剛:🇷🇺🇺🇸 俄羅斯要求對美國導彈襲擊事件負責,該襲擊於2026年2月28日擊中伊朗南部米納布一所女生小學。
查看原文

- 讚賞
- 1
- 留言
- 轉發
- 分享
- 讚賞
- 按讚
- 留言
- 轉發
- 分享
特斯马
TSM
創建人@北暖
上市進度
100.00%
市值:
$5595.82
更多代幣
Hyperliquid 早間表現堅挺
查看原文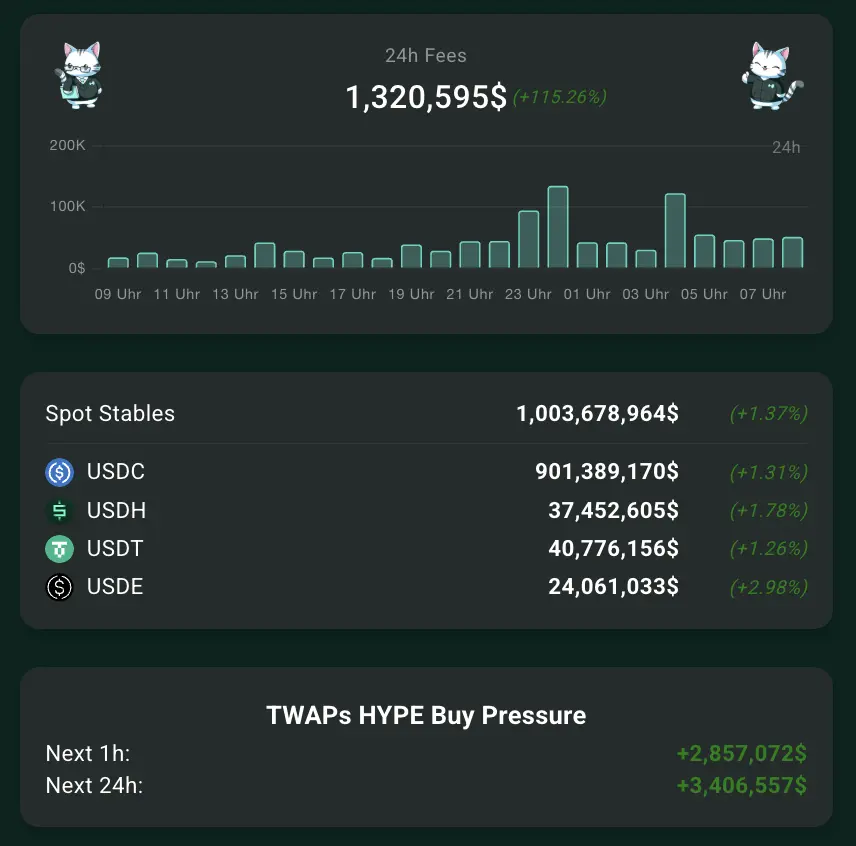
- 讚賞
- 按讚
- 留言
- 轉發
- 分享
澳大利亞參議院支持重大加密貨幣監管改革 - - #australiansenate #cryptoregulation
查看原文
- 讚賞
- 1
- 留言
- 轉發
- 分享
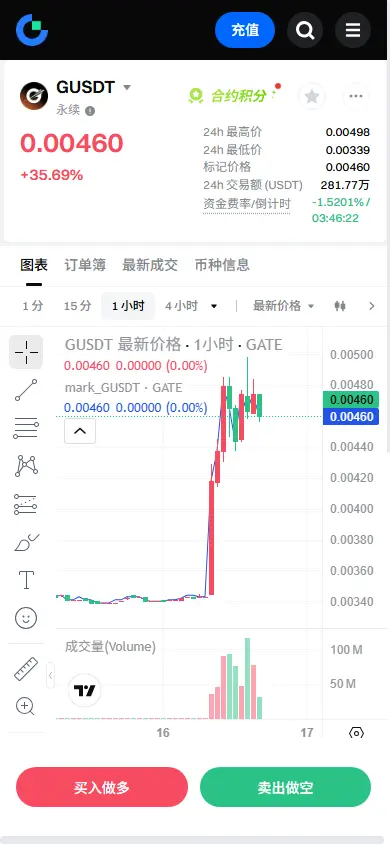
【$GUSDT 信號】軋空反彈/巨量突破
$GUSDT 單日暴漲34%,一根4H巨量陽線(成交量放大近600倍)直接吞沒過去一個月跌幅,這是典型的軋空啟動。現象是價格從底部V型反轉,資金驗證是巨量伴隨未平倉合約穩定(152M),表明新多資金強勢入場而非單純空頭平倉。結論:這是主力資金發起的底部反轉第一波,意在清洗長期空頭。
🎯方向:回調做多
⚡入場:0.00435 - 0.00445
🛑止損:0.00410
🚀目標:0.00520 / 0.00576
🛡️策略:觸及目標1減半倉,剩餘推保本損,博取趨勢延續。
查看實時行情 👇 $GUSDT
---
關注我:獲取更多加密市場實時分析與洞察! $BTC $ETH $SOL
#Gate广场AI测评官 #加密市场上涨 #比特币站上七万美元
查看原文$GUSDT 單日暴漲34%,一根4H巨量陽線(成交量放大近600倍)直接吞沒過去一個月跌幅,這是典型的軋空啟動。現象是價格從底部V型反轉,資金驗證是巨量伴隨未平倉合約穩定(152M),表明新多資金強勢入場而非單純空頭平倉。結論:這是主力資金發起的底部反轉第一波,意在清洗長期空頭。
🎯方向:回調做多
⚡入場:0.00435 - 0.00445
🛑止損:0.00410
🚀目標:0.00520 / 0.00576
🛡️策略:觸及目標1減半倉,剩餘推保本損,博取趨勢延續。
查看實時行情 👇 $GUSDT
---
關注我:獲取更多加密市場實時分析與洞察! $BTC $ETH $SOL
#Gate广场AI测评官 #加密市场上涨 #比特币站上七万美元
- 讚賞
- 按讚
- 留言
- 轉發
- 分享
Spring Rewards Airdrop Ongoing!
💫 Open a position to participate, share 45,000 USDT position pool, up to 600 USDT per person
📍 Join now: https://www.gate.com/campaigns/4255
📈 Trade more, earn more rewards, up to 550 USDT airdrop
🎁 New/returning users get 50 USDT airdrop on first trade
📄 Announcement details: https://www.gate.com/announcements/article/50197
查看原文💫 Open a position to participate, share 45,000 USDT position pool, up to 600 USDT per person
📍 Join now: https://www.gate.com/campaigns/4255
📈 Trade more, earn more rewards, up to 550 USDT airdrop
🎁 New/returning users get 50 USDT airdrop on first trade
📄 Announcement details: https://www.gate.com/announcements/article/50197
- 讚賞
- 6
- 4
- 轉發
- 分享
Ryakpanda :
:
2026衝衝衝 👊查看更多
🤖 Gate 廣場發帖聊 AI 活動火熱進行中!
$50,000 獎池等你拿!新人首帖獎勵翻倍,單帖最高 200U!
📝 立即報名:https://www.gate.com/questionnaire/7477
1️⃣ 發帖得紅包,單帖最高 100U!
2️⃣ Top 體驗分享官:帶 #Gate广场AI测评官 聊技巧,贏國米球衣!
3️⃣ 收益率 PK 王:曬 AI 收益截圖,贏 Gate 定製運動套裝!
4️⃣ 深度好文額外加碼 30U 每篇張榜公布!
💬 來 Gate 廣場,把握行業新趨勢:https://www.gate.com/post
時間:3/12 18:00 – 3/27 24:00 (UTC+8)
詳情:https://www.gate.com/announcements/article/50206
查看原文$50,000 獎池等你拿!新人首帖獎勵翻倍,單帖最高 200U!
📝 立即報名:https://www.gate.com/questionnaire/7477
1️⃣ 發帖得紅包,單帖最高 100U!
2️⃣ Top 體驗分享官:帶 #Gate广场AI测评官 聊技巧,贏國米球衣!
3️⃣ 收益率 PK 王:曬 AI 收益截圖,贏 Gate 定製運動套裝!
4️⃣ 深度好文額外加碼 30U 每篇張榜公布!
💬 來 Gate 廣場,把握行業新趨勢:https://www.gate.com/post
時間:3/12 18:00 – 3/27 24:00 (UTC+8)
詳情:https://www.gate.com/announcements/article/50206

- 讚賞
- 5
- 3
- 轉發
- 分享
HighAmbition:
直達月球 🌕查看更多
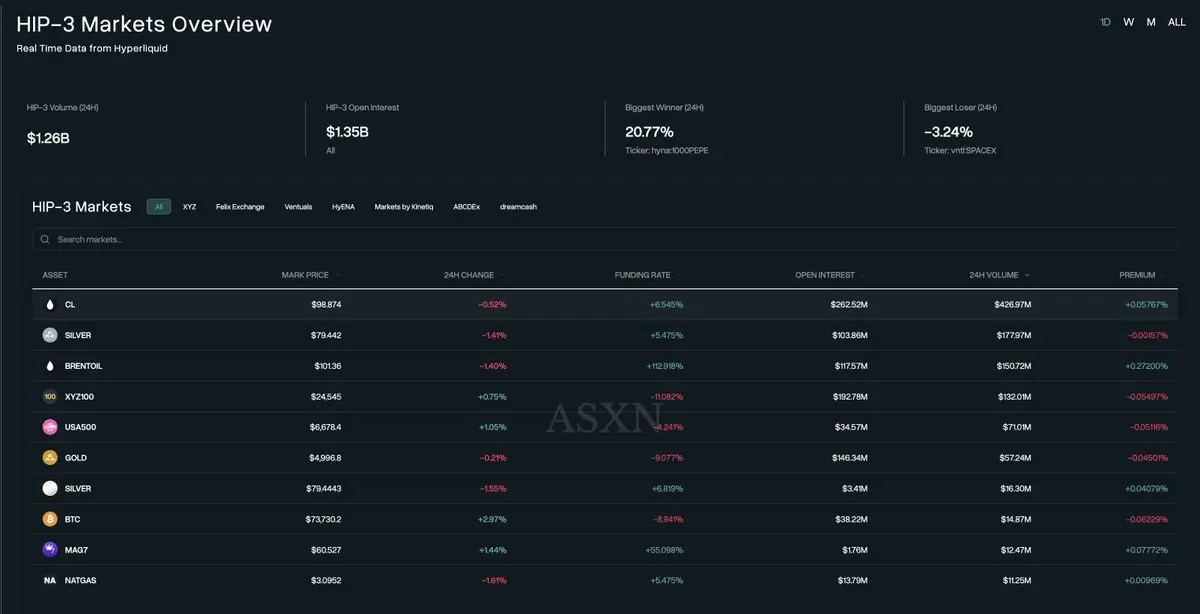
1.26B 交易量
1.35B 未平倉量
HIP-3
就是 Hyperliquid 在做 Hyperliquid 的事情。
查看原文1.35B 未平倉量
HIP-3
就是 Hyperliquid 在做 Hyperliquid 的事情。
- 讚賞
- 按讚
- 留言
- 轉發
- 分享
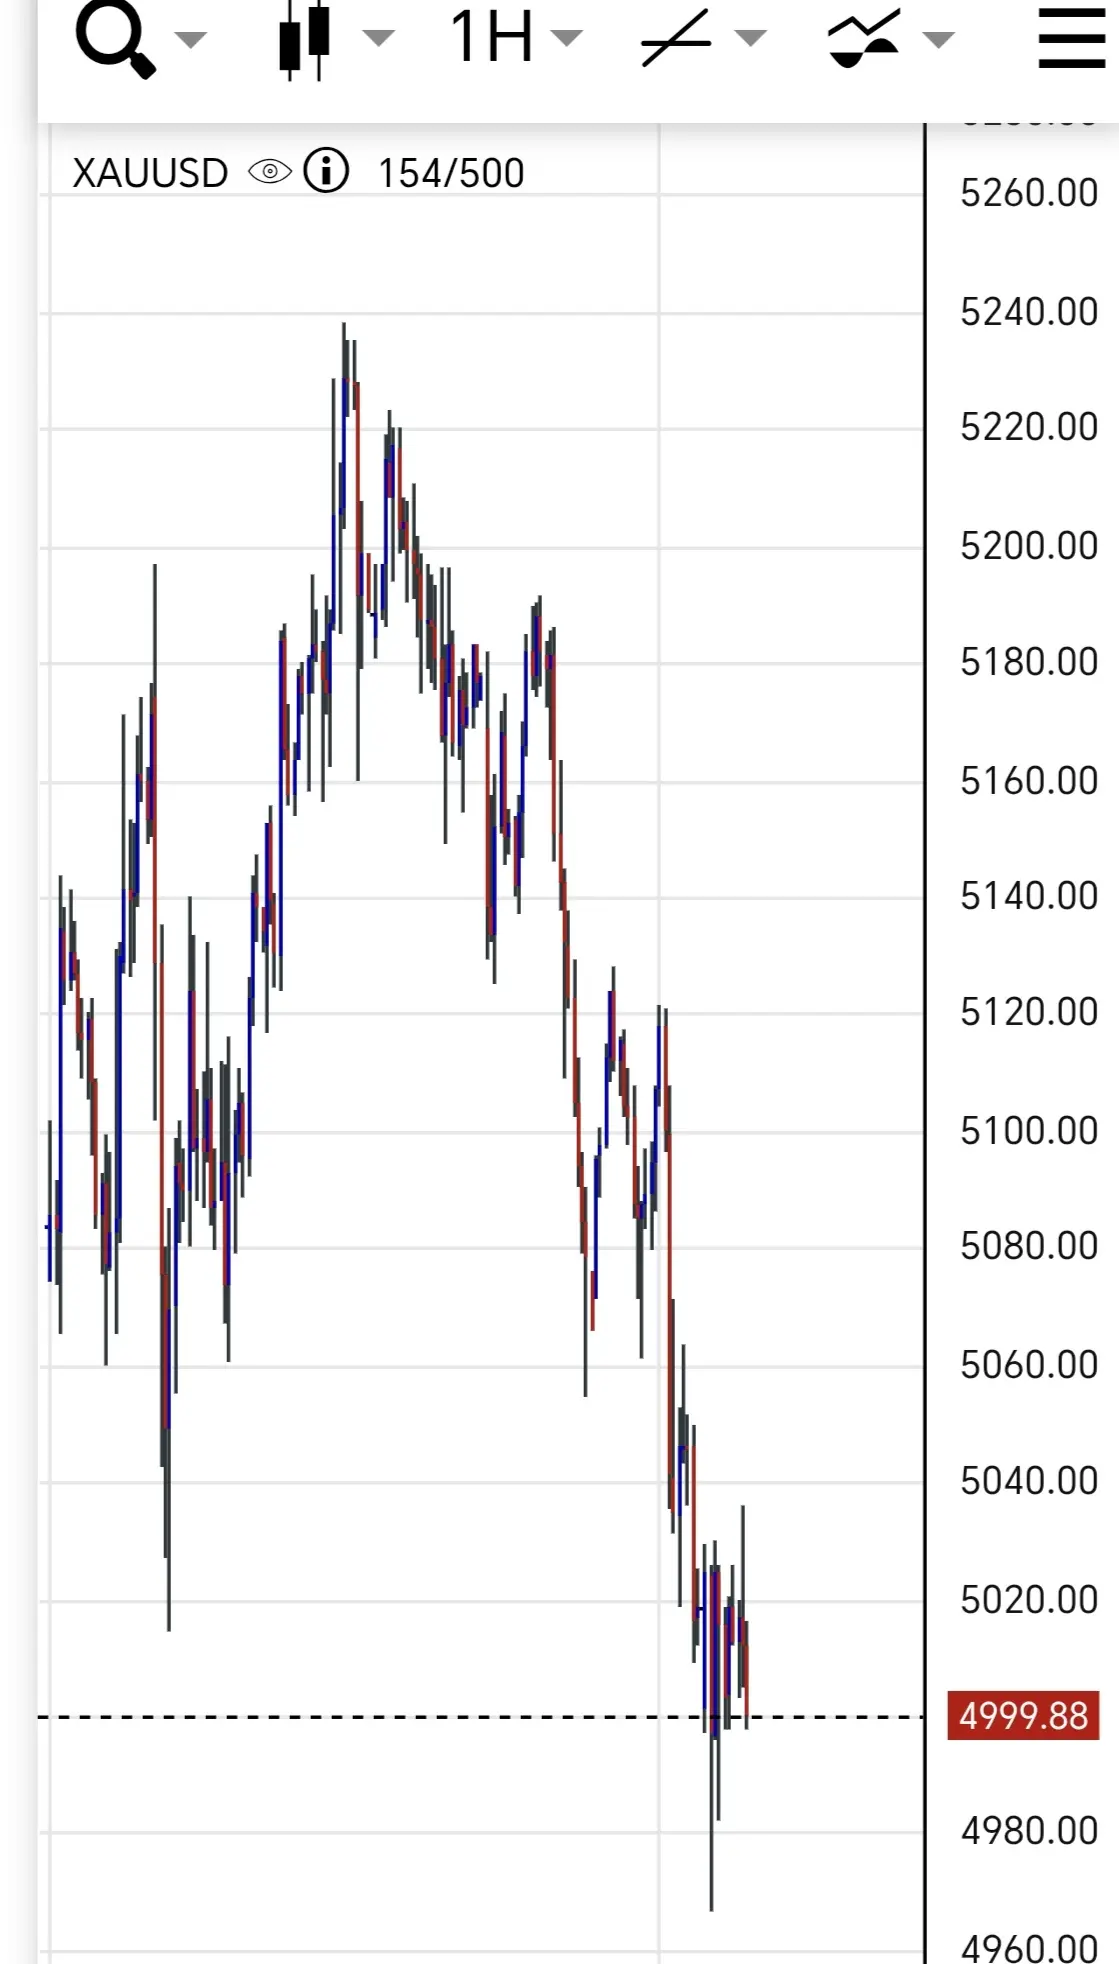
Week (3.16–3.22) BTC Market Analysis
As of March 16, BTC is trading around $71,500. Early in the week, driven by geopolitical safe-haven flows and ETF inflows, it surged to $73,000, maintaining a wide-range upward oscillation pattern throughout the week.
Technical Analysis: The daily chart maintains an uptrend channel, but MACD shows a bearish divergence at high levels, and RSI at 68 is approaching overbought conditions, indicating weakening bullish momentum and rising pullback pressure. Key levels: Support at $70,000–$68,500, Resistance at $73,000–$74,000. The 4-hour Bollinger Bands are c
BTC3.08%


- 讚賞
- 2
- 3
- 轉發
- 分享
木生林森:
快上車!🚗查看更多
LUXY
luxury
創建人@xyuge
認購進度
0.00%
市值:
$0
更多代幣
一步錯,步步錯,行情上下插針,想必有的小夥伴踏錯了方向,無奈被套硬抗怕爆,割肉不捨,白白錯過大好的行情。黎曜現在在線解套,無論是山頂的箜,還是谷底的箜,都有方法解套。無償免費服務,名額有限,僅三個名額,速度搶!(ง •̀_•́)ง#Gate广场AI测评官 #Gate广场AI测评官 $BTC $ETH
查看原文
- 讚賞
- 按讚
- 留言
- 轉發
- 分享
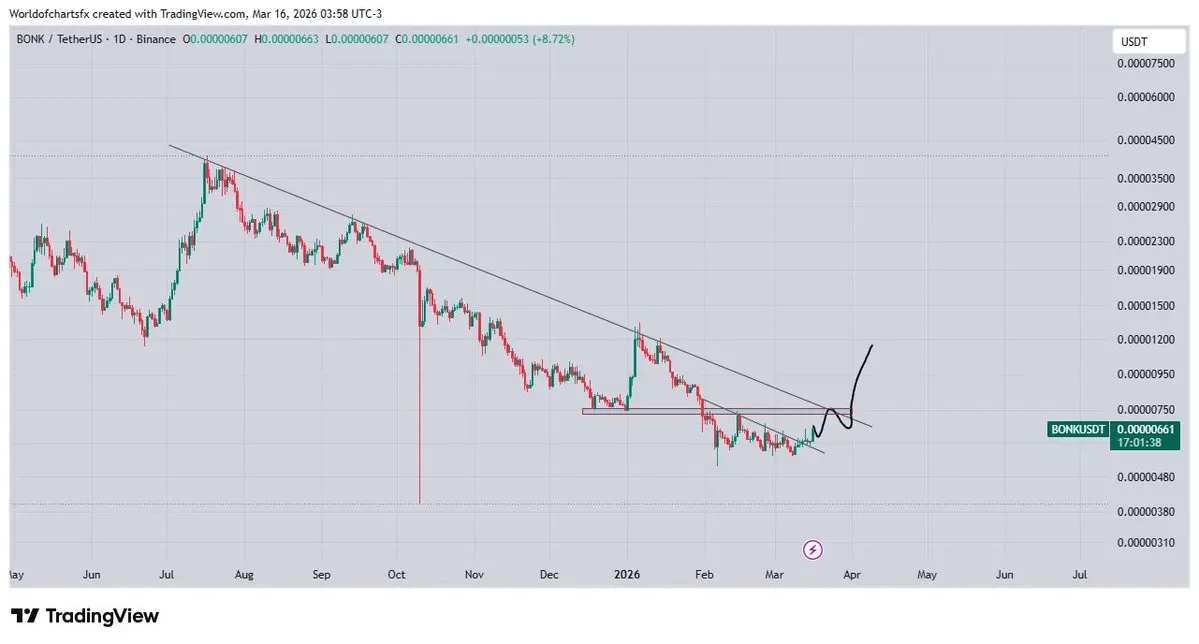
$Bonk # Bonk 正在試圖復甦並緩慢向上移動。從這裡開始,價格可能會再次接近下降趨勢線,該趨勢線已經被多次測試,看起來較弱。如果這條趨勢線被突破,強勁的上升可能會發生,Bonk 在未來幾天內可能給出 2× 的漲幅。
BONK13.96%
- 讚賞
- 按讚
- 留言
- 轉發
- 分享
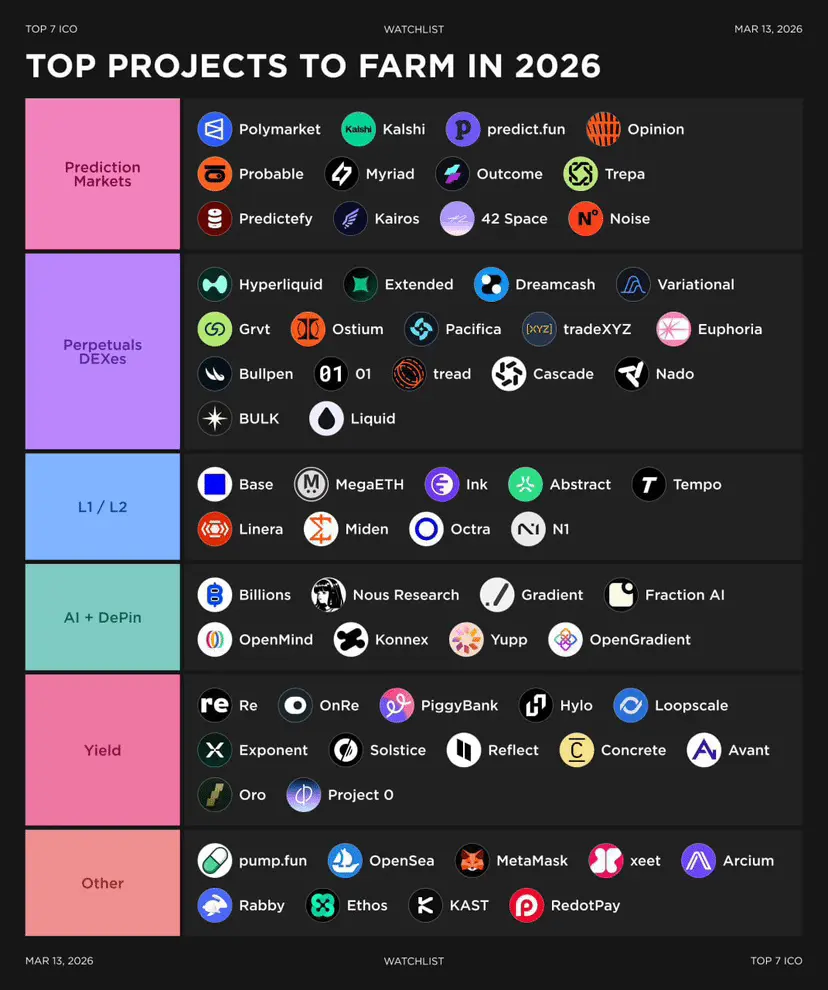
👀 Top Agricultural Projects for 2026
In 2026, the main opportunities concentrated in declining agricultural potential focus on prediction markets, permanent decentralized exchanges, artificial intelligence projects, and new L2 networks.
Some projects have already distributed their first airdrops, while others have not, so there is plenty of work here for retro hunters to do 👨💻
查看原文In 2026, the main opportunities concentrated in declining agricultural potential focus on prediction markets, permanent decentralized exchanges, artificial intelligence projects, and new L2 networks.
Some projects have already distributed their first airdrops, while others have not, so there is plenty of work here for retro hunters to do 👨💻
- 讚賞
- 1
- 留言
- 轉發
- 分享
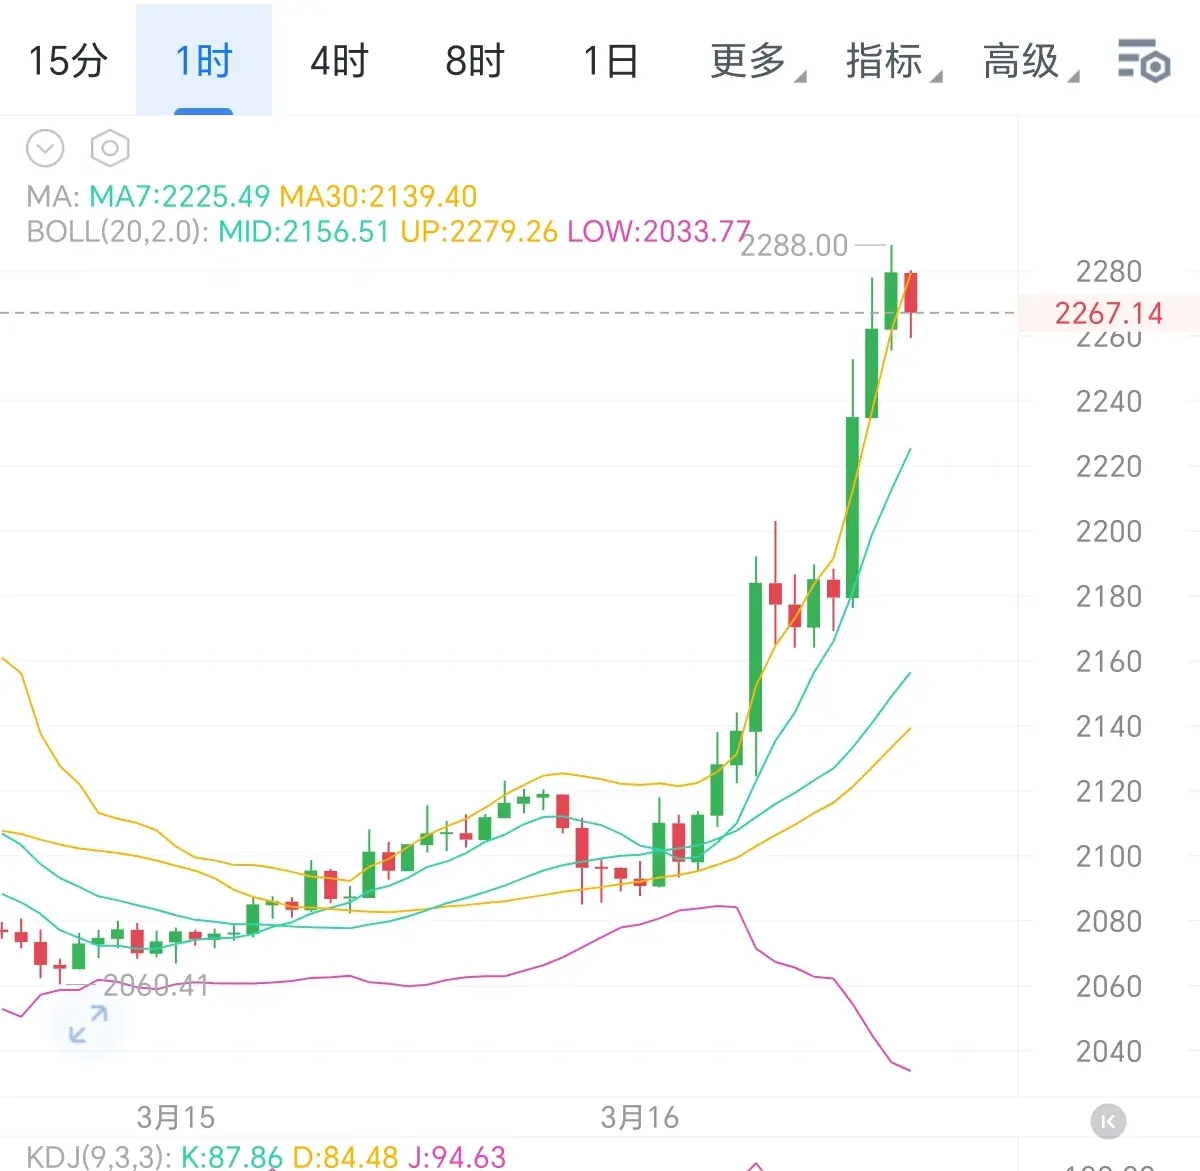
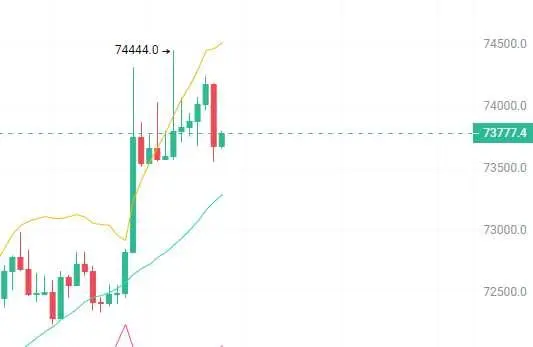
早间比特币强势拉升至74444附近后进入高位震荡整理,市场多头情绪依旧占优,但高位分歧加大,短期波动显著加剧。
四小时,价格依托布林带上轨运行,短期均线同步向上发散,形成标准多头排列,中期上行趋势明朗。本轮回调未有效跌破布林带中轨支撑,多头承接力度强劲,暂无趋势反转信号。
近期K线连续收阳,但频繁出现长上影线,高位抛压增加、多空分歧扩大,多头拉升动能有所放缓,短期存在获利回吐与震荡整固需求。盘面暂未出现看跌吞没、顶背离等明确见顶形态,叠加布林带开口向上扩张,中期多头格局不变,回踩企稳后仍具备冲高潜力。
BTC :回调73400—72600多,目标75000—77000
ETH :回调2240—2200多,目标2330—2400$BTC $ETH
四小时,价格依托布林带上轨运行,短期均线同步向上发散,形成标准多头排列,中期上行趋势明朗。本轮回调未有效跌破布林带中轨支撑,多头承接力度强劲,暂无趋势反转信号。
近期K线连续收阳,但频繁出现长上影线,高位抛压增加、多空分歧扩大,多头拉升动能有所放缓,短期存在获利回吐与震荡整固需求。盘面暂未出现看跌吞没、顶背离等明确见顶形态,叠加布林带开口向上扩张,中期多头格局不变,回踩企稳后仍具备冲高潜力。
BTC :回调73400—72600多,目标75000—77000
ETH :回调2240—2200多,目标2330—2400$BTC $ETH
- 讚賞
- 1
- 留言
- 轉發
- 分享
🚀 串流簽到已上線 – 三月第2場!
別錯過在 Gate.io 上最新活動賺取驚人獎勵的機會。
💰 獎勵包括:
• 月度獎金
• 流量提升
• VIP 升級
• 最高 $100 獎勵
📅 活動期間:
2026年3月16日 – 2026年3月31日
保持活躍,在串流會議期間簽到,並解鎖獨家福利。參與越多,獎勵越豐厚!🎯
🔥 現在開始並提升你的 VIP 等級。
#Gateio #CryptoRewards #VIPUpgrade #CryptoCommunity #StreamingCheckIn #CryptoBonus
查看原文別錯過在 Gate.io 上最新活動賺取驚人獎勵的機會。
💰 獎勵包括:
• 月度獎金
• 流量提升
• VIP 升級
• 最高 $100 獎勵
📅 活動期間:
2026年3月16日 – 2026年3月31日
保持活躍,在串流會議期間簽到,並解鎖獨家福利。參與越多,獎勵越豐厚!🎯
🔥 現在開始並提升你的 VIP 等級。
#Gateio #CryptoRewards #VIPUpgrade #CryptoCommunity #StreamingCheckIn #CryptoBonus

- 讚賞
- 3
- 留言
- 轉發
- 分享
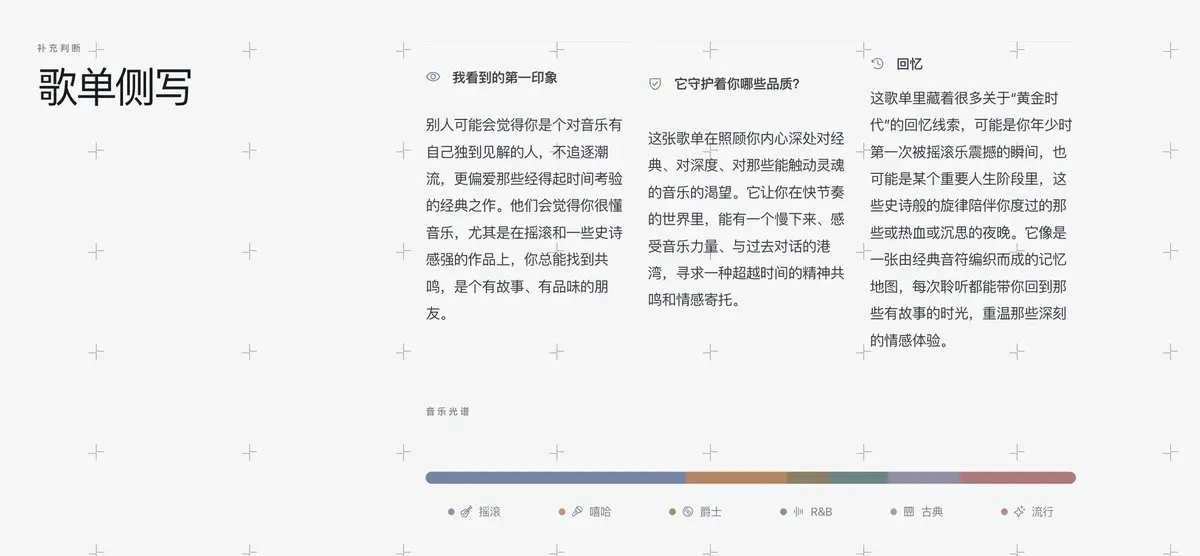
#測測你的音樂品味
你的音樂品味如何?快來測試一下吧!只需要複製貼上你的網易雲歌單連結到
等待5分鐘,就會獲得一個全面的音樂品味評價!
我想知道誰的小眾度最高!
網站使用cloudflare workspace+supbase搭建,資料庫不記錄你任何個人資訊,也不會記錄歌單資訊(全程只在解析端呼叫,所以請放心,不會有任何資訊安全問題)
這是我的測試結果,快來試試你的吧!
整個項目耗時兩天,靈感來自街哥告訴我,小紅書有個人做了個測測你最適合哪個城市,賣了15w銷售額,我很眼紅,就隨手搓了一個,想著以後沒事可以去小紅書賣,成本10刀的網域費,前後端都是我自己做的,很簡單吧!大家想玩vibecoding的多和我交流喔!
查看原文你的音樂品味如何?快來測試一下吧!只需要複製貼上你的網易雲歌單連結到
等待5分鐘,就會獲得一個全面的音樂品味評價!
我想知道誰的小眾度最高!
網站使用cloudflare workspace+supbase搭建,資料庫不記錄你任何個人資訊,也不會記錄歌單資訊(全程只在解析端呼叫,所以請放心,不會有任何資訊安全問題)
這是我的測試結果,快來試試你的吧!
整個項目耗時兩天,靈感來自街哥告訴我,小紅書有個人做了個測測你最適合哪個城市,賣了15w銷售額,我很眼紅,就隨手搓了一個,想著以後沒事可以去小紅書賣,成本10刀的網域費,前後端都是我自己做的,很簡單吧!大家想玩vibecoding的多和我交流喔!

- 讚賞
- 2
- 留言
- 轉發
- 分享

加載更多
加入 4000萬 人匯聚的頭部社群
⚡️ 與 4000萬 人一起參與加密貨幣熱潮討論
💬 與喜愛的頭部創作者互動
👍 查看感興趣的內容
熱門話題
查看更多29.35萬 熱度
51.58萬 熱度
4977.43萬 熱度
17.25萬 熱度
208.19萬 熱度
最新消息
查看更多NCAA "March Madness" begins on March 18, Polymarket data shows Duke University has a 21% probability of winning the championship, currently ranking first
3 分鐘前
Polymarket 上 BLG vs BFX 英雄聯盟比賽預測成交量近百萬美元,兩地址押註 12 萬美元看好 BLG 獲勝
3 分鐘前
HYPE 涨超 39 美元创近 4 個月新高,鏈上最大多頭 5400 萬美元持倉解套
10 分鐘前
谷歌向香港用戶全面開放 Gemini AI 服務
18 分鐘前
下週熱門7大代幣解鎖:ASTER以5684萬美元領先
23 分鐘前
置頂
Gate Booster 第 4 期:發帖瓜分 1,500 $USDT
🔹 發布 TradFi 黃金福袋原創內容,可得 15 $USDT,名額有限先到先得
🔹 本期支持 X、YouTube 發布原創內容
🔹 無需複雜操作,流程清晰透明
🔹 流程:申請成為 Booster → 領取任務 → 發布原創內容 → 回鏈登記 → 等待審核及發獎
📅 任務截止時間:03月20日16:00(UTC+8)
立即領取任務:https://www.gate.com/booster/10028?pid=allPort&ch=KTag1BmC
更多詳情:https://www.gate.com/announcements/article/50203🤖 尋找 Gate 廣場 AI 評測官!$50,000 懸賞令發布!
發帖聊 AI,獎金拿到手軟!新人首帖獎勵翻倍,單帖最高 200U!
📝 立即報名:https://www.gate.com/questionnaire/7477
1️⃣ 發帖得紅包,單帖最高 100U!
2️⃣ Top 體驗分享官:帶 #Gate广场AI测评官 聊技巧,贏國米球衣!
3️⃣ 收益率 PK 王:曬 AI 收益截圖,贏 Gate 定制運動套裝!
4️⃣ 深度好文額外加碼 30U 每篇張榜公布!
💬 來 Gate 廣場,把握行業新趨勢:https://www.gate.com/post
時間:3/12 18:00 – 3/27 24:00 (UTC+8)
詳情:https://www.gate.com/announcements/article/50206Gate 廣場|3/12 今日熱議: #原油价格上涨
🎁 帶話題或 BTC 幣對發帖,抽 5 位錦鯉送出 $2,500 仓位體驗券!
中東局勢突變:阿曼原油出口碼頭全面疏散,伊拉克石油港口停運,兩艘油輪在海灣遇襲,原油供應警報拉滿!國際能源署釋放4億桶儲備,多空對決進入白熱化。
💬 本期熱議
1️⃣ 外交局勢:伊朗開出停戰條件,美伊能否達成共識?
2️⃣ 石油博弈:你看好誰?預測下一步油價走勢。
3️⃣ 加密走勢:油價資金流向將如何影響加密市場?分享你的分析。
立刻分享觀點 👉 https://www.gate.com/post
Gate TradFi,一鍵捕捉原油機遇 👉 https://www.gate.com/tradfi
📅 3/12 15:00 - 3/14 18:00 (UTC+8)Gate 廣場內容挖礦獎勵繼續升級!無論您是創作者還是用戶,挖礦新人還是頭部作者都能贏取好禮獲得大獎。現在就進入廣場探索吧!
創作者享受最高60%創作返佣
創作者獎勵加碼1500USDT:更多新人作者能瓜分獎池!
觀眾點擊交易組件交易贏大禮!最高50GT等新春壕禮等你拿!
詳情:https://www.gate.com/announcements/article/49802