Trade
Basic
Futures
Futures
Hundreds of contracts settled in USDT or BTC
TradFi
Gold
Trade global traditional assets with USDT in one place
Options
Hot
Trade European-style vanilla options
Unified Account
Maximize your capital efficiency
Demo Trading
Futures Kickoff
Get prepared for your futures trading
Futures Events
Participate in events to win generous rewards
Demo Trading
Use virtual funds to experience risk-free trading
Earn
Launch
CandyDrop
Collect candies to earn airdrops
Launchpool
Quick staking, earn potential new tokens
HODLer Airdrop
Hold GT and get massive airdrops for free
Launchpad
Be early to the next big token project
Alpha Points
Trade on-chain assets and enjoy airdrop rewards!
Futures Points
Earn futures points and claim airdrop rewards
Investment
Simple Earn
Earn interests with idle tokens
Auto-Invest
Auto-invest on a regular basis
Dual Investment
Buy low and sell high to take profits from price fluctuations
Soft Staking
Earn rewards with flexible staking
Crypto Loan
0 Fees
Pledge one crypto to borrow another
Lending Center
One-stop lending hub
VIP Wealth Hub
Customized wealth management empowers your assets growth
Private Wealth Management
Customized asset management to grow your digital assets
Quant Fund
Top asset management team helps you profit without hassle
Staking
Stake cryptos to earn in PoS products
Smart Leverage
New
No forced liquidation before maturity, worry-free leveraged gains
GUSD Minting
Use USDT/USDC to mint GUSD for treasury-level yields
More
Participate in horse racing betting, complete tasks to earn horse racing tickets, and enjoy a million red envelope rain daily, sharing a prize pool of 100,000 USDT at the Gate 2026 Spring Festival Celebration. https://www.gate.com/competition/year-of-horse-2026?ref_type=165&utm_cmp=7EQB9Jba&ref=VLVEXFOJCA
View Original
- Reward
- like
- Comment
- Repost
- Share
- Reward
- 1
- Comment
- Repost
- Share
XAMD
XAMD
Created By@ViP2
Subscription Progress
0.00%
MC:
$0
Create My Token
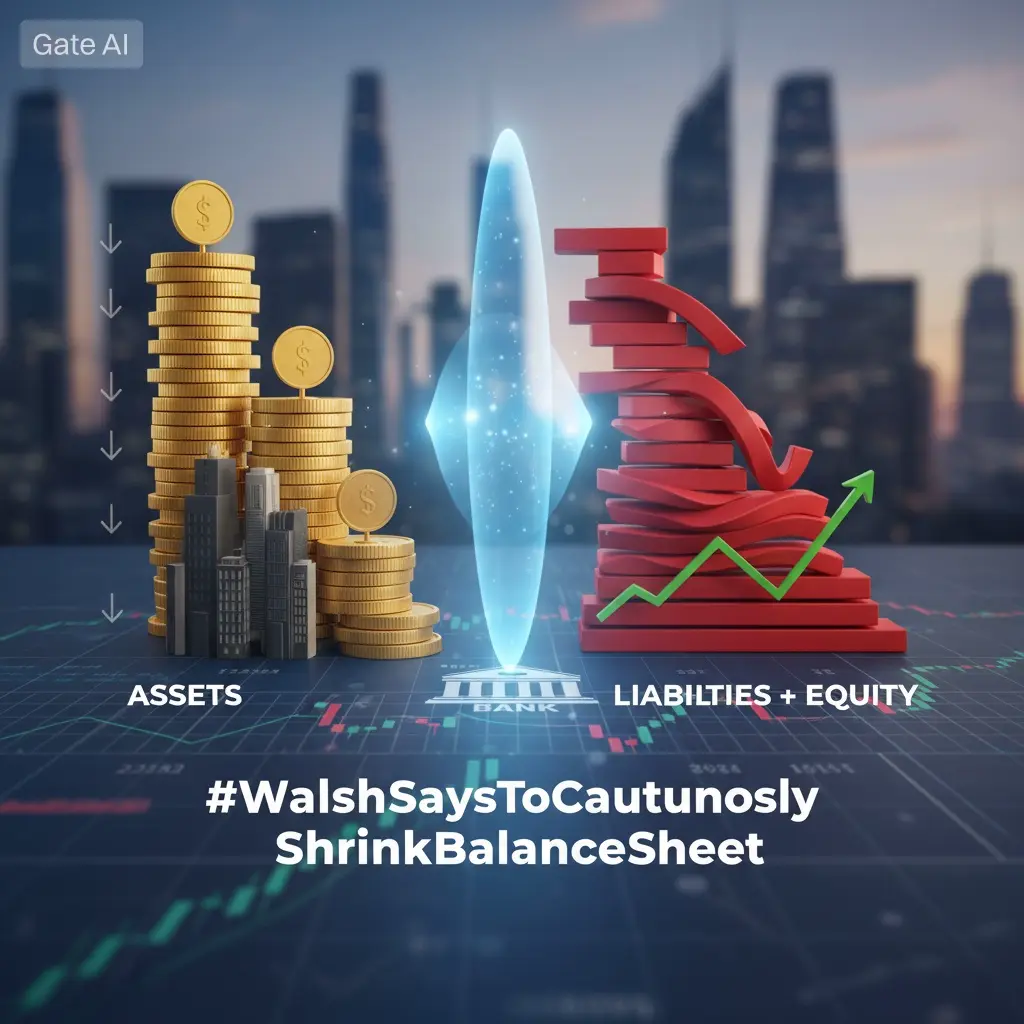
A Careful Path Toward Monetary Normalization
The discussion captured by #WalshSaysToCautiouslyShrinkBalanceSheet reflects a critical moment in U.S. monetary policy, as policymakers and market participants reassess the long-term implications of an expanded Federal Reserve balance sheet. Kevin Warsh, a former Federal Reserve governor, has consistently emphasized that while extraordinary measures were justified during periods of crisis, maintaining an oversized balance sheet for too long can introduce structural distortions into financial markets. His position is not about aggressive tightening,
The discussion captured by #WalshSaysToCautiouslyShrinkBalanceSheet reflects a critical moment in U.S. monetary policy, as policymakers and market participants reassess the long-term implications of an expanded Federal Reserve balance sheet. Kevin Warsh, a former Federal Reserve governor, has consistently emphasized that while extraordinary measures were justified during periods of crisis, maintaining an oversized balance sheet for too long can introduce structural distortions into financial markets. His position is not about aggressive tightening,
- Reward
- like
- Comment
- Repost
- Share
Participate in horse racing betting, complete tasks to earn horse racing tickets, and enjoy a million red envelope rain daily, sharing a prize pool of 100,000 USDT at the Gate 2026 Spring Festival Celebration. https://www.gate.com/competition/year-of-horse-2026?ref_type=165&utm_cmp=7EQB9Jba&ref=VLFEXQXABW
View Original
- Reward
- like
- Comment
- Repost
- Share
Participate in horse racing betting, complete tasks to earn horse racing tickets, and enjoy a million red envelope rain daily, sharing a prize pool of 100,000 USDT at the Gate 2026 Spring Festival Celebration. https://www.gate.com/competition/year-of-horse-2026?ref_type=165&utm_cmp=7EQB9Jba&ref=VQRNVQXFUQ
View Original
- Reward
- like
- Comment
- Repost
- Share
Participate in horse racing betting, complete tasks to earn horse racing tickets, and enjoy a million red envelope rain daily, sharing a prize pool of 100,000 USDT at the Gate 2026 Spring Festival Celebration. https://www.gate.com/competition/year-of-horse-2026?ref_type=165&utm_cmp=7EQB9Jba&ref=VVESUVKNAW
View Original
- Reward
- like
- Comment
- Repost
- Share
Participate in horse racing betting, complete tasks to earn horse racing tickets, and enjoy a million red envelope rain daily, sharing a prize pool of 100,000 USDT at the Gate 2026 Spring Festival Celebration. https://www.gate.com/competition/year-of-horse-2026?ref_type=165&utm_cmp=7EQB9Jba&ref=EATCANDY
View Original
- Reward
- like
- Comment
- Repost
- Share
Participate in horse racing betting, complete tasks to earn horse racing tickets, and enjoy a million red envelope rain daily, sharing a prize pool of 100,000 USDT at Gate 2026 Spring Festival Celebration. https://www.gate.com/competition/year-of-horse-2026?ref_type=165&utm_cmp=7EQB9Jba&ref=VLDAVA9YAA
View Original
- Reward
- like
- Comment
- Repost
- Share
Participate in horse racing betting, complete tasks to earn horse racing tickets, and enjoy a million red envelope rain daily, sharing a prize pool of 100,000 USDT at the Gate 2026 Spring Festival Celebration. https://www.gate.com/competition/year-of-horse-2026?ref_type=165&utm_cmp=7EQB9Jba&ref=UwcRUgpZ
View Original
- Reward
- like
- Comment
- Repost
- Share
Participate in horse racing betting, complete tasks to earn horse racing tickets, and enjoy a million red envelope rain daily, sharing a prize pool of 100,000 USDT at the Gate 2026 Spring Festival Celebration. https://www.gate.com/competition/year-of-horse-2026?ref_type=165&utm_cmp=7EQB9Jba&ref=VQIQBA8JAA
View Original
- Reward
- like
- Comment
- Repost
- Share
Participate in horse racing betting, complete tasks to earn horse racing tickets, and enjoy a million red envelope rain daily, sharing a prize pool of 100,000 USDT at the Gate 2026 Spring Festival Celebration. https://www.gate.com/competition/year-of-horse-2026?ref_type=165&utm_cmp=7EQB9Jba&ref=VgIWAQpa
View Original
- Reward
- like
- Comment
- Repost
- Share
胡杨
poplar
Created By@HeDaoCommunity6Passionate
Listing Progress
0.00%
MC:
$2.4K
Create My Token
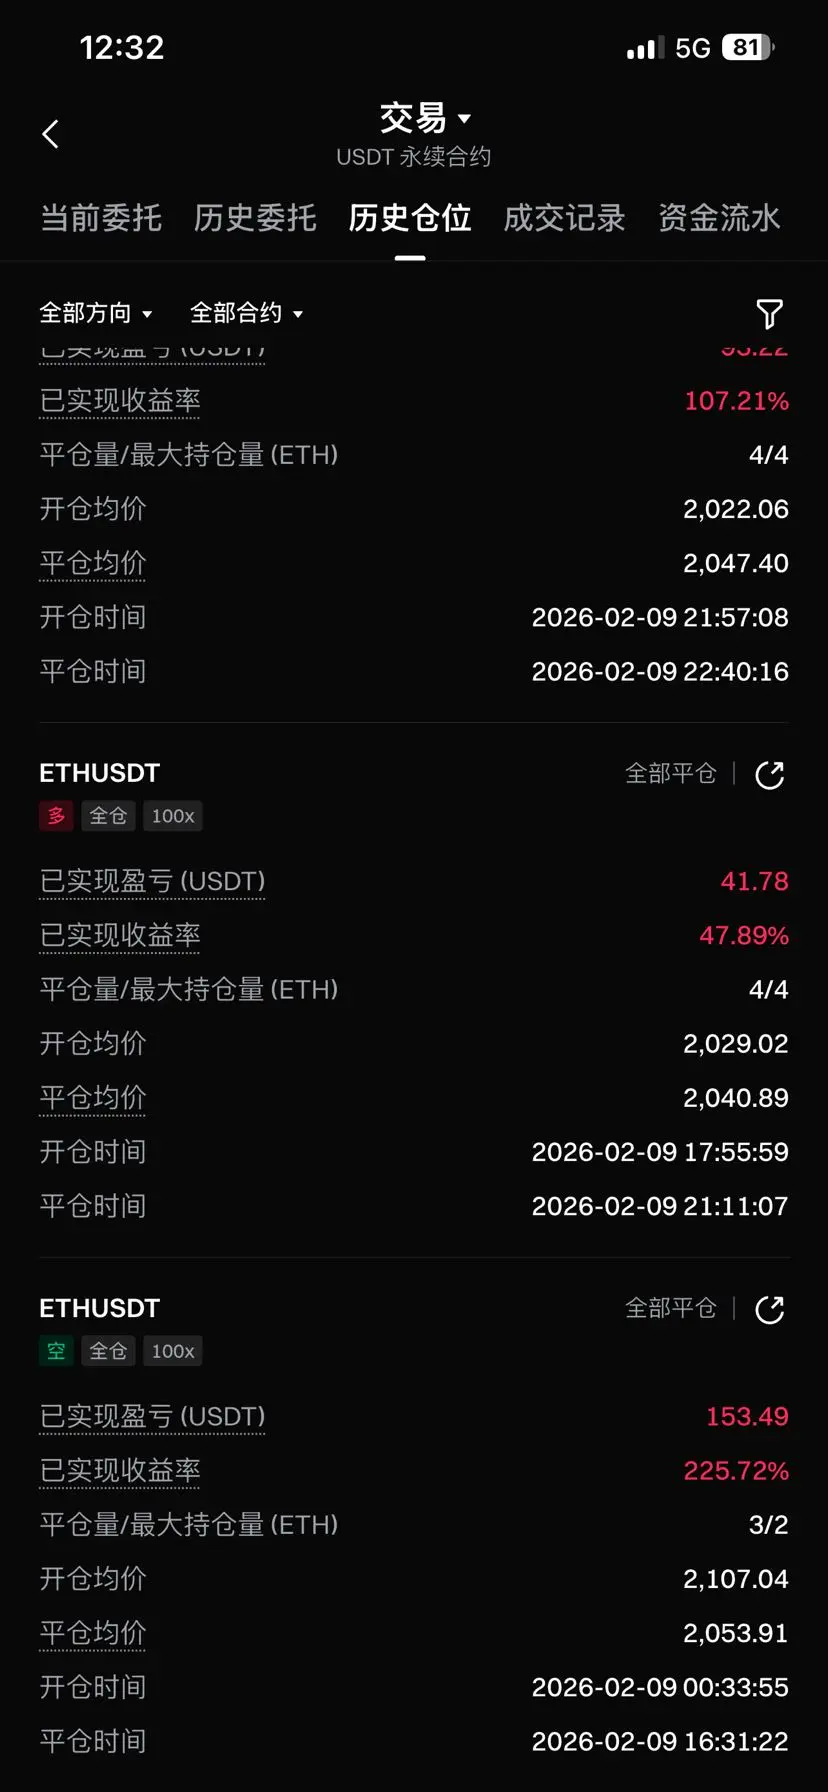
Today, the stock market is inflating again, but market makers are extremely reluctant to follow suit - a sharp rise was clearly not in their plans. Before moving upward, they need to unwind long positions at the bottom, so the maker has to operate in opposition and is literally torn apart.
Throughout the day, it’s evident that short positions dominate the market on the pound - the crowd is still focused on shorting.
#$BTC
#BuyTheDipOrWaitNow?
#BitcoinBouncesBack
Throughout the day, it’s evident that short positions dominate the market on the pound - the crowd is still focused on shorting.
#$BTC
#BuyTheDipOrWaitNow?
#BitcoinBouncesBack
BTC-1,61%


- Reward
- like
- Comment
- Repost
- Share
Participate in horse racing betting, complete tasks to earn horse racing tickets, and enjoy a million red envelope rain daily, sharing a prize pool of 100,000 USDT at the Gate 2026 Spring Festival Celebration. https://www.gate.com/competition/year-of-horse-2026?ref_type=165&utm_cmp=7EQB9Jba&ref=DFBCNXDF
View Original
- Reward
- like
- Comment
- Repost
- Share
Participate in horse racing betting, complete tasks to earn horse racing tickets, and enjoy a million red envelope rain daily, sharing a prize pool of 100,000 USDT at Gate 2026 Spring Festival Celebration. https://www.gate.com/competition/year-of-horse-2026?ref_type=165&utm_cmp=7EQB9Jba&ref=VlQWV1FX
View Original
- Reward
- like
- Comment
- Repost
- Share
On the second day as a newcomer, $ETH $BTC 500u is almost back to break-even. Keep pushing, I only trade BTC and ETH, hold strong!!!#当前行情抄底还是观望?
View Original
- Reward
- like
- Comment
- Repost
- Share
Bitcoin rebound: technical repair or demand revival? The key lies in spot market capital flows.
160
- Reward
- like
- Comment
- Repost
- Share
Market Analysis 2026.02.10
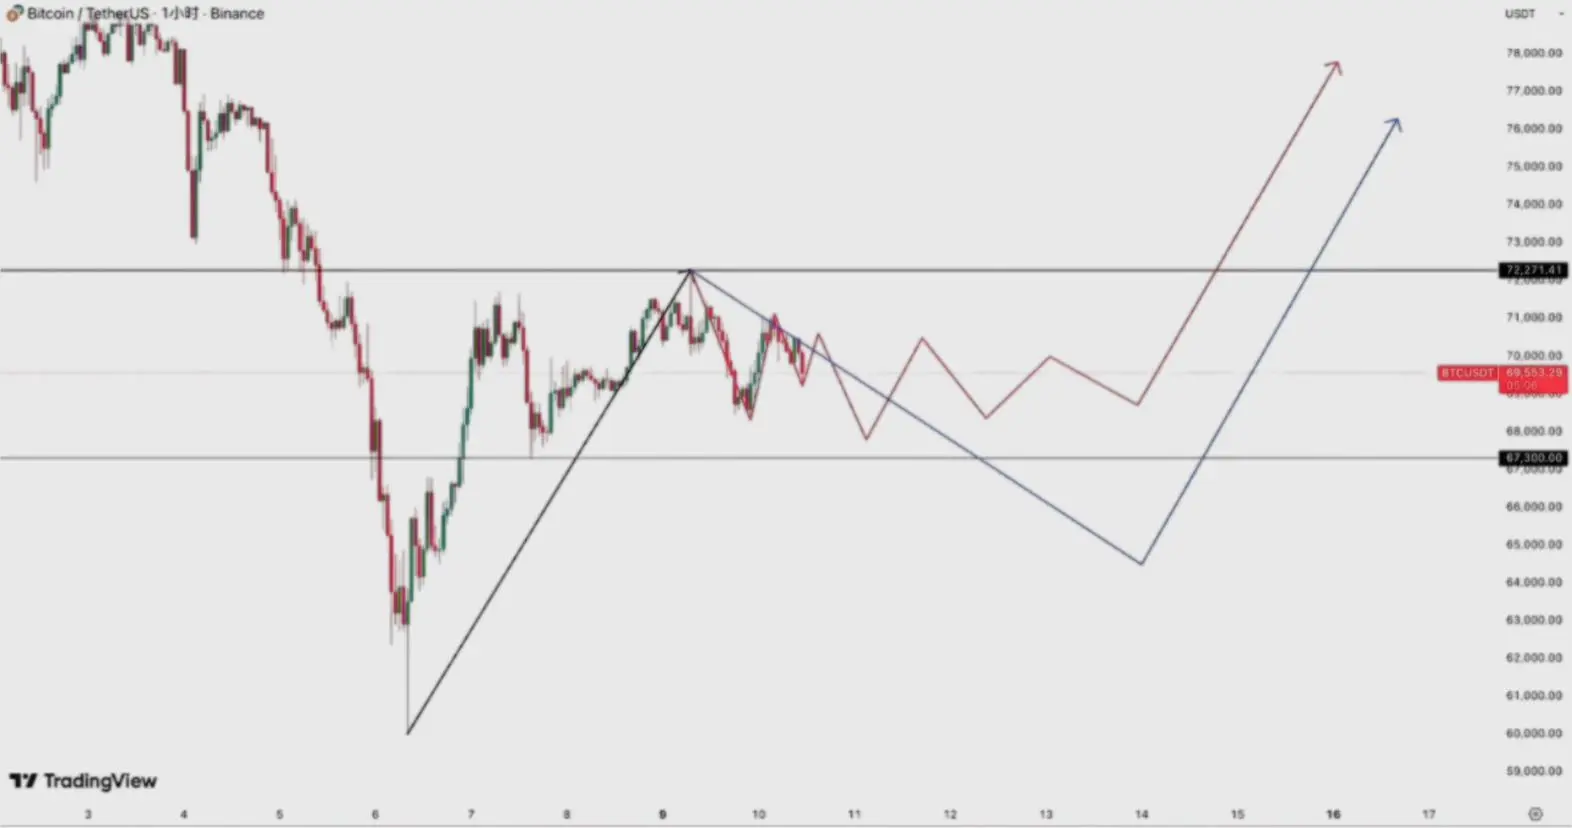
Yesterday, I discussed BTC's macro trend, and the current view remains unchanged. Now, let's talk about the micro level, which is the recent market behavior.
The chart shows the BTC 1-hour candlestick chart. The entire black arrow segment is considered the first wave of a rebound from the oversold condition starting at $60,000. The pullback from 722 is a correction of this upward move from $60,000 to 722. After identifying the correction's end point, there is still some upward potential.
Last night, after dropping to 683, the price stopped falling, so the community w
BTC-1,61%
- Reward
- like
- Comment
- Repost
- Share
Participate in horse racing betting, complete tasks to earn horse racing tickets, and enjoy a million red envelope rain daily, sharing a prize pool of 100,000 USDT at the Gate 2026 Spring Festival Celebration. https://www.gate.com/competition/year-of-horse-2026?ref_type=165&utm_cmp=7EQB9Jba&ref=VVDEVW9BVA
View Original
- Reward
- like
- Comment
- Repost
- Share
Live Trading and Learning with Chillzzz
0
- Reward
- like
- Comment
- Repost
- Share
Load More
Join 40M users in our growing community
⚡️ Join 40M users in the crypto craze discussion
💬 Engage with your favorite top creators
👍 See what interests you
Trending Topics
View More197.61K Popularity
254 Popularity
516 Popularity
5.29K Popularity
136 Popularity
Hot Gate Fun
View More- MC:$2.41KHolders:10.00%
- MC:$2.4KHolders:10.00%
- MC:$2.56KHolders:21.71%
- MC:$2.41KHolders:10.00%
- MC:$2.52KHolders:20.48%
News
View MoreAlpha Token New Listing: Molten is now live
1 m
Alpha Token New Listing: OPAL is now live
1 m
Alpha Token New Listing: Pigeon is now live
2 m
Intercontinental Exchange launches CoinDesk BNB futures contracts
4 m
"Wood Sister": Bitcoin is an important asset reflecting three major transformations, and its low correlation with gold will promote diversification of its attributes.
9 m
Pin