ChenJiaguanA
vip
Age 0.8 Yıl
Peak Tier 0
No content yet
Currently, ETH is following the main market on the 6H chart and also shows signs of building momentum for a breakout. However, an intraday upward breakout attempt to test 3180 was rejected, followed by a pullback to around 3090. Going forward, pay attention to whether the gray area can be effectively broken below. If it cannot, you can follow the main market to look for a rebound and go long at lower positions. Our target is to look up to 3180-3250.
ETH-0.41%
View Original
post-image
  • Reward
  • Comment
  • Repost
  • Share
From the current 6H chart for BTC,
overall it is showing signs of consolidation before a breakout.
Intraday rebound up to the 92k resistance is effective,
pulling back down to around 89k.
As long as it doesn’t break below the support in the gray area,
we can look for a rebound and go long on dips.
Our target is to look up to the 92k-94k resistance.
View Original
post-image
  • Reward
  • Comment
  • Repost
  • Share
The top intraday resistance is right here
The 92k resistance was already indicated
Then I also mentioned the weekend CME gap
BTC dropped by 2k as expected
ETH did the same
On the hourly level, two breakout attempts at 3180 were both rejected
Those who are decisive on the right side just picked up profits ​​​
BTC-1.2%
ETH-0.41%
View Original
post-image
post-image
post-image
  • Reward
  • Comment
  • Repost
  • Share
The above mentioned the 92k resistance level.
It was rejected twice on the hourly timeframe during upward tests.
Also suggested to enter from the right side.
Already ↓1k as a starter. ​​​
View Original
post-image
  • Reward
  • Comment
  • Repost
  • Share
There is a small CME gap for BTC this weekend.
As always, it's worth keeping an eye on it, but don't get too fixated.
BTC-1.2%
View Original
post-image
  • Reward
  • Comment
  • Repost
  • Share
The current 4-hour trend is accumulating strength for an upward breakout.
It is now oscillating near the first resistance at 92k.
If it holds steady and breaks upward, look to the 94k resistance.
If it fails to break through and is pushed back, watch for support near 89k.
(Try to operate on the right side) ​​​
View Original
post-image
  • Reward
  • Comment
  • Repost
  • Share
Don't rush to call it "altcoin season" yet! This chart shows the real picture.
Yellow = BTC price, green = total cryptocurrency market cap, thin lines = market caps of the top 10/50/100 altcoins.
The core of this rally is BTC dominance—the green line basically follows the yellow one, with only brief windows where altcoins have a pulse, after which small-cap coins drop even harder (classic bull market risk-off: funds flow back to BTC + a few strong coins).
A true altcoin season requires 3 signals:
1. BTC cools off and moves sideways
2. Total market cap breaks previous highs + forms higher lows
BTC-1.2%
View Original
post-image
  • Reward
  • Comment
  • Repost
  • Share
Currently, on the 1H level, the market is fluctuating up and down.
The market style is still in a consolidation phase.
It is now approaching the stage resistance zone of 91.2-91.7 (, which is a potential entry point for bears ).
If it fails to break through, it will still come down to 89K. ​​​
View Original
post-image
  • Reward
  • Comment
  • Repost
  • Share
The market is still the same as before.
In the past month, dozens of coins have risen by +20-30%.
Meanwhile, most coins continue to fall endlessly, plagued by investor and team unlocks, deeply trapped holders, as well as generally weak momentum and sentiment.
This trend runs through the entire cycle, and I feel it will never stop.
Most coins will eventually go to zero.
Some coins will perform well for a while, then also go to zero.
Only a few coins will survive and continue to perform well in the next cycle.
This is the law of the market, and it will continue to develop this way.
If you are no
BTC-1.2%
View Original
post-image
  • Reward
  • Comment
  • Repost
  • Share
The last few weeks of the year for BTC usually don’t see much interesting price movement.
Except for 2013, 2017, and 2020, things have generally been pretty flat.
Interestingly, the extra day in a leap year usually brings decent returns—something I hadn’t noticed before.
Overall, I don’t expect any major volatility until the new year begins.
Typically, the market is quite choppy at the end and beginning of the year.
Especially during Christmas, both liquidity and trading volumes are very low.
BTC-1.2%
View Original
post-image
  • Reward
  • Comment
  • Repost
  • Share
Global liquidity has been rising over the past two weeks.
Coincidentally, ( is actually not a coincidence ), as we see BTC found its local bottom right when liquidity started to increase.
This is a phenomenon we often observe.
I believe that as long as global liquidity continues to expand, BTC will eventually join the party. ​​​
BTC-1.2%
View Original
post-image
  • Reward
  • Comment
  • Repost
  • Share
Daily K-line chart comparison shows that it ultimately failed to break through directly and pulled back to around 88,000.
Currently fluctuating near 90,000.
There is almost no doubt that the Fed will cut rates by 25 basis points next week, and similarly, the probability of a Bank of Japan rate hike the week after is also high. With one cut and one hike, carry trade returns will drop significantly.
This will force investors to sell US stocks and convert back to yen to repay debts, with tech and growth stocks favored by carry trade funds being hit first.
US rate hikes remain the biggest uncertai
View Original
post-image
  • Reward
  • Comment
  • Repost
  • Share
From a liquidity perspective, the key levels to watch next week are 84k and 94k.
The price is currently between these two levels, as well as within the range formed between them this week.
A breakout above 94k could potentially push it into the 100k area.
If it falls below 84k, it may retest the local lows, which doesn't look very optimistic.
For now, it's just a range. ​​​
View Original
post-image
  • Reward
  • Comment
  • Repost
  • Share
BTC has recently experienced the largest pullback of this cycle.
As for whether this is just another correction within a larger upward trend, it's still uncertain.
Technically, the 4-year cycle remains quite accurate in terms of timing.
However, from a price perspective, we might already consider the 4-year cycle to be broken, since this year's performance has been a decline, while it should have been a big rally in the last year of the cycle.
2026 will be very interesting.
I don't think things will be that simple.
I think it's more likely that we'll see these rotations of small rises and fall
BTC-1.2%
View Original
post-image
  • Reward
  • Comment
  • Repost
  • Share
ETH is still in an important zone.
But it seems that ETH has made a directional move in the short term
with this higher low and a strong rebound.
For bulls, it’s very important to hold the green zone next.
If this rebound continues, the upside target is the 3.3K area.
ETH-0.41%
View Original
post-image
  • Reward
  • Comment
  • Repost
  • Share
BTC cleared a lot of liquidity below during the fall on Monday.
If it falls below the 85K area again, there is still a large amount of liquidity worth noting at 83K.
Above, the $93K level above the weekend high is something to pay attention to.
From the quick fall after the new moon opening that we observed, there is a large gap/inefficient area on the way there.
BTC-1.2%
View Original
post-image
  • Reward
  • Comment
  • Repost
  • Share
BTC was rejected from the previous support and resistance zones.
This is definitely not what Brother Duo Jun wants to see.
After experiencing a nice +15% rebound, it lost momentum again a week later.
That said, it's the beginning of the week/month now, and we often see new monthly candlesticks bringing about drastic fluctuations.
These are usually not the strongest highs/lows set at the new moon. So, in the coming days, the 0.786 Fibonacci retracement is worth paying attention to.
BTC-1.2%
View Original
post-image
  • Reward
  • Comment
  • Repost
  • Share
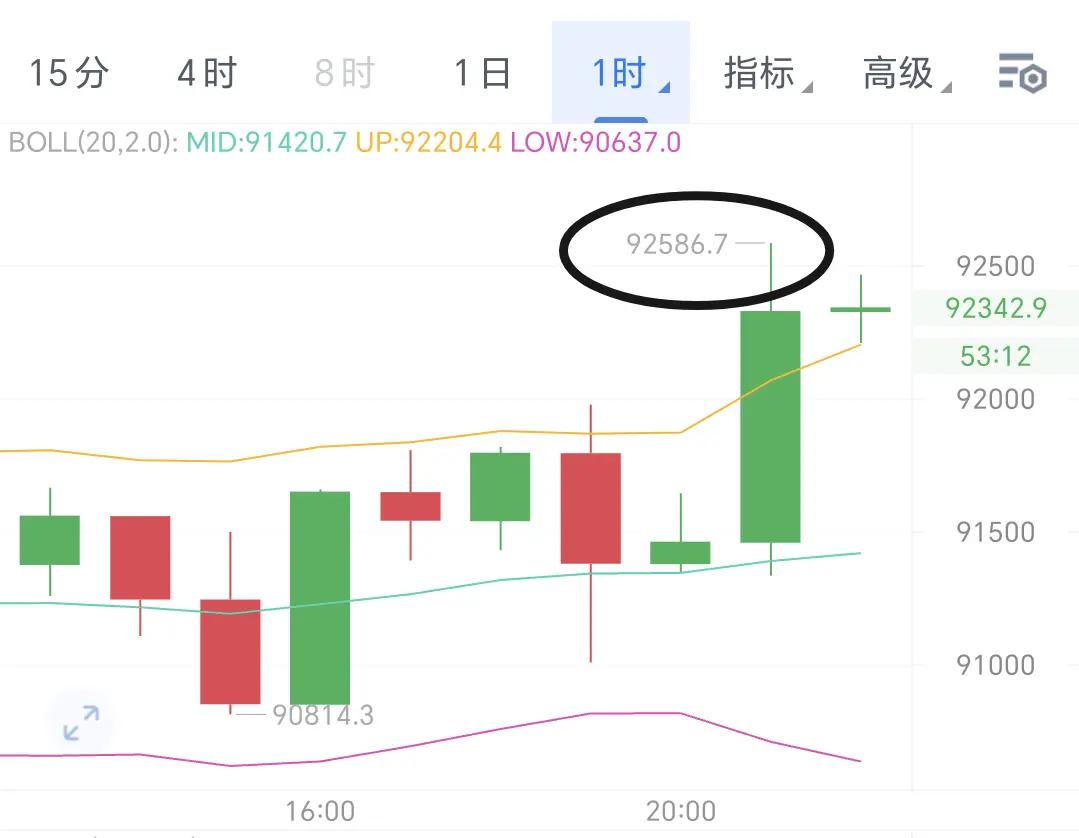
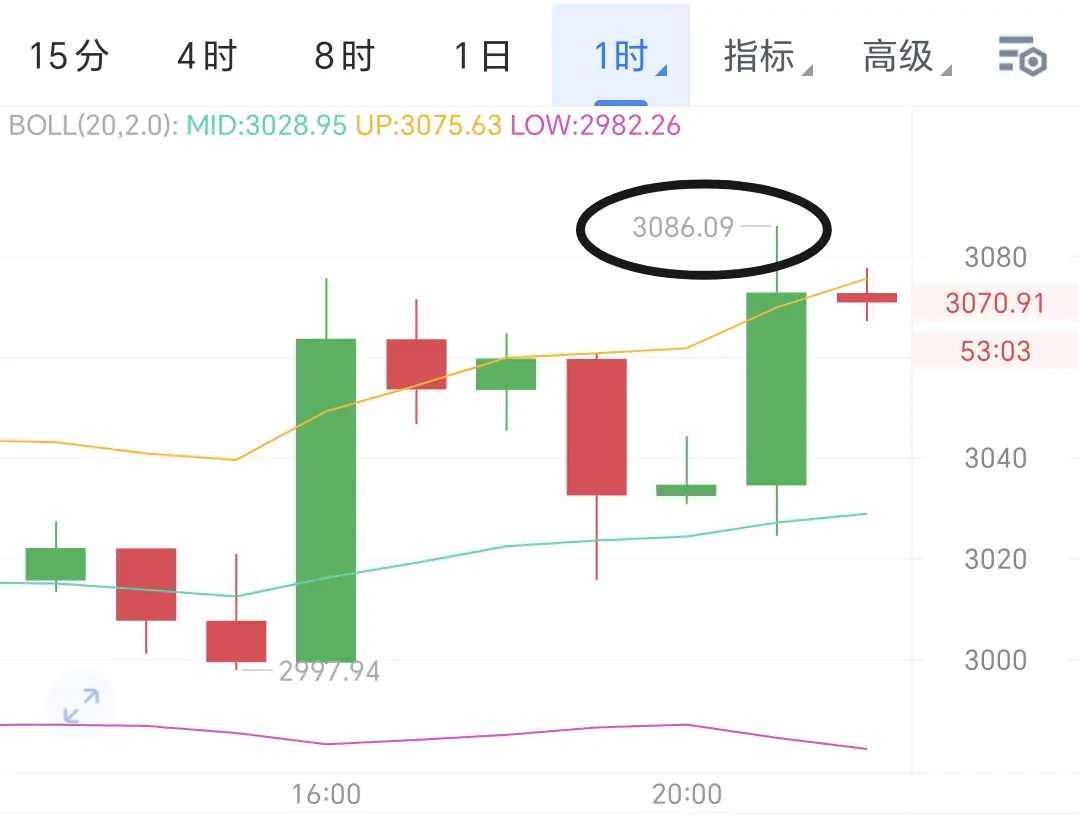
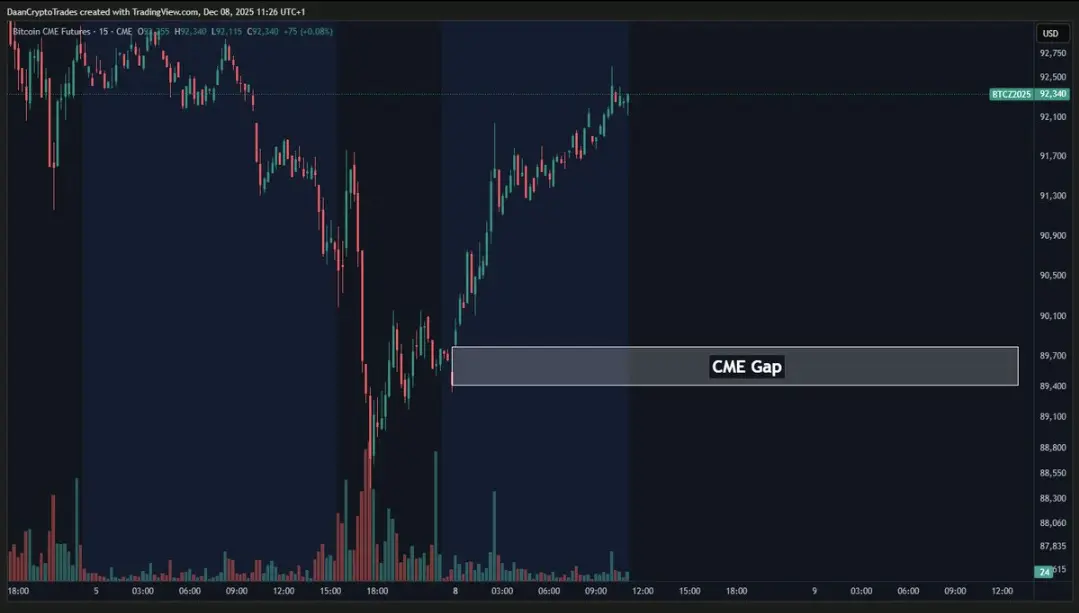
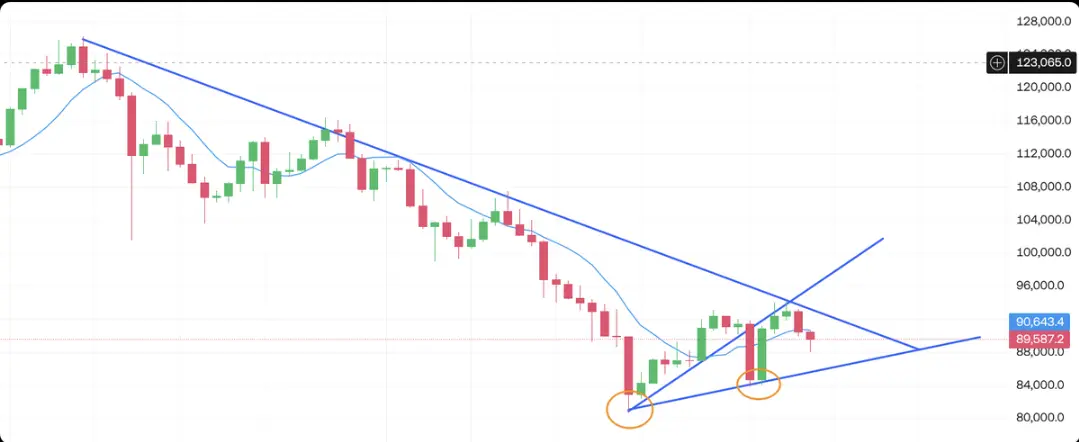
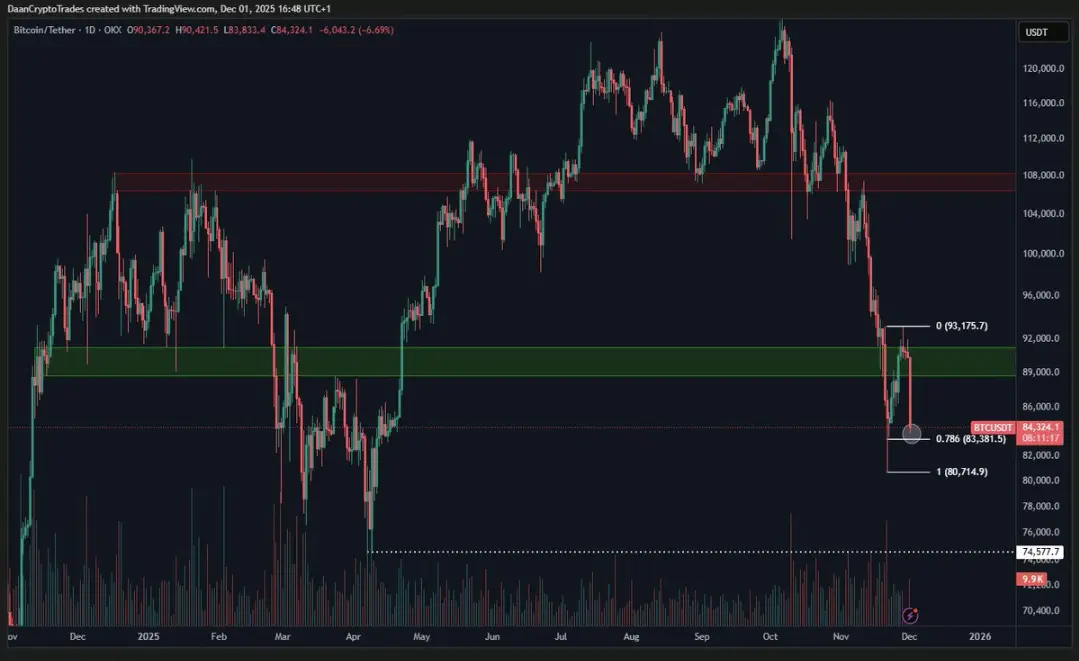
BTC has been consolidating in this relatively narrow range of 91.3k-92.4k.
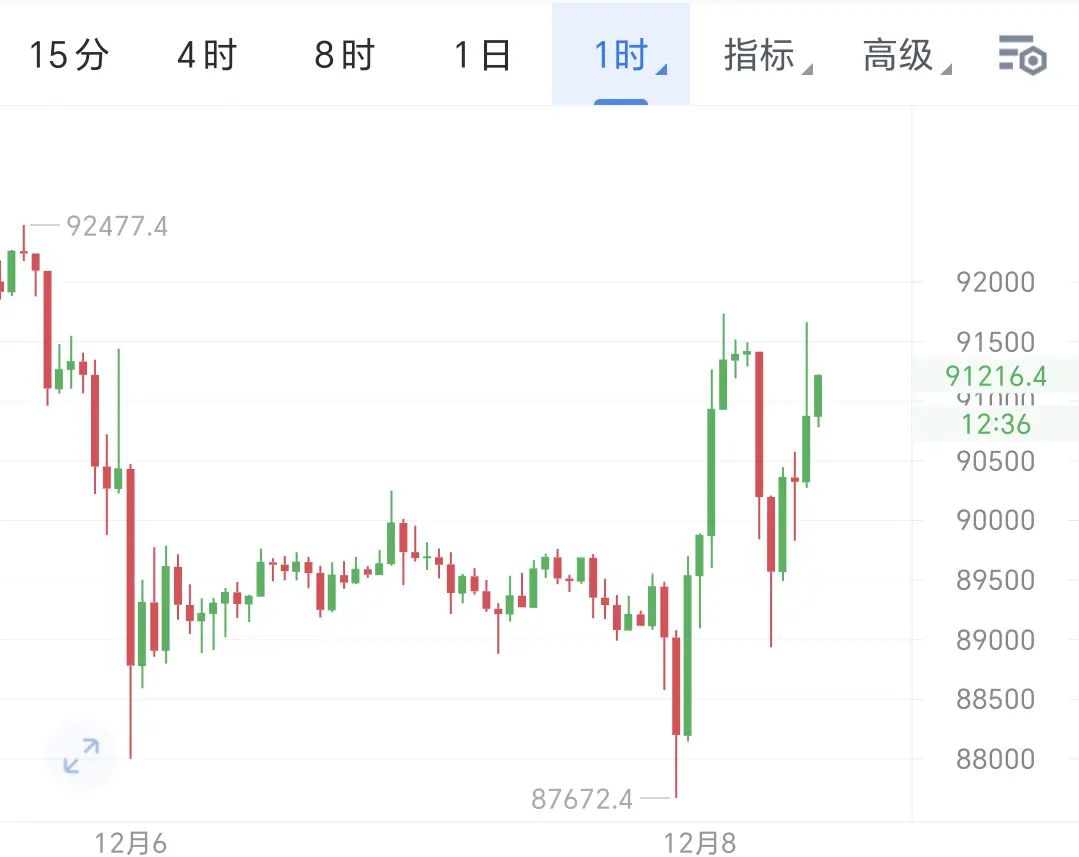
After the futures market reopened today, it broke through the high point and reached 93k, but now it has returned to the 91k range.
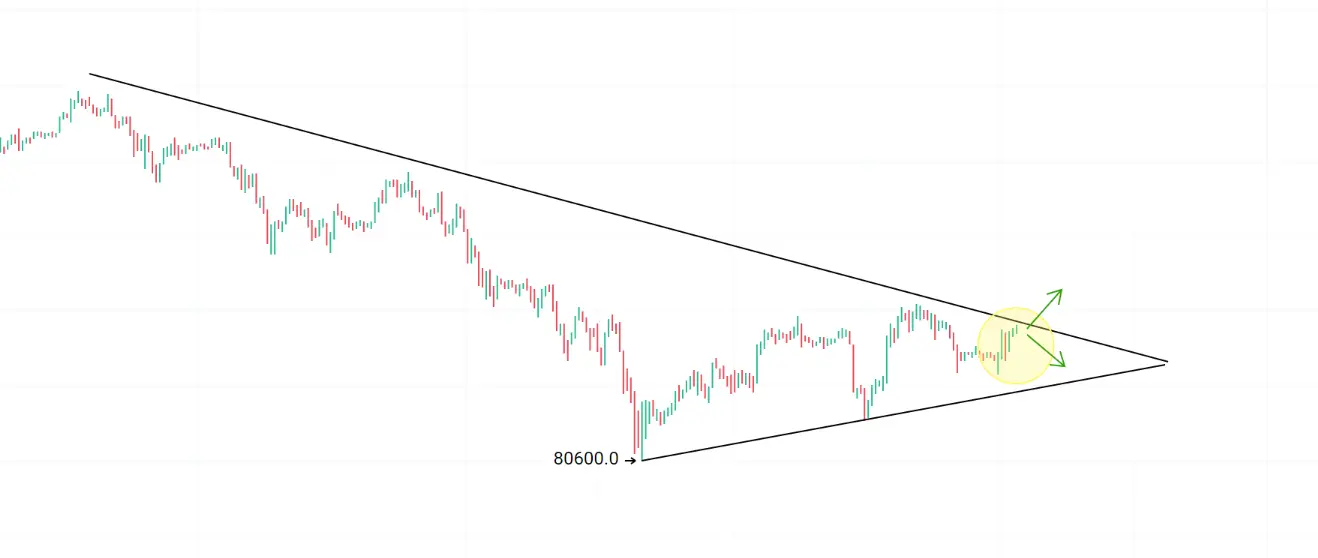
If it breaks below, I think 88k-89k is worth paying attention to or can maintain above 91K, it may try to break through 93K again.
The market environment around Thanksgiving is quite volatile in the short term, and the trading volume and liquidity are usually low during the weekend.
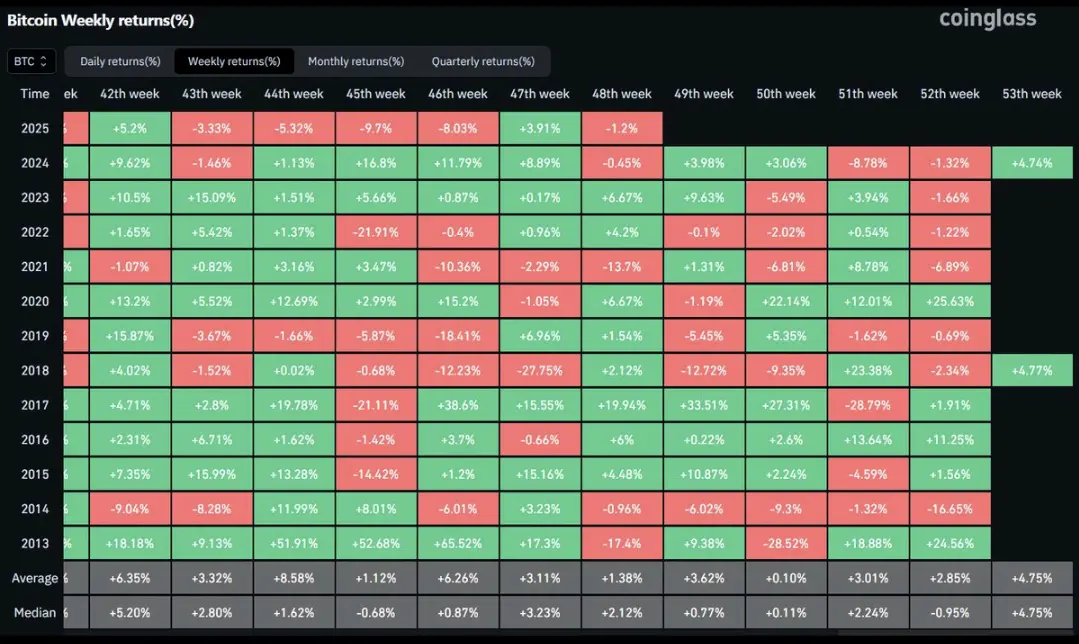
BTC-1.2%
View Original
  • Reward
  • Comment
  • Repost
  • Share
Have you noticed these few locations?
The second one walked a bit faster, while the first one continued to pay attention.
View Original
post-image
post-image
post-image
  • Reward
  • Comment
  • Repost
  • Share
  • Trending TopicsView More
  • Pin
Trade Crypto Anywhere Anytime
qrCode
Scan to download Gate App
Community
  • 简体中文
  • English
  • Tiếng Việt
  • 繁體中文
  • Español
  • Русский
  • Français (Afrique)
  • Português (Portugal)
  • Bahasa Indonesia
  • 日本語
  • بالعربية
  • Українська
  • Português (Brasil)