Trade
Basic
Futures
Futures
Hundreds of contracts settled in USDT or BTC
TradFi
Gold
Trade global traditional assets with USDT in one place
Options
Hot
Trade European-style vanilla options
Unified Account
Maximize your capital efficiency
Demo Trading
Futures Kickoff
Get prepared for your futures trading
Futures Events
Participate in events to win generous rewards
Demo Trading
Use virtual funds to experience risk-free trading
Earn
Launch
CandyDrop
Collect candies to earn airdrops
Launchpool
Quick staking, earn potential new tokens
HODLer Airdrop
Hold GT and get massive airdrops for free
Launchpad
Be early to the next big token project
Alpha Points
Trade on-chain assets and enjoy airdrop rewards!
Futures Points
Earn futures points and claim airdrop rewards
Investment
Simple Earn
Earn interests with idle tokens
Auto-Invest
Auto-invest on a regular basis
Dual Investment
Buy low and sell high to take profits from price fluctuations
Soft Staking
Earn rewards with flexible staking
Crypto Loan
0 Fees
Pledge one crypto to borrow another
Lending Center
One-stop lending hub
VIP Wealth Hub
Customized wealth management empowers your assets growth
Private Wealth Management
Customized asset management to grow your digital assets
Quant Fund
Top asset management team helps you profit without hassle
Staking
Stake cryptos to earn in PoS products
Smart Leverage
New
No forced liquidation before maturity, worry-free leveraged gains
GUSD Minting
Use USDT/USDC to mint GUSD for treasury-level yields
More
十一
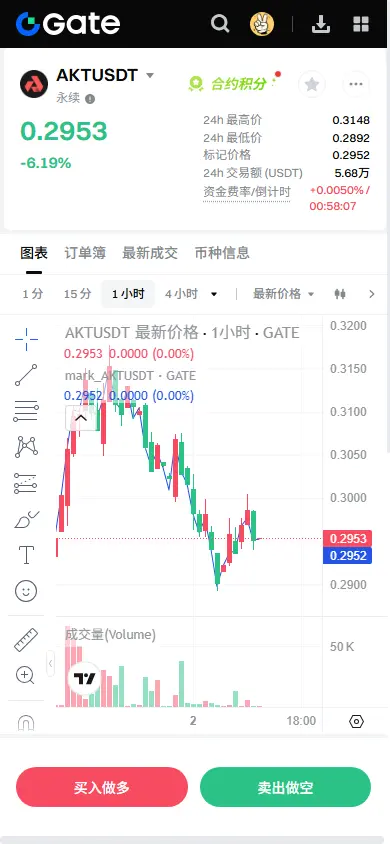
【$AKT Signal】Pullback to Long + 1H Level Support and Rebound
The 1H level has formed a double bottom structure around 0.293, and the price has already broken above the 1H EMA20, indicating a short-term reversal signal. Although the 4H level is still in a downtrend channel, OI remains stable and buying depth is dominant, showing clear signs of main force support. An oversold rebound is imminent.
🎯Direction: Long $AKT Long(
⚡Entry/Order: 0.2929 - 0.2944
🛑Stop Loss: 0.2880
🚀Target 1: 0.3030
🚀Target 2: 0.3100
🛡️Trading Management:
- Execution Strategy: Reduce 50% of the position after reachin
View OriginalThe 1H level has formed a double bottom structure around 0.293, and the price has already broken above the 1H EMA20, indicating a short-term reversal signal. Although the 4H level is still in a downtrend channel, OI remains stable and buying depth is dominant, showing clear signs of main force support. An oversold rebound is imminent.
🎯Direction: Long $AKT Long(
⚡Entry/Order: 0.2929 - 0.2944
🛑Stop Loss: 0.2880
🚀Target 1: 0.3030
🚀Target 2: 0.3100
🛡️Trading Management:
- Execution Strategy: Reduce 50% of the position after reachin
- Reward
- like
- Comment
- Repost
- Share
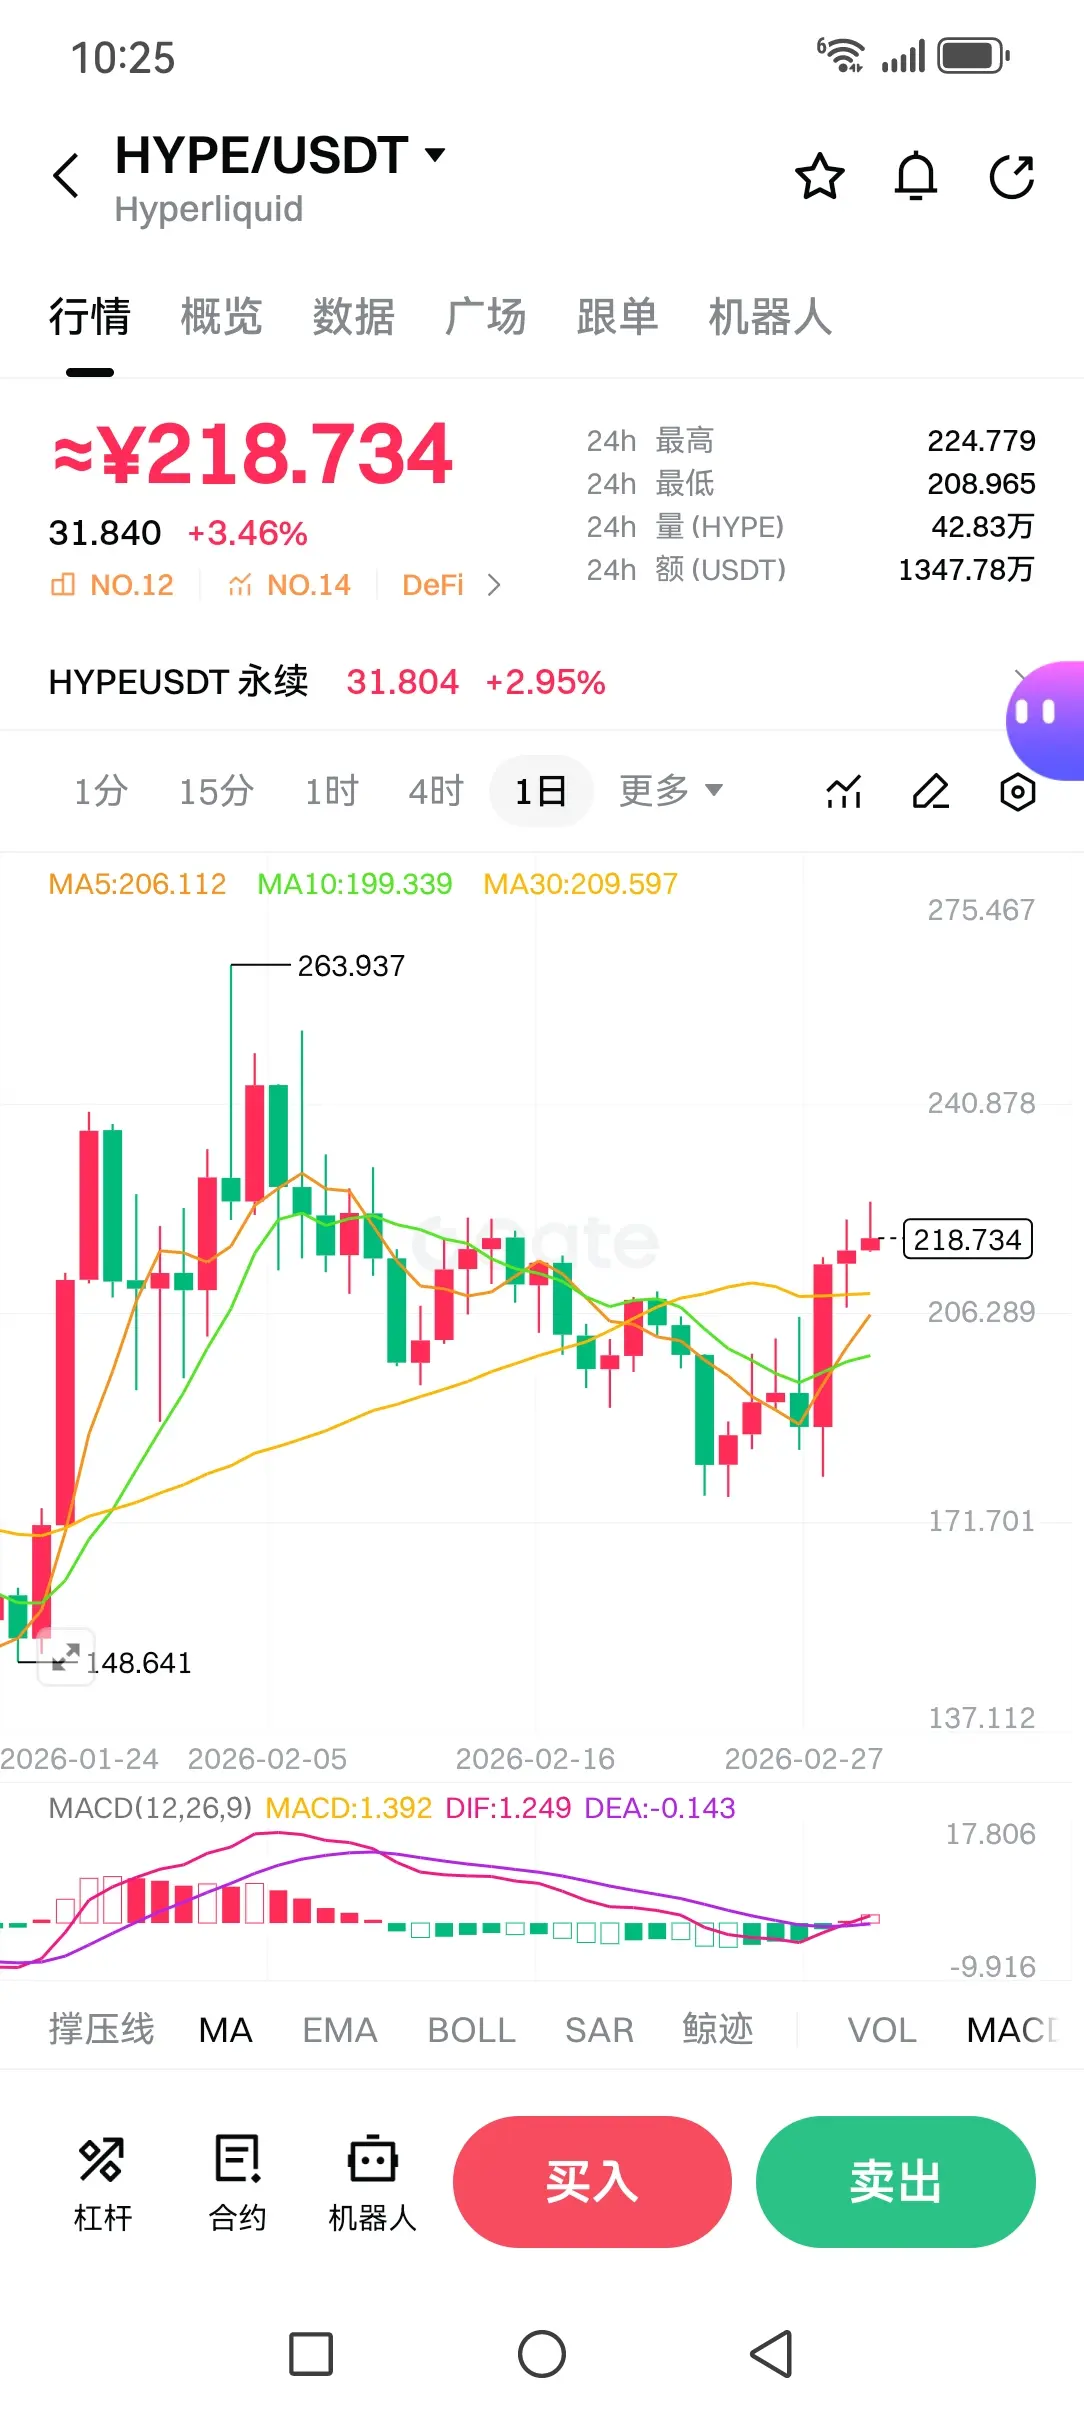
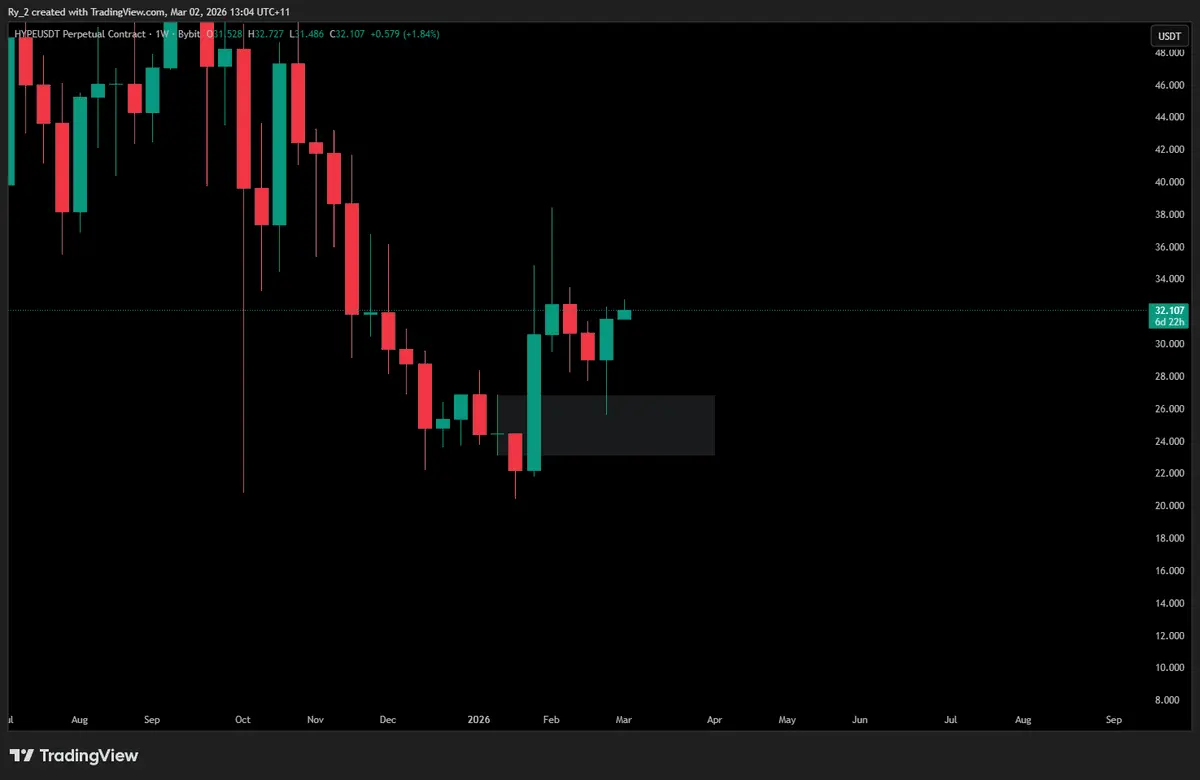
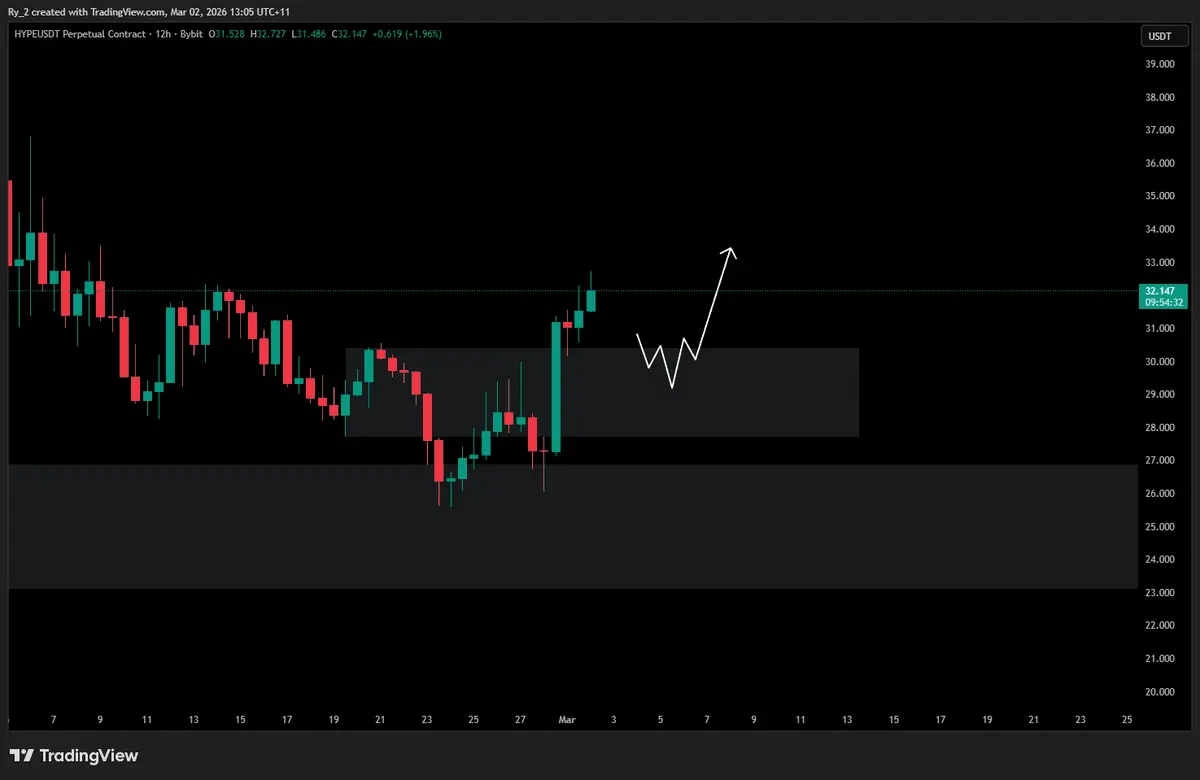
HYPE Why is it so strong???
Currently, HYPE is unregulated, not only offering crude oil contracts but also Korean stocks. Whatever financial asset investment product you can think of, HYPE has it.
The day before yesterday, Qasem Soleimani was killed, and the Middle East situation caused oil issues. War has led to rising oil and gold prices over the weekend. However, CME, the US futures exchange, is not open, and hyperliquid's oil and gold-related hip-3 contracts have become a major source of liquidity and partial pricing over the weekend, helping traditional financial holders hedge risks or tr
HYPE2,77%
- Reward
- 5
- 4
- Repost
- Share
Discovery :
:
2026 GOGOGO 👊View More
my openclaw sidekick is cooking.
- Reward
- like
- Comment
- Repost
- Share
¥
狗头萝莉
Created By@F91bbTop
Subscription Progress
0.00%
MC:
$0
More Tokens
#JaneStreet10AMSellOff
JaneStreet 10 AM Sell-Off: Deep Analysis of Institutional Flow, Liquidity Dynamics, and Market Microstructure in 2026 Crypto Trading
The 10 AM sell-off executed by JaneStreet in 2026 serves as a vivid illustration of how institutional activity can shape intraday cryptocurrency market dynamics, influencing price formation, volatility, and investor psychology. Unlike the panic-driven sell-offs that have historically plagued retail-dominated markets, this event represents the calculated actions of a major liquidity provider, likely reflecting portfolio rebalancing, exposur


- Reward
- 2
- 5
- Repost
- Share
Yunna:
2026 GOGOGO 👊View More
✅ Previous order alert
Posted 1985 short position, reduce position in batches immediately, lock in profits!
🎉 Congratulations to the friends who followed the 2015, 2005, and 1985 short positions, fully riding the wave, perfect timing!
Be patient for the next order, do not chase or rush, continue to secure profits steadily.
#美国以色列突袭伊朗BTC短线跳水
BTC-1,2%
- Reward
- like
- Comment
- Repost
- Share
☀️ GM! Strike gold today and keep that bull energy charging!

- Reward
- 2
- 7
- Repost
- Share
HighAmbition:
good morning 🌄View More
Recently, the market has been fluctuating back and forth, which is indeed challenging. But friends who have kept up with the rhythm along the way have already enjoyed some gains at the start of the new year.
Trading has never been about making pretty post-mortem analyses, but about having the courage to set the direction and execute it in the moment. No matter how much you analyze verbally, nothing is more convincing than solid, practical actions.
We can't control how the market changes, but maintaining your own rhythm and taking each step steadily is the key. If you choose the right path, tim
View OriginalTrading has never been about making pretty post-mortem analyses, but about having the courage to set the direction and execute it in the moment. No matter how much you analyze verbally, nothing is more convincing than solid, practical actions.
We can't control how the market changes, but maintaining your own rhythm and taking each step steadily is the key. If you choose the right path, tim

- Reward
- like
- Comment
- Repost
- Share
Gold today was right on point. Keep up with the trend, find your own rhythm, and the results will give you the answer!
#美国以色列突袭伊朗BTC短线跳水 #特朗普下令停用AnthropicAI产品 #深度创作营
View Original#美国以色列突袭伊朗BTC短线跳水 #特朗普下令停用AnthropicAI产品 #深度创作营
- Reward
- like
- Comment
- Repost
- Share
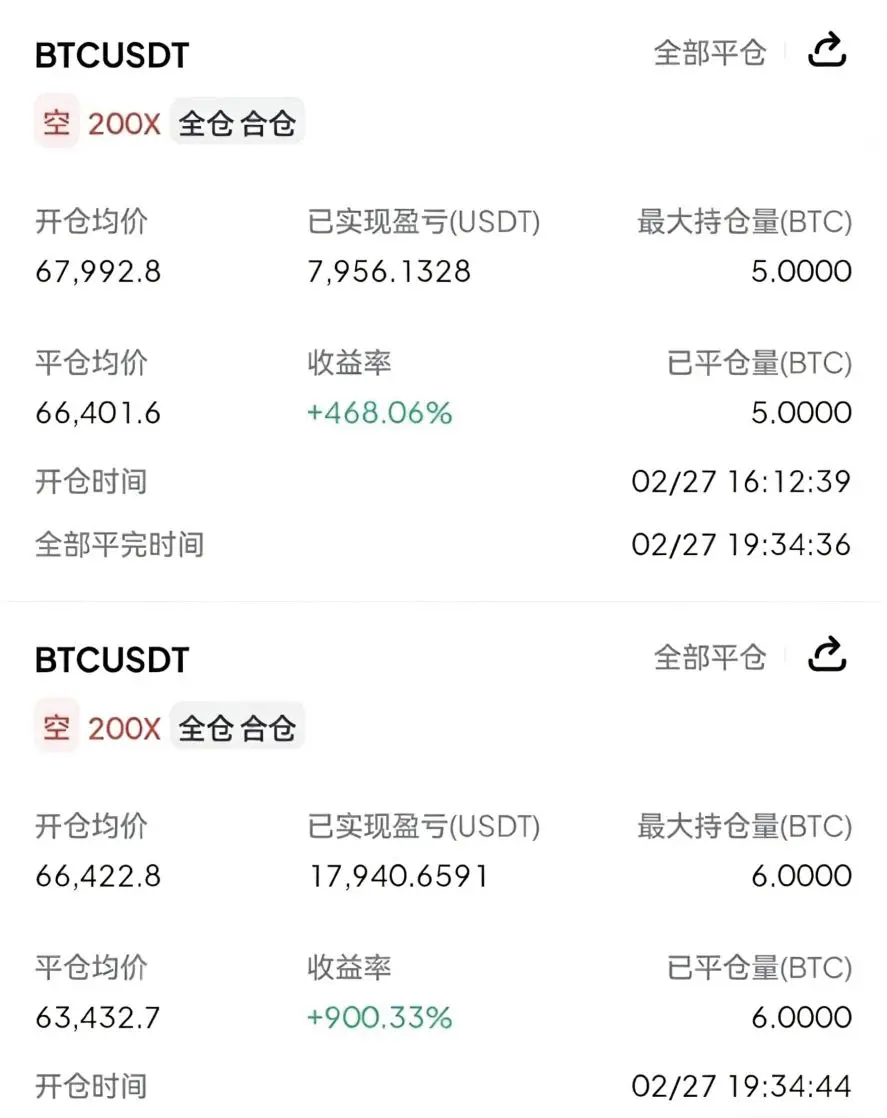
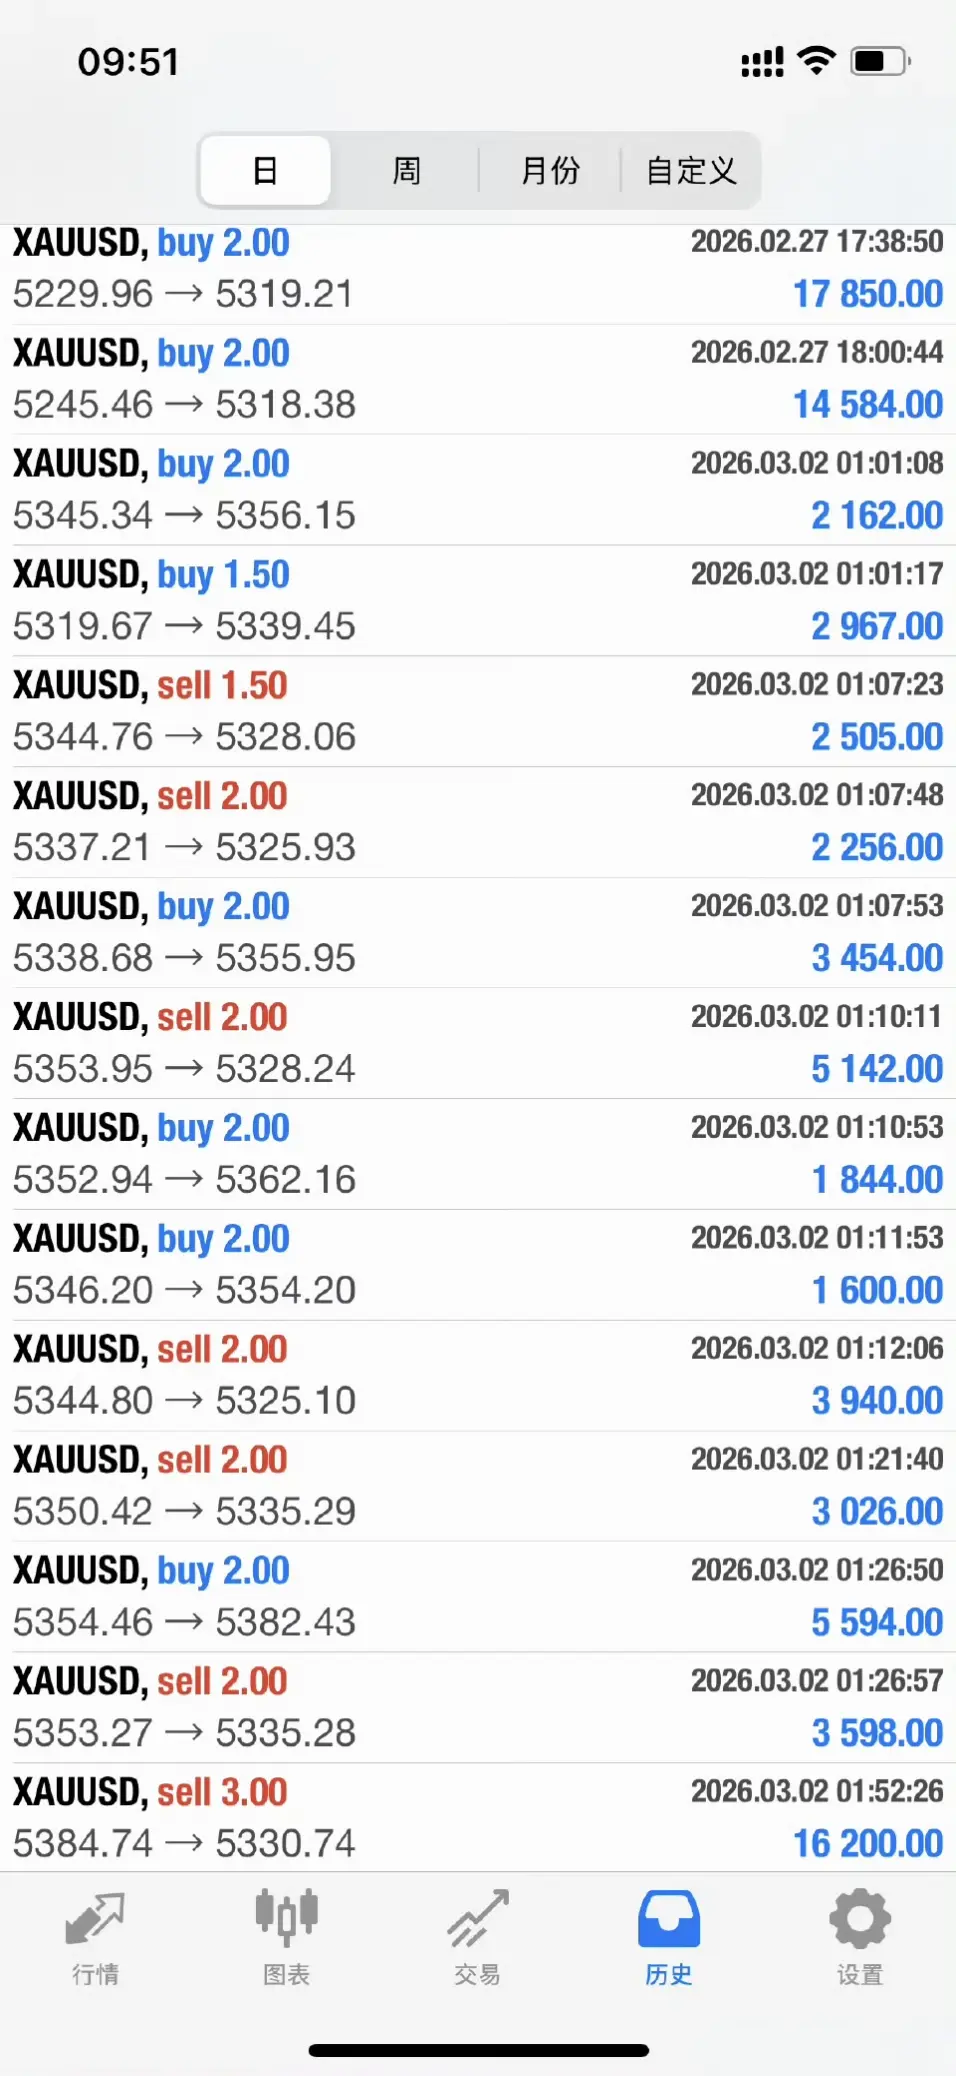
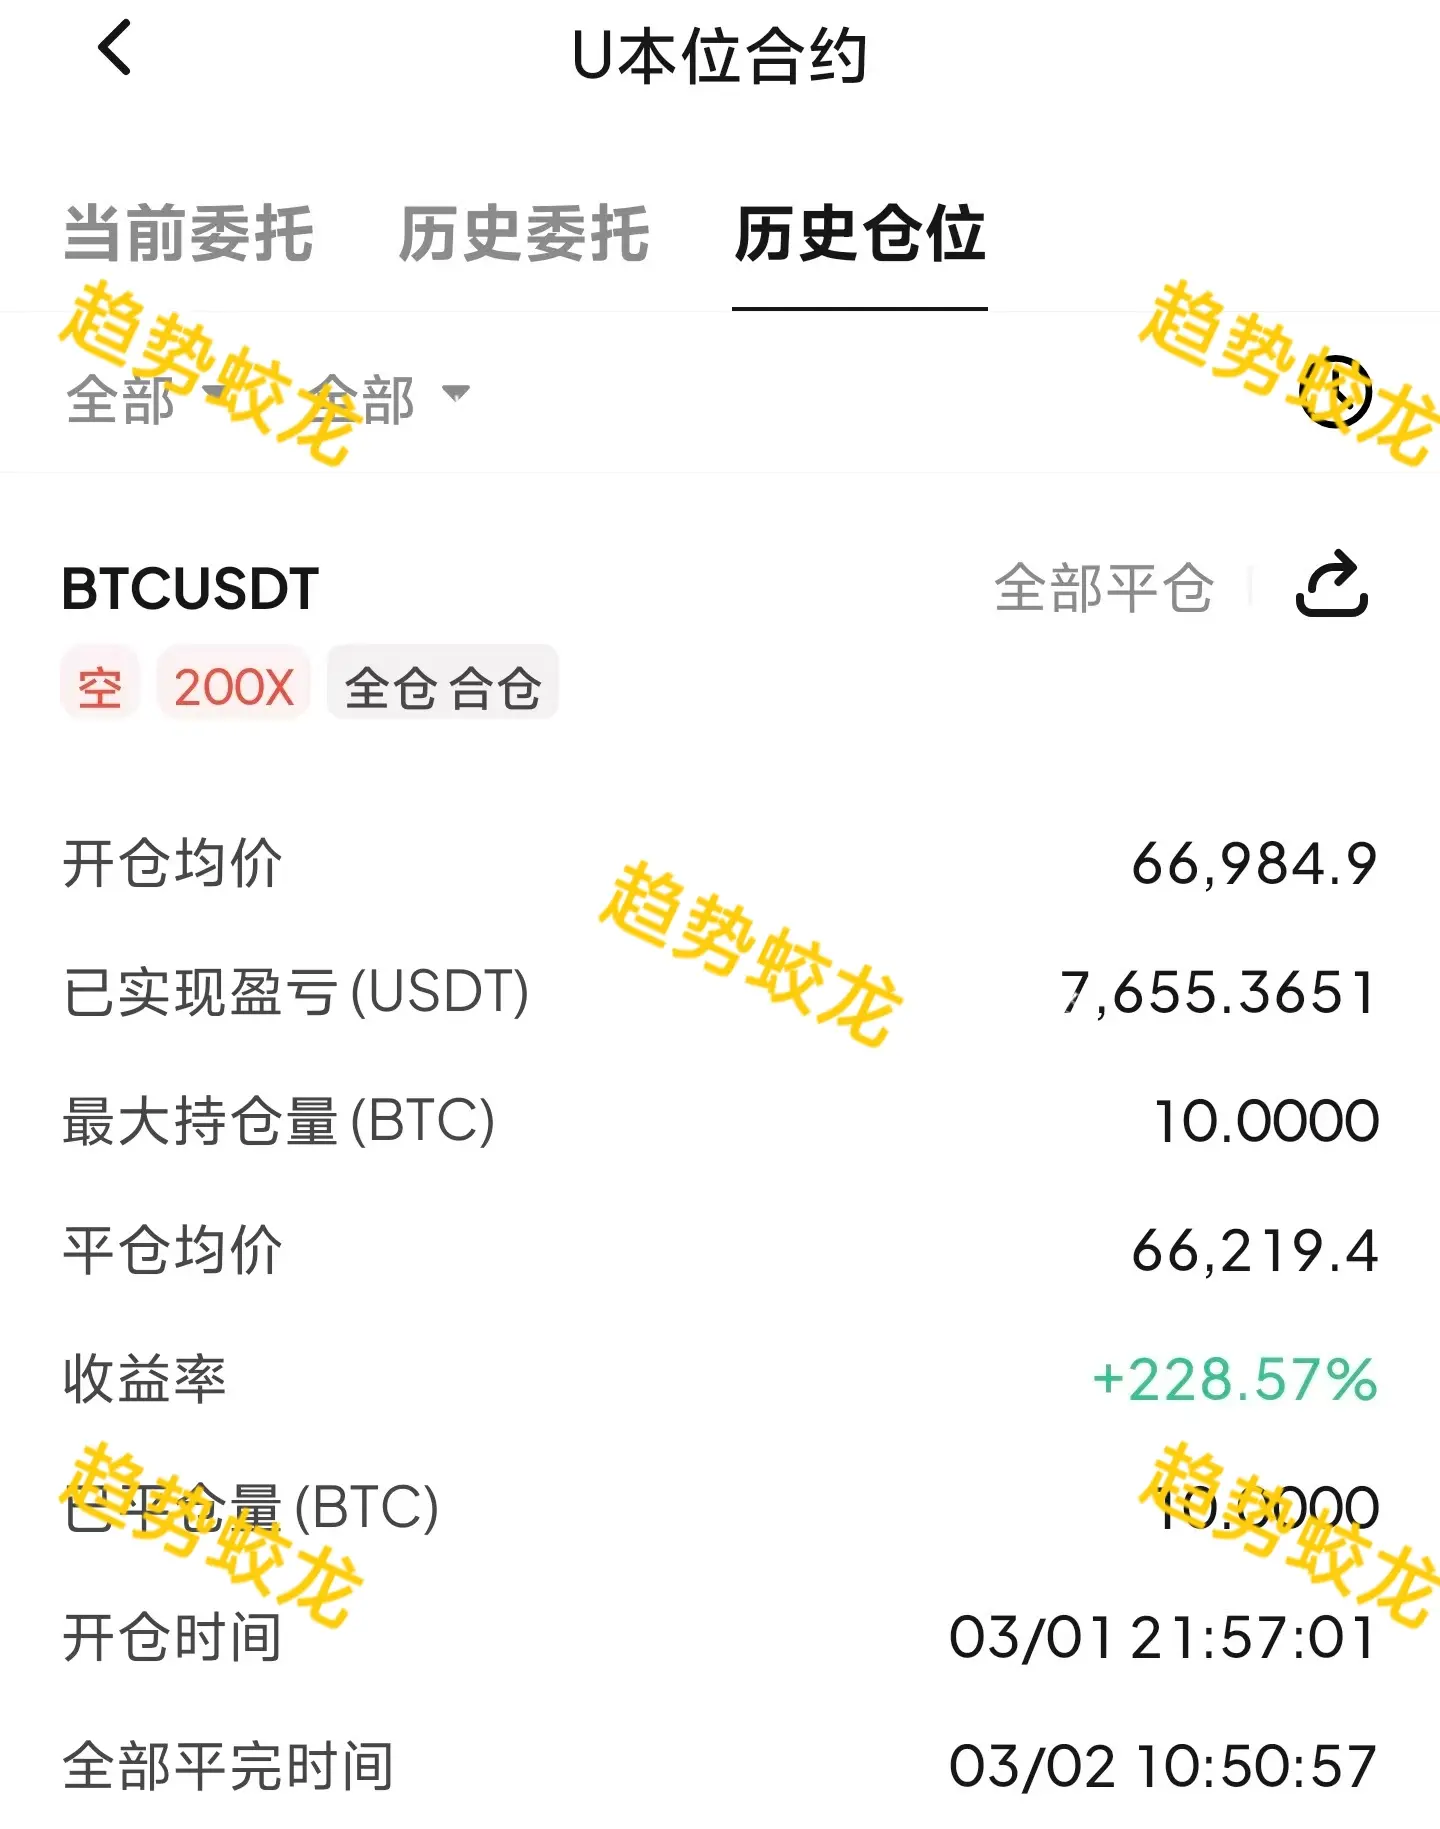
A wave of long-term positions has been implemented, with Luodai at 7,600 oil, yielding a 2.2x return.
Although it's not the highest point, life is full of setbacks, and who can always pinpoint the exact top?$BTC $ETH #美国以色列突袭伊朗BTC短线跳水
View OriginalAlthough it's not the highest point, life is full of setbacks, and who can always pinpoint the exact top?$BTC $ETH #美国以色列突袭伊朗BTC短线跳水
- Reward
- 1
- Comment
- Repost
- Share
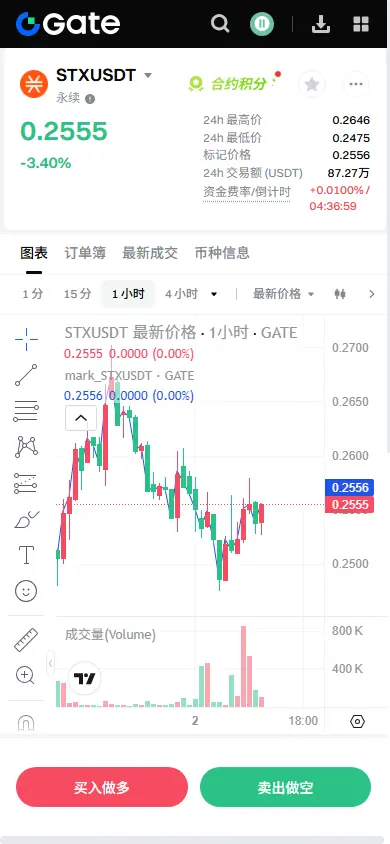
【$STX Signal】Pullback to Long + 1H Level Bottoming Rebound
$STX The 1H level has formed a double bottom structure around 0.252, and the price is attempting to stabilize above the EMA20(0.2548). Although the 4H cycle is in a downtrend channel, the latest candlestick closed bullish, and the buying volume ratio(0.56) has increased, indicating weakening short-term selling pressure and a technical rebound demand.
🎯Direction: Long (Long)
⚡Entry/Order: 0.2528 - 0.2541
🛑Stop Loss: 0.2495
🚀Target 1: 0.2590
🚀Target 2: 0.2630
🛡️Trade Management:
- Execution Strategy: After reaching Target 1, reduce
View Original$STX The 1H level has formed a double bottom structure around 0.252, and the price is attempting to stabilize above the EMA20(0.2548). Although the 4H cycle is in a downtrend channel, the latest candlestick closed bullish, and the buying volume ratio(0.56) has increased, indicating weakening short-term selling pressure and a technical rebound demand.
🎯Direction: Long (Long)
⚡Entry/Order: 0.2528 - 0.2541
🛑Stop Loss: 0.2495
🚀Target 1: 0.2590
🚀Target 2: 0.2630
🛡️Trade Management:
- Execution Strategy: After reaching Target 1, reduce
- Reward
- like
- Comment
- Repost
- Share
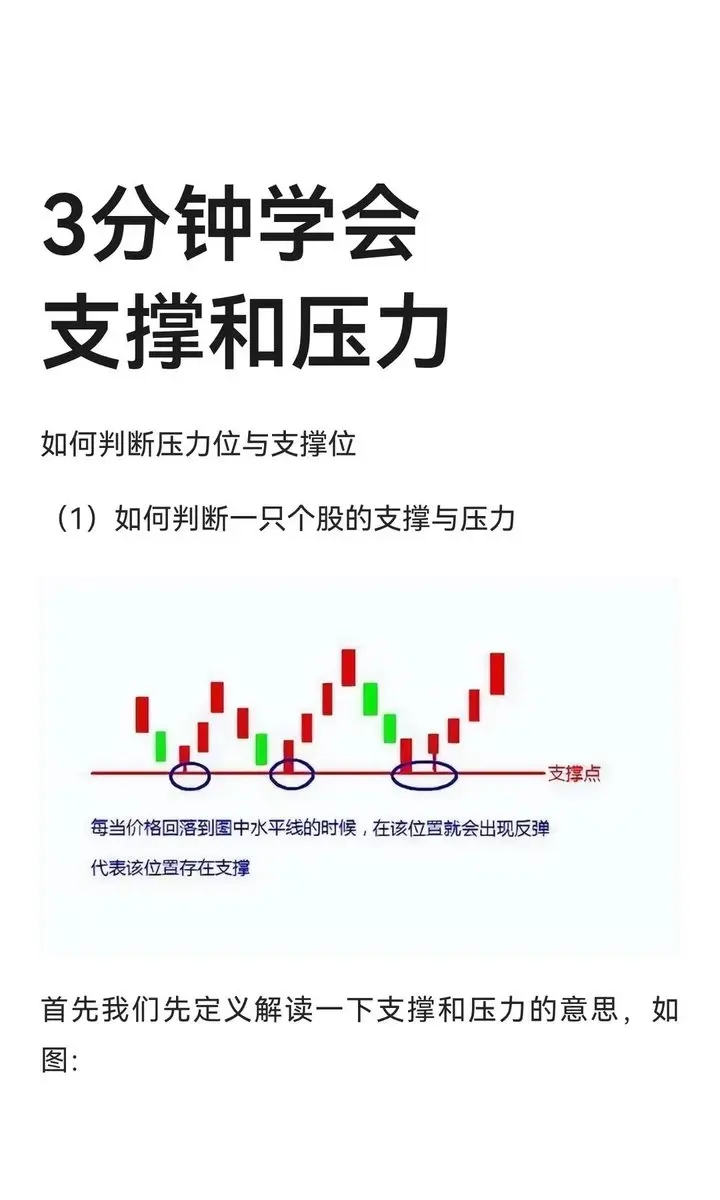
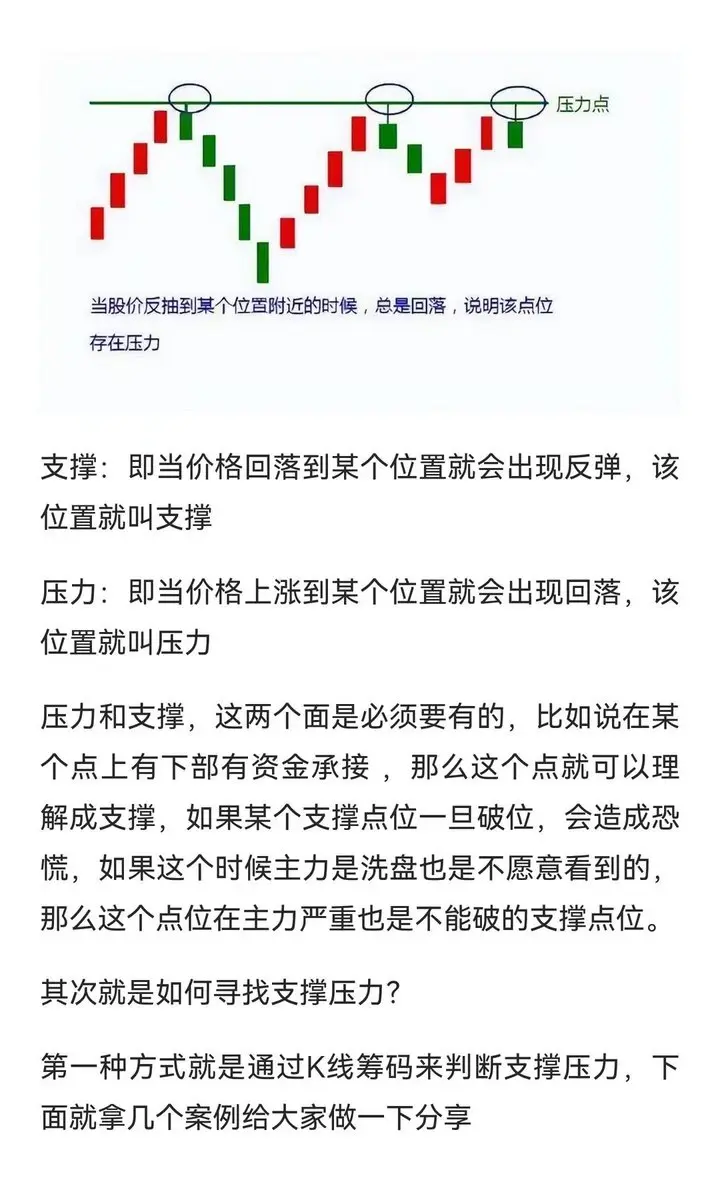
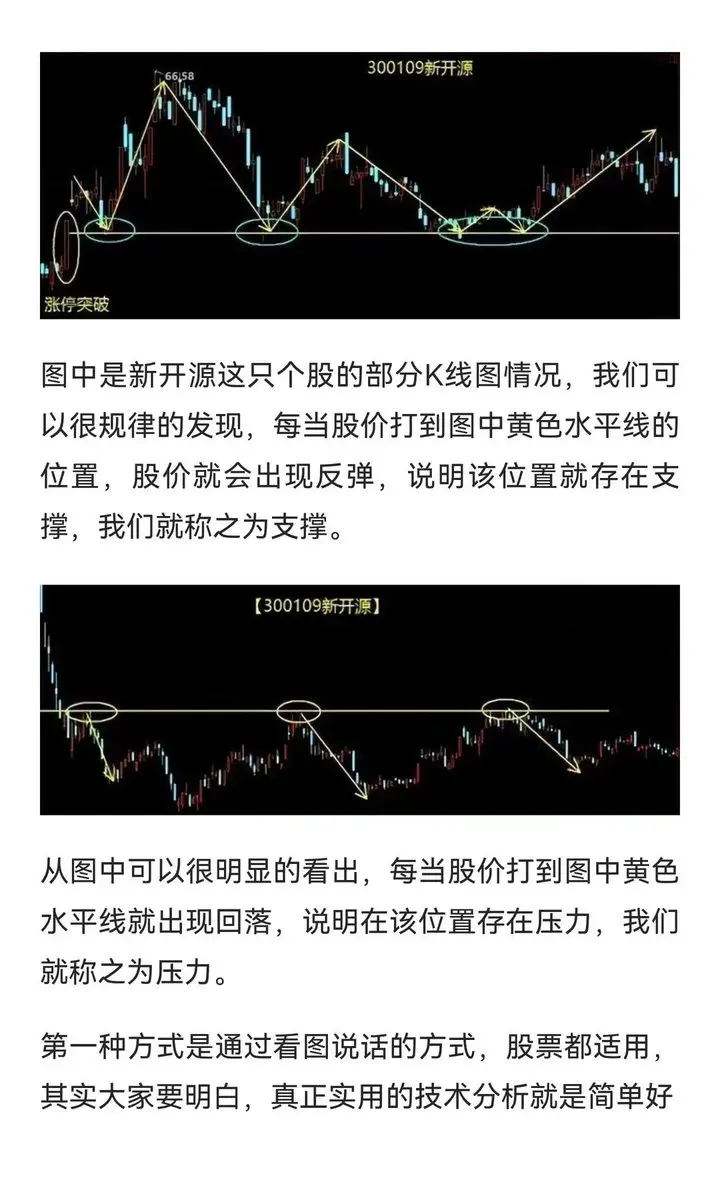
Learn Support and Resistance in 3 Minutes
Determine support and resistance through candlestick chips and moving averages. In candlestick charts, a rebound after the stock price falls to a certain level indicates support; a pullback after the price rises to a certain level indicates resistance. In moving averages, the 5-day moving average assesses short-term strength, the 13-day moving average represents the main force's average price, standing firm as support, and breaking below as resistance.
View OriginalDetermine support and resistance through candlestick chips and moving averages. In candlestick charts, a rebound after the stock price falls to a certain level indicates support; a pullback after the price rises to a certain level indicates resistance. In moving averages, the 5-day moving average assesses short-term strength, the 13-day moving average represents the main force's average price, standing firm as support, and breaking below as resistance.

- Reward
- like
- Comment
- Repost
- Share
宇宙所
宇宙所
Created By@BitebiAi0com
Subscription Progress
0.00%
MC:
$0
More Tokens
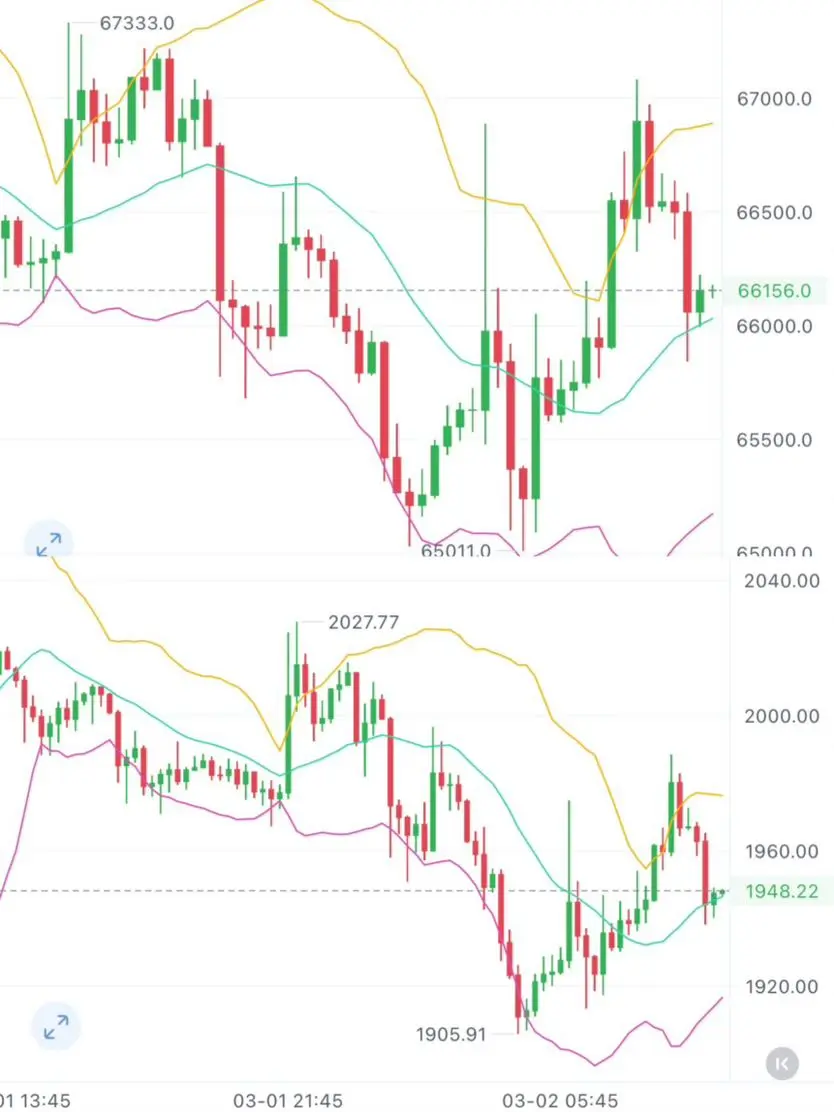
March 2 Cryptocurrency Market Analysis & Strategy
📉 BTC Bitcoin:
After bottoming out near 65,000 in the short term, it has rebounded strongly and is currently trading above the middle band of the Bollinger Bands. 66,800 is a key short-term resistance level; a breakout may test the 67,300 range. If it falls back and breaks below 65,800, it will test the 65,000 support level.
⚡ ETH Ethereum:
Rebounding in tandem with the market, with 1,950 as the core resistance level. Holding above this level may test 1,980; if it falls below 1,920, the short-term trend will weaken again, and it may test the 1
View Original📉 BTC Bitcoin:
After bottoming out near 65,000 in the short term, it has rebounded strongly and is currently trading above the middle band of the Bollinger Bands. 66,800 is a key short-term resistance level; a breakout may test the 67,300 range. If it falls back and breaks below 65,800, it will test the 65,000 support level.
⚡ ETH Ethereum:
Rebounding in tandem with the market, with 1,950 as the core resistance level. Holding above this level may test 1,980; if it falls below 1,920, the short-term trend will weaken again, and it may test the 1
- Reward
- like
- Comment
- Repost
- Share
Notification
Key milestones this week
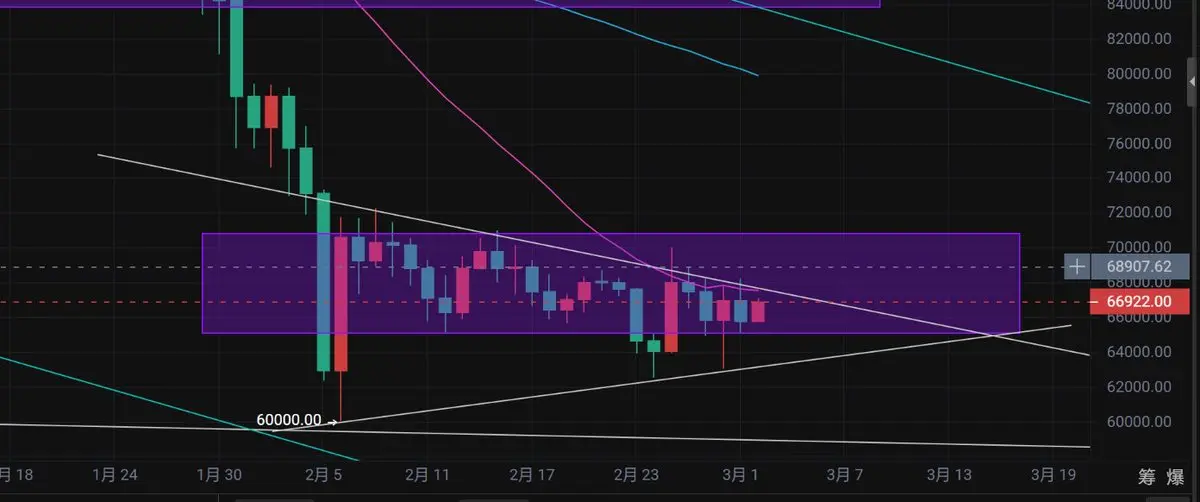
The triangle consolidation area for Bitcoin and Ethereum is also nearing the end
It’s not appropriate to keep bouncing up and down here
The trend reversal point on the 3-day chart for Bitcoin and Ethereum is also approaching
The breakout is expected this week
From a technical pattern perspective
The upper trendline has been touched multiple times
The lower trendline has been touched less often and only by a needle
Each time resistance is touched, it diminishes slightly
With so many touches on the upper resistance, it should have decreased significantly
Add
View OriginalKey milestones this week
The triangle consolidation area for Bitcoin and Ethereum is also nearing the end
It’s not appropriate to keep bouncing up and down here
The trend reversal point on the 3-day chart for Bitcoin and Ethereum is also approaching
The breakout is expected this week
From a technical pattern perspective
The upper trendline has been touched multiple times
The lower trendline has been touched less often and only by a needle
Each time resistance is touched, it diminishes slightly
With so many touches on the upper resistance, it should have decreased significantly
Add
- Reward
- like
- Comment
- Repost
- Share
Fabric Foundation and $ROBO: Smart Automation Driving the New Web3 Infrastructure
The evolution of the Web3 ecosystem is marked by projects aiming to automate processes and optimize interactions between users, data, and blockchain. In this context, Fabric Foundation positions itself as an initiative focused on building decentralized infrastructure capable of powering intelligent and scalable applications within the modern digital environment.
Through Fabric, technological development is directed toward creating solutions that integrate automation, operational efficiency, and community governan
ROBO4,28%


- Reward
- like
- 1
- Repost
- Share
GateUser-88aceaf8:
Good luck and prosperity 🧧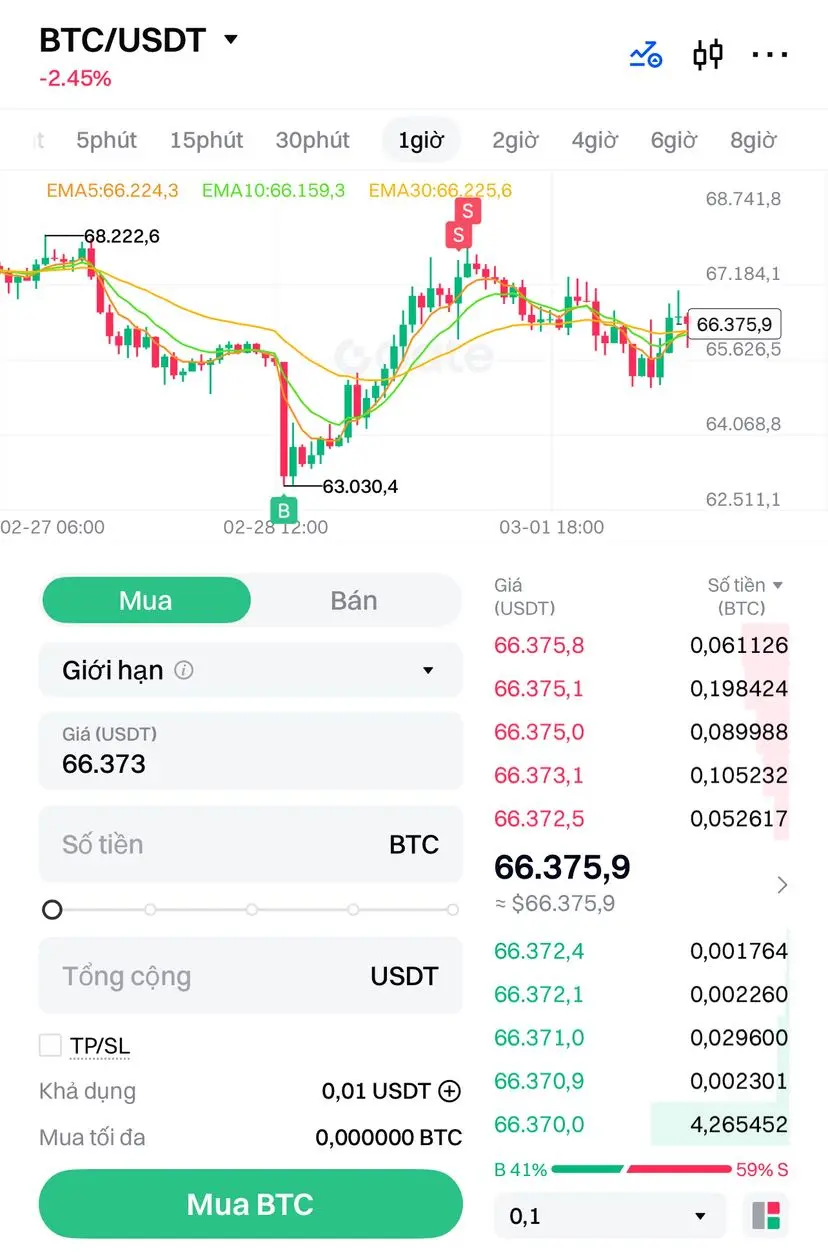
- Reward
- 1
- Comment
- Repost
- Share
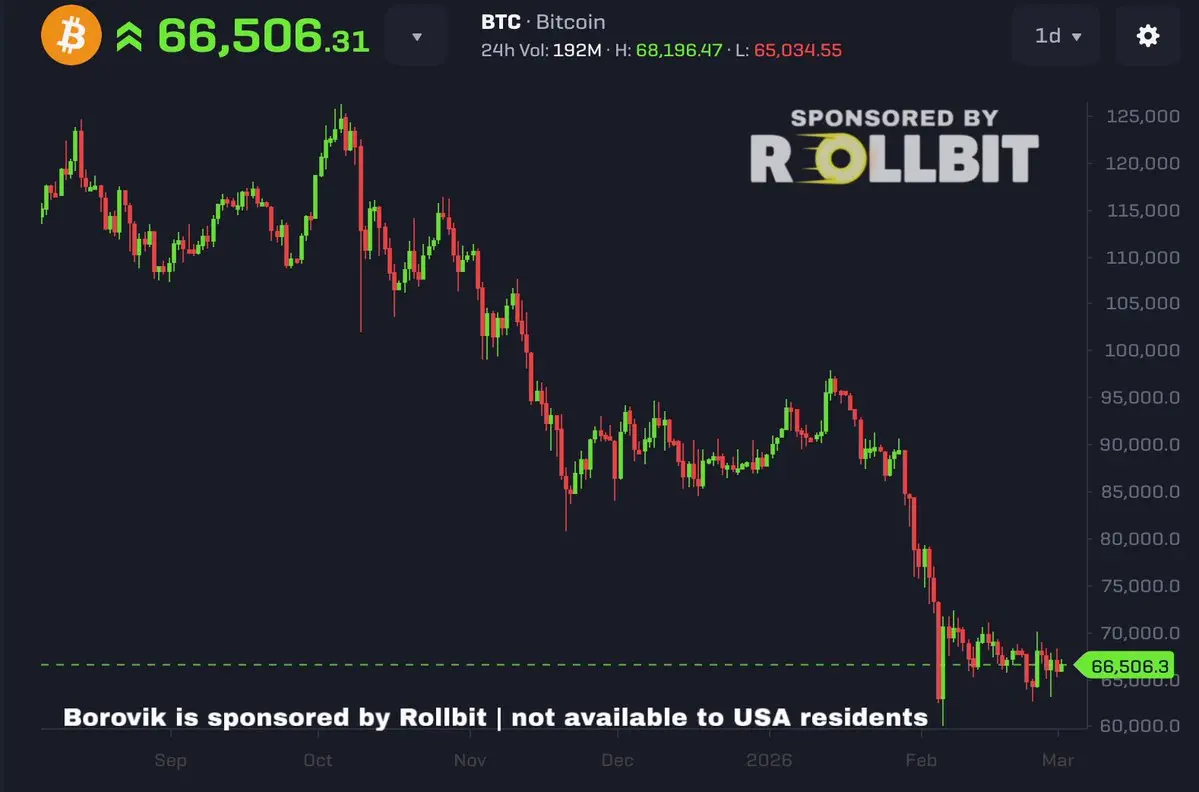
Bitcoin is sitting at a comfy $66,000 right now
6 months ago, BTC was sitting at $126,000
That’s nearly 8x higher than the 2022 lows
If BTC even does HALF (4x) from the current $60k bottom, that puts BTC at $240k
$240,000 is my target for this coming cycle
6 months ago, BTC was sitting at $126,000
That’s nearly 8x higher than the 2022 lows
If BTC even does HALF (4x) from the current $60k bottom, that puts BTC at $240k
$240,000 is my target for this coming cycle
BTC-1,2%
- Reward
- like
- Comment
- Repost
- Share
#BuyTheDipOrWaitNow?
I'm not going to be able to get to work tomorrow so I don't think so if you want to get to work tomorrow so I can get to work tomorrow so I can
I'm not going to be able to get to work tomorrow so I don't think so if you want to get to work tomorrow so I can get to work tomorrow so I can


- Reward
- like
- Comment
- Repost
- Share
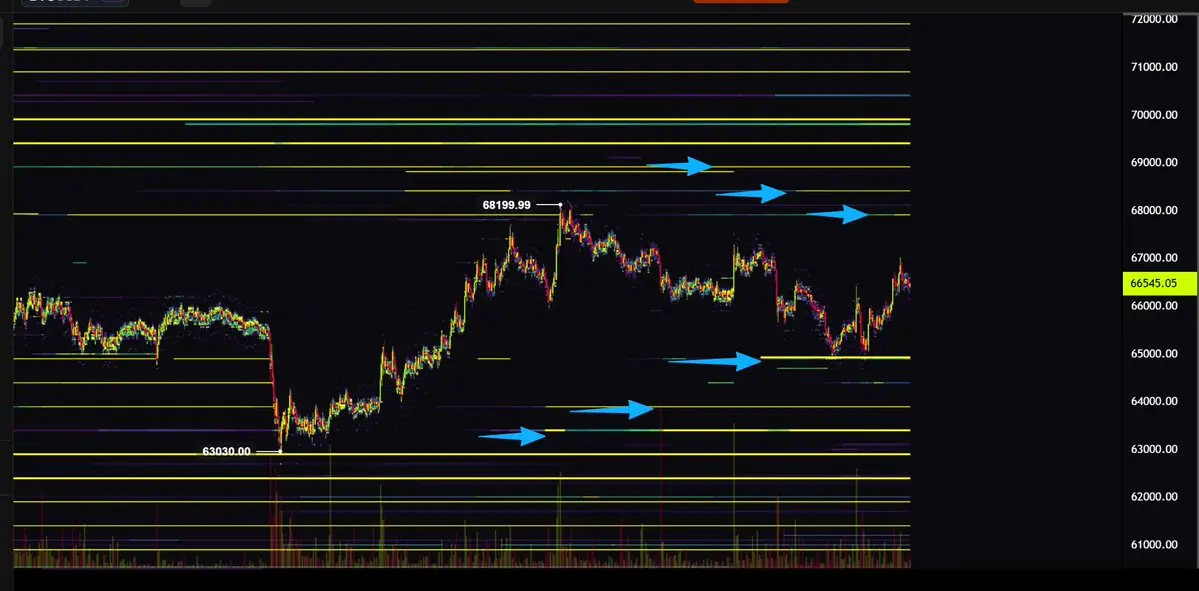
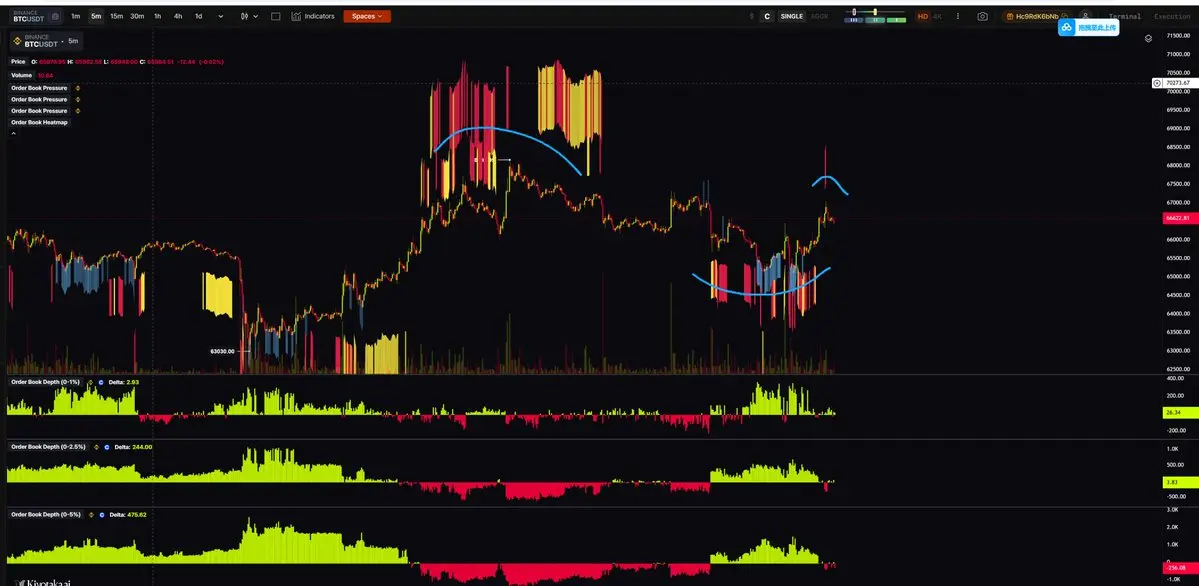
The price has been compressed into an increasingly narrow range by the spot orders (65k~68k)).
Basically, any fluctuation in either direction will enter the imbalance zone.
We need spot market liquidity to push and select a direction...
Not sure if there will be action during the Asian session, if not, then wait for the US session in the evening..
View OriginalBasically, any fluctuation in either direction will enter the imbalance zone.
We need spot market liquidity to push and select a direction...
Not sure if there will be action during the Asian session, if not, then wait for the US session in the evening..
- Reward
- like
- Comment
- Repost
- Share
Load More
Join 40M users in our growing community
⚡️ Join 40M users in the crypto craze discussion
💬 Engage with your favorite top creators
👍 See what interests you
Trending Topics
View More42.48M Popularity
168.89K Popularity
154.78K Popularity
1.68M Popularity
534.12K Popularity
Hot Gate Fun
View More- MC:$2.37KHolders:10.00%
- MC:$0.1Holders:10.00%
- MC:$2.38KHolders:10.00%
- MC:$2.43KHolders:20.14%
- MC:$2.38KHolders:10.00%
News
View MoreUniswap Founder: The Financial System Must Always Remain Operational and Accessible
7 m
Analysis: Bitcoin technical indicators show a death cross, previously warning of the "final market decline" in earlier cycles.
10 m
KNC (Kyber Network Crystal v2) up 17.99% in the last 24 hours
12 m
Traditional Finance Alert: VIX Increased by Over 4.5%
14 m
A user opened a 40x short position on BTC when the market declined on February 28th and is now holding 750 BTC.
25 m
Pin