
Key Takeaways
-
Near Protocol (NEAR) is gaining momentum, with price up nearly 18% over the past 30 days.
-
The daily chart shows a well-defined inverse head and shoulders pattern, signaling a potential bullish reversal.
-
NEAR is consolidating just below a key neckline resistance zone between $1.79 and $1.88.
-
Reclaiming the 100-day moving average near $1.96 would strengthen the bullish breakout case.
-
A confirmed breakout could open the door toward the $2.36 upside target.
-
Failure to hold above the $1.65 support zone may lead to further consolidation and delay the bullish setup.
The cryptocurrency market’s AI narrative has been gaining renewed traction, and Near Protocol (NEAR) is emerging as one of the standout performers. Over the past 30 days, NEAR has surged nearly 18%, and beyond the price action, the project continues to strengthen fundamentally.
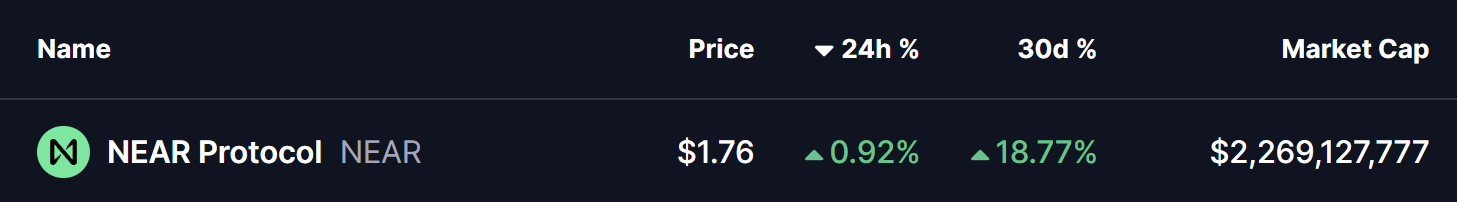
Source: Coinmarketcap
NEAR currently ranked as the third most active blockchain by 38.9 monthly users, trailing only BNB Chain and Solana — a signal that on-chain usage and developer activity remain strong.
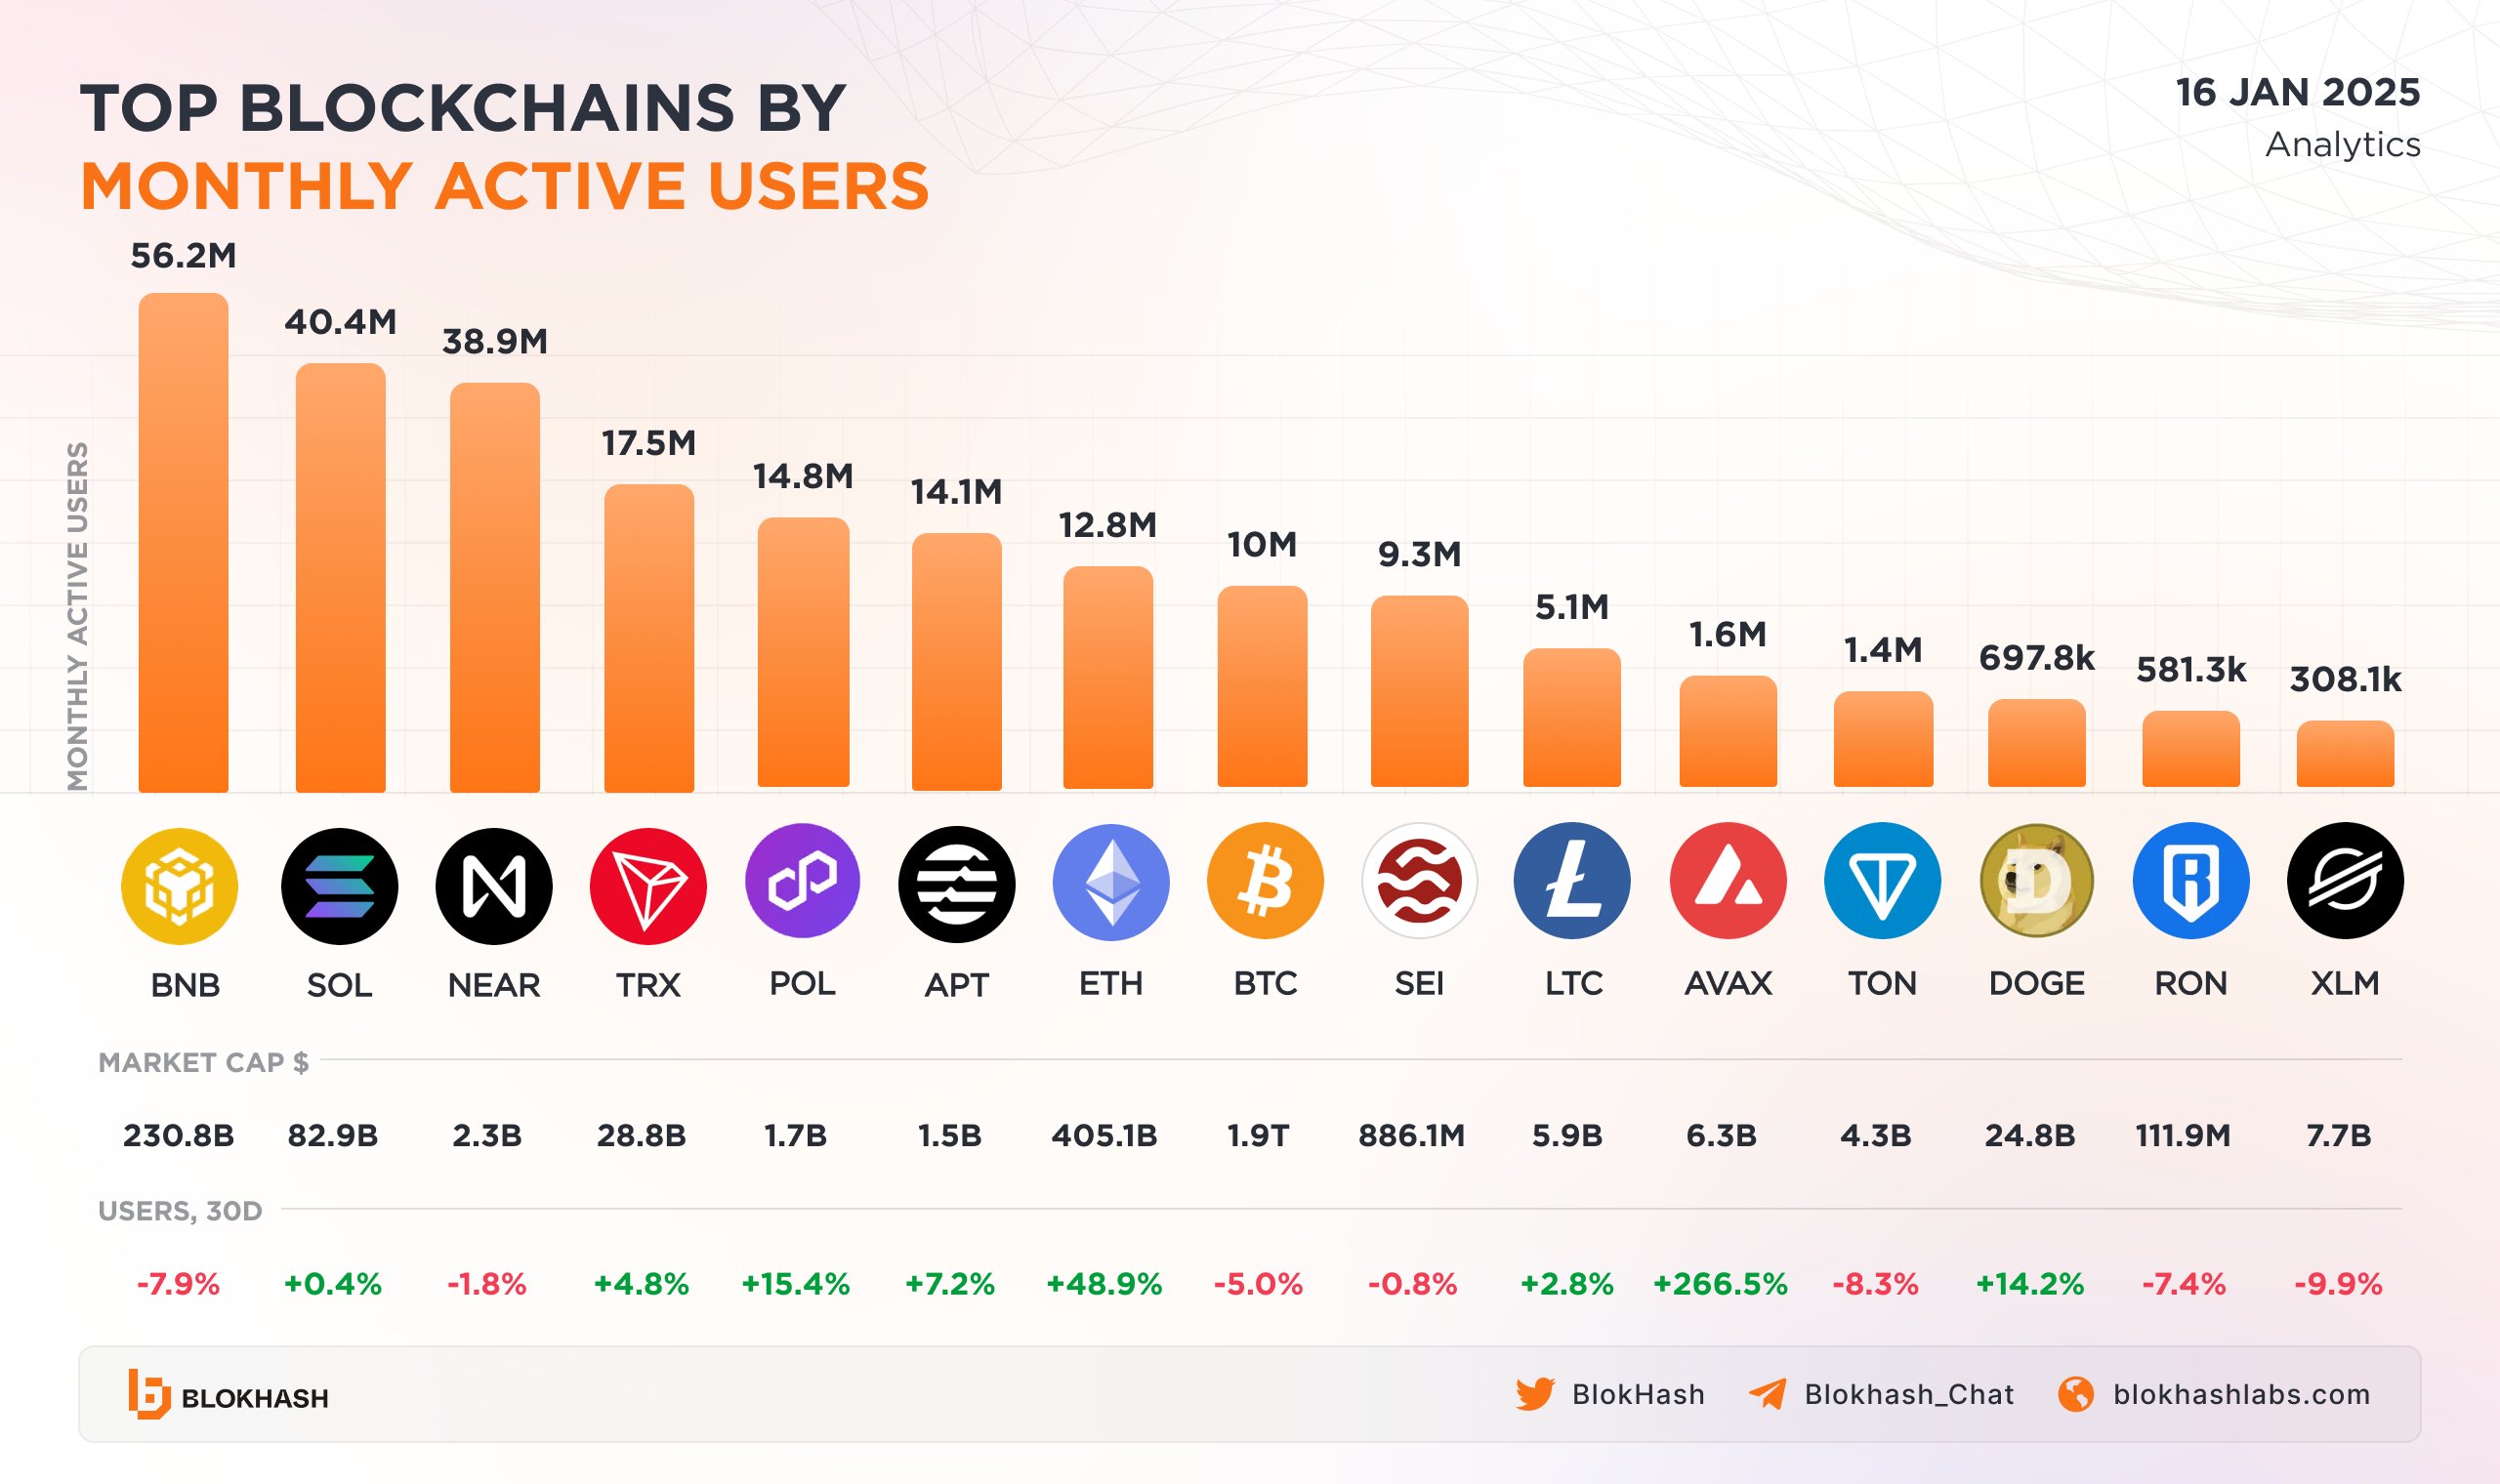
Top 10 Blockchains By Active Users/Source: @BlokHash (X)
More importantly, the daily chart is now revealing a classic bullish reversal structure, suggesting that NEAR could be positioning itself for a meaningful upside continuation.
Inverse Head and Shoulders Pattern Takes Shape
On the daily timeframe, NEAR has formed a well-defined inverse head and shoulders pattern, a setup widely regarded as one of the most reliable bullish reversal formations in technical analysis.
-
The left shoulder developed in early December near the $1.65 region, where selling pressure temporarily paused.
-
This was followed by a deeper decline toward the $1.45 area, forming the head, as broader market weakness weighed on price.
-
The right shoulder then emerged as NEAR once again found support near $1.65, signaling that sellers were losing control.
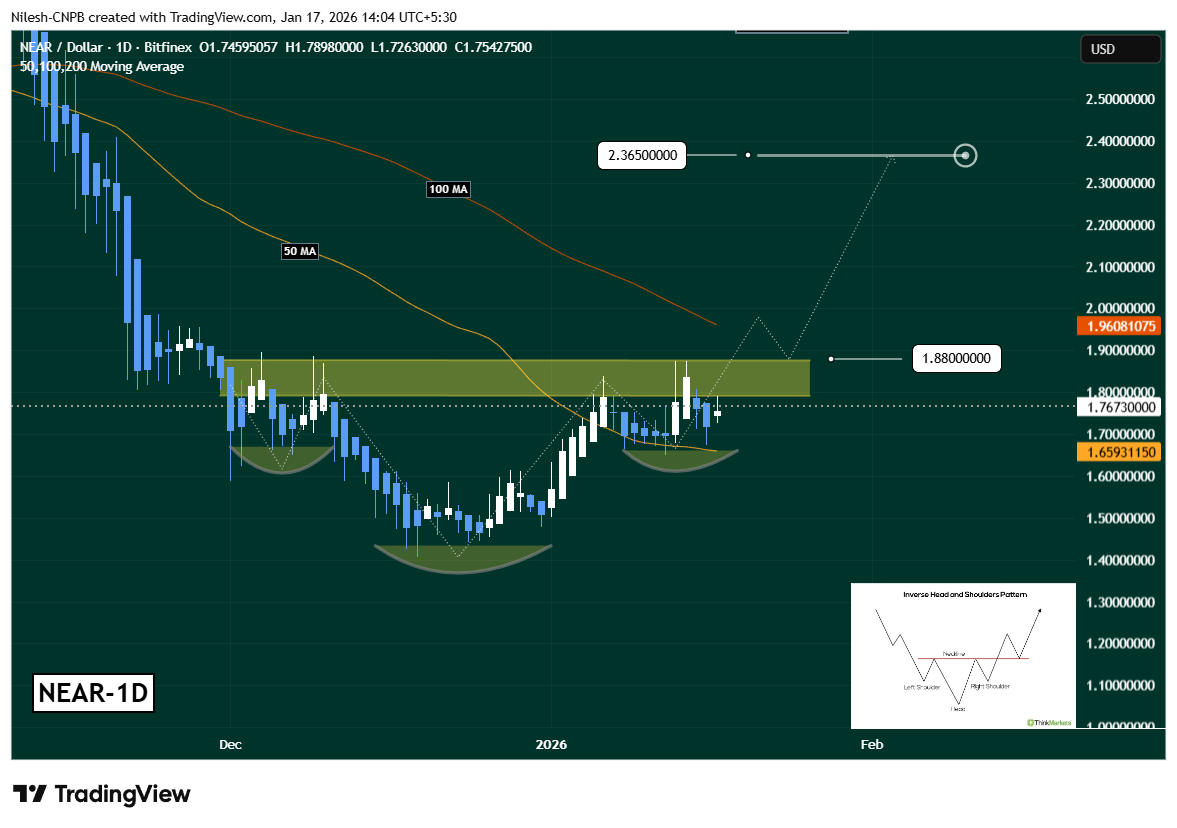
Near Protocol (NEAR) Daily Chart/Coinsprobe (Source: Tradingview)
Since completing this structure, NEAR has rebounded steadily and successfully reclaimed the 50-day moving average, which is now acting as dynamic support. At present, price is consolidating just below a key neckline resistance zone between $1.79 and $1.88, clearly highlighted on the chart.
This compression near resistance often precedes a volatility expansion, suggesting that a decisive move could be approaching.
What’s Next for NEAR?
For bullish momentum to gain confirmation, NEAR needs a strong daily close above the $1.79–$1.88 neckline, ideally followed by a successful retest of this zone as support. Such a move would validate the inverse head and shoulders breakout and confirm a shift in short-term market structure.
Additional strength would come from reclaiming the 100-day moving average near $1.96, which has capped price during the recent downtrend. A break above this level could accelerate upside momentum as sidelined buyers step back in.
If these conditions are met, the measured move projection from the inverse head and shoulders pattern points toward the $2.36 region, representing a potential upside of roughly 26% from the breakout area.
On the downside, failure to clear the neckline could lead to further consolidation. In that scenario, holding above the 50-day moving average and the $1.65 support zone will be crucial to keep the bullish structure intact. A loss of these levels would delay the breakout thesis and shift focus back to range-bound price action.
Bottom Line
NEAR Protocol appears to be coiling beneath resistance, supported by a textbook bullish reversal pattern and improving broader sentiment. While confirmation is still needed, the technical structure suggests accumulation rather than distribution, with buyers gradually gaining control.
Disclaimer: The views and analysis presented in this article are for informational purposes only and reflect the author’s perspective, not financial advice. Technical patterns and indicators discussed are subject to market volatility and may or may not yield the anticipated results. Investors are advised to exercise caution, conduct independent research, and make decisions aligned with their individual risk tolerance.
About Author: Nilesh Hembade is the Founder and Lead Author of Coinsprobe, with over 5 years of experience in the cryptocurrency and blockchain industry. Since launching Coinsprobe in 2023, he has been providing daily, research-driven insights through in-depth market analysis, on-chain data, and technical research.
Disclaimer: The information on this page may come from third parties and does not represent the views or opinions of Gate. The content displayed on this page is for reference only and does not constitute any financial, investment, or legal advice. Gate does not guarantee the accuracy or completeness of the information and shall not be liable for any losses arising from the use of this information. Virtual asset investments carry high risks and are subject to significant price volatility. You may lose all of your invested principal. Please fully understand the relevant risks and make prudent decisions based on your own financial situation and risk tolerance. For details, please refer to
Disclaimer.
Related Articles
Market defensive sentiment is intensifying! K33: “Shorting the Bitcoin ETF” positions are approaching a new high
K33’s research report indicates that the Bitcoin market is in a high-alert state due to weak coin prices, geopolitical risks, and threats from quantum computing, leading to a sharp increase in short positions. Vetle Lunde notes that persistently negative funding rates continue to reflect the market being overly crowded, which could signal that a turnaround may be on the way. At the same time, trading volume and volatility typically decline during holidays, affecting market liquidity.
区块客20m ago
Is not buying the biggest risk? Wall Street realizes: Bitcoin’s “this” has completely changed…
Bitcoin’s market structure is steadily maturing; its pullback magnitude has already dropped to about 50%, indicating that it is shifting from a “speculative toy” to a stable asset class. Analysts believe that institutional investors are starting to view Bitcoin as a portfolio optimizer rather than a high-risk wager. Although expected returns may normalize, historical data shows that Bitcoin’s long-term performance still outpaces other assets.
区块客24m ago
Bitcoin ETF ends a 4-month outflow streak! In March, it attracts $1.3 billion, returning to net inflows
According to SoSoValue data, the 12 U.S.-listed Bitcoin spot ETFs saw net inflows of $1.32 billion in March, ending four consecutive months of outflows. Bitcoin had previously been divested due to extreme price volatility, but as capital returned, market momentum began to shift, and ETF holdings also started to rise again.
区块客29m ago
XRP Surpasses BNB Amid Altcoin Crash, BTC Price Dropped by $3K: Market Watch
Bitcoin experienced a decline to just over $66,000 after being rejected at $69,200, influenced by geopolitical tensions. Altcoins, including Ethereum and Solana, also fell, while XRP surpassed BNB in market cap. The total crypto market cap dropped significantly but has since rebounded.
CryptoPotato1h ago
Trump says the Strait of Hormuz will be “naturally open,” and risk-averse sentiment in the market is heating up
In his remarks, Trump said that the U.S. military would complete its strategic mission against Iran, prompting a cautious reaction in the markets. Brent crude oil prices rose, stocks fell, and risk-averse sentiment intensified. Iran has taken a hardline stance and clearly demanded a toll payment; the situation remains unclear, and geopolitical risks may continue to affect the markets.
GateNews1h ago
The truth behind Circle’s stock price plunge is revealed: regulatory repricing + intensified competition, the stablecoin landscape is changing
Circle (CRCL) stock price continues to weaken, affected by multiple factors such as regulatory repricing and others. At the same time, market participants are re-evaluating its profitability as Tether’s market expansion intensifies competition and impacts Circle’s market share. Profit-taking and strategic de-risking have led to price volatility, reflecting deeper changes in the crypto industry; the market is gradually shifting toward fundamentals-driven dynamics.
GateNews1h ago
