
The JasmCoin (JASMY) price had a great week, rising by 44.57% and reaching a two-month high of $0.0101 due to some futures market speculation and whale accumulation, according to Bankless Times. However, traders’ profit-taking caused a small decline on the last day.
The JASMY price is catching its breath after its strong rally, and honestly, this cooldown looks more like healthy consolidation than weakness.
While exchange supply is at a record low of 7.99M JASMY, there has been net selling over buying by 45M units in key trading sessions.
Rather than breaking down, the JASMY price has slipped into a tight consolidation – a healthy cooldown that’s holding firm without giving up any important ground. Right now, JASMY is sitting nicely above support, which means its overall bullish setup is still in place.
What the JASMY Chart Is Showing
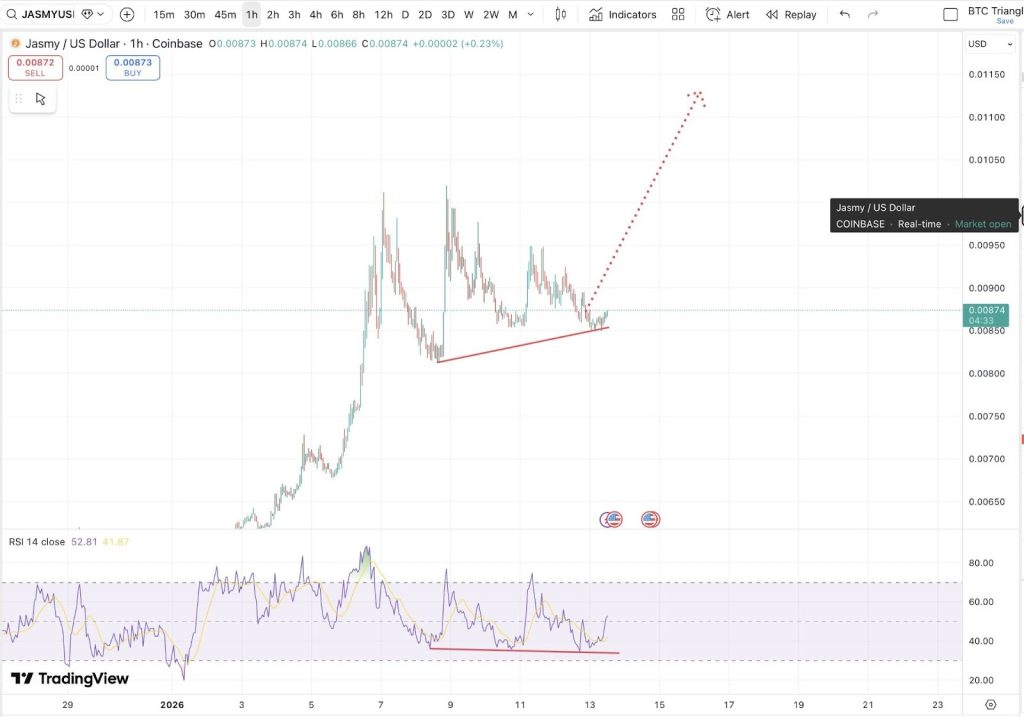
Looking at the chart, the dips have been pretty mild, with higher lows stacking up along that rising trendline. That kind of price action usually indicates that buyers are coming in early and are not waiting for deeper dips.
The consolidation looks orderly, and this more often than not is a signal of accumulation rather than distribution. An interesting clue is showing up in the RSI – analyst Matthew Dixon points out on X that the JASMY price is still holding its RSI support after the latest push higher.
Even as the price moves sideways, the RSI reflects a hidden bullish divergence – a setup that in many cases presages underlying strength and the potential for continuation once consolidation has ended.
_ Source: X/Matthew Dixon_
What comes next for JASMY
As far as JasmyCoin is concerned, there appears to be somewhat of a mixed sentiment surrounding this token.
On the positive side, the bulls are looking at accumulation patterns as well as the robotic aspect associated with this cryptocurrency as positives. On the negative side, the bears are looking at derivative weakness as well as fatigue on the charts as negatives.
The level to keep an eye on is the support area at $0.0085-$0.0090. If the JASMY price manages to hold this area, it could place more emphasis on the breakout play. However, if it falls below, we could see the orderly unwinds come into play.”
The important question for now is whether JASMY can keep this structure going. While price is holding above its rising support and RSI is supported, the setup favors another push higher rather than a deeper retracement.
While short-term chop is still possible, the current chart suggests that this pause could be simply the market resetting for the next leg up.
_****SUI Price Is Back at a Familiar Level That Fueled Rallies: Here’s What Must Happen First**
Disclaimer: The information on this page may come from third parties and does not represent the views or opinions of Gate. The content displayed on this page is for reference only and does not constitute any financial, investment, or legal advice. Gate does not guarantee the accuracy or completeness of the information and shall not be liable for any losses arising from the use of this information. Virtual asset investments carry high risks and are subject to significant price volatility. You may lose all of your invested principal. Please fully understand the relevant risks and make prudent decisions based on your own financial situation and risk tolerance. For details, please refer to
Disclaimer.
Related Articles
Chainlink price stuck at $9 – But a $14.8 million buy by a major investor raises many questions
Chainlink (LINK) has maintained a narrow trading range between $8.5 and $9.9 throughout the week, with the $9.9 level continuing to act as a significant resistance. At the time of writing, the price is trading around $9.2, up slightly by 1.23% on the daily timeframe.
However, trading volume has dropped sharply by 32% to a level of
TapChiBitcoin10m ago
Bitcoin Shows Bearish Signals While Market Onlookers Say Bottom Remains Far Off
Bitcoin's price is currently $70,535.38, with a slight decrease of 0.51%. Despite bearish signals in technical indicators and ongoing market caution, experts stress that it is premature to declare a market bottom. Future trends will determine the trajectory.
BlockChainReporter14m ago
Exchange "Listing Curse" Investigation: Why do 89% of new Singapore dollars ultimately become retail investors' harvest?
After launching on Binance, most tokens faced severe losses, with an average retracement of 71% to 80%. Listing is no longer seen as an investment opportunity but rather as an insider sell-off event. The main reasons include internal liquidity events, overvaluation, weak capital inflows, and market saturation. Only projects with genuine products and communities can survive in the future.
区块客56m ago
The risk of a US recession is nearly 50% — Will Bitcoin repeat its 2020 rally?
The essay analyzes Bitcoin's potential response to a looming U.S. recession in 2026, considering its historical resilience post-2020 crash. It discusses the relationship between oil prices, inflation, and recession risks, and presents two scenarios for Bitcoin's future performance amid economic downturns.
TapChiBitcoin1h ago
Altcoins Slump: 4x-7x Needed to Reclaim Old Highs
Many mid-cap altcoins, including Aptos and Injective, are currently trading well below their previous highs from late 2025. In several cases, prices have declined by more than 70 percent from peak levels, significantly altering
Coinfomania1h ago
Fidelity Buys $83M BTC as ETF Inflows Snap 5-Week Outflow Streak
_Fidelity buys $83M BTC as ETF inflows hit $257.7M and AUM drops 30.5%, with Bitcoin holding near $60K support._
Fidelity added about $83 million in Bitcoin through its spot ETF, as institutional interest shows early signs of recovery.
The move comes while Bitcoin steadies after recent selling
LiveBTCNews1h ago
