
**Date: **Fri, Jan 02, 2026 | 03:10 PM GMT
The broader cryptocurrency market has started the new year with modest strength, as both Bitcoin (BTC) and Ethereum (ETH) trade firmly in the green with gains of over 2%. While this positive momentum is lifting most altcoins, the privacy-focused token Zcash (ZEC) is moving against the broader trend.
ZEC is down more than 8% on the day. However, despite the red candles, the daily chart suggests this pullback may be a healthy bullish retest rather than the start of a trend reversal.
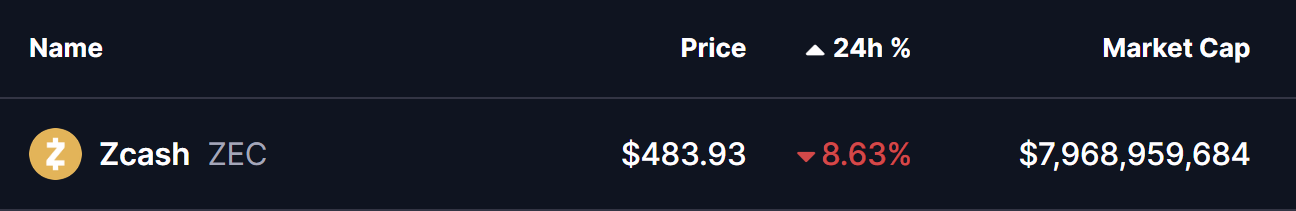
Source: Coinmarketcap
Retesting the Ascending Triangle Breakout
On the daily timeframe, ZEC had been consolidating inside a well-defined ascending triangle pattern, characterized by a series of higher lows pressing against a flat resistance zone near $476. This structure signaled steady accumulation and growing buyer confidence.
Earlier, bulls successfully broke above the $476 ceiling with strong momentum, sending ZEC sharply higher by nearly 66% — from the breakout base to a local peak around $556.59. This move confirmed the validity of the pattern and marked a clear shift in market structure.
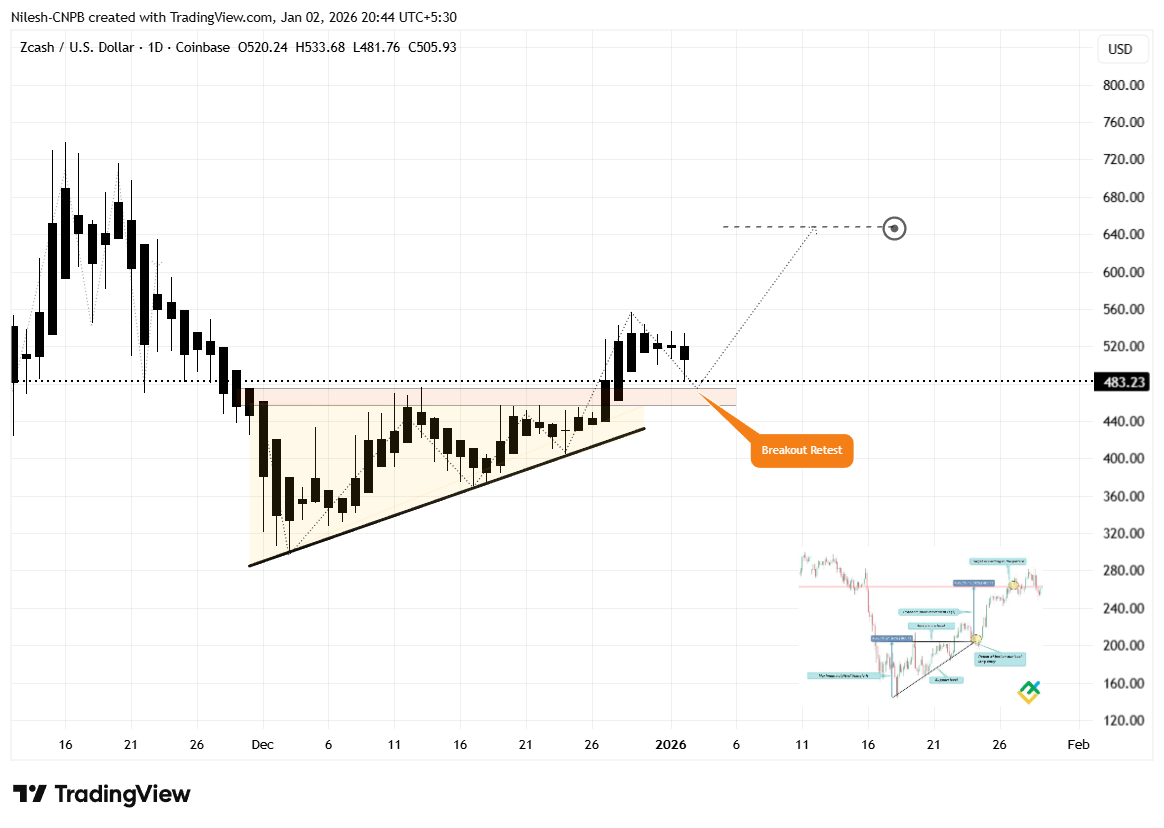
Zcash (ZEC) Daily Chart/Coinsprobe (Source: Tradingview)
Following that rally, price has pulled back and is now trading near the $483 region. Crucially, this zone aligns closely with the former breakout level, making it a classic resistance-turned-support area. Such retests are common after strong breakouts and often act as a launchpad for the next leg higher if buyers defend the level.
What’s Next for ZEC?
The current retest phase is technically constructive, but the next move will depend on whether bulls can firmly defend the broader $426–$476 support zone. A strong reaction from this area would signal that buyers remain in control and are using the dip to accumulate.
If support holds and momentum returns, ZEC’s first key objective will be a reclaim of the $556.59 local high. A decisive move above this level would confirm strength and open the door for further upside.
In that scenario, ZEC could advance toward the ascending triangle’s measured target near $647.73, representing a potential upside of roughly 32% from current levels.
On the downside, failure to hold above the $426 support zone would weaken the bullish breakout structure and raise the risk of a deeper pullback, potentially turning the recent move into a failed breakout.
For now, all eyes remain on the breakout retest. How ZEC reacts around this key support area will likely determine whether the recent rally was just the beginning — or a move that needs more time to rebuild momentum.
Disclaimer: The views and analysis presented in this article are for informational purposes only and reflect the author’s perspective, not financial advice. Technical patterns and indicators discussed are subject to market volatility and may or may not yield the anticipated results. Investors are advised to exercise caution, conduct independent research, and make decisions aligned with their individual risk tolerance.
About Author: Nilesh Hembade is the Founder and Lead Author of Coinsprobe, with over 5 years of experience in the cryptocurrency and blockchain industry. Since launching Coinsprobe in 2023, he has been providing daily, research-driven insights through in-depth market analysis, on-chain data, and technical research.
Disclaimer: The information on this page may come from third parties and does not represent the views or opinions of Gate. The content displayed on this page is for reference only and does not constitute any financial, investment, or legal advice. Gate does not guarantee the accuracy or completeness of the information and shall not be liable for any losses arising from the use of this information. Virtual asset investments carry high risks and are subject to significant price volatility. You may lose all of your invested principal. Please fully understand the relevant risks and make prudent decisions based on your own financial situation and risk tolerance. For details, please refer to
Disclaimer.
Related Articles
The RWA Yield Infrastructure Trade
The essay highlights challenges in direct RWA token exposure, emphasizes the potential in leverage opportunities amid settlement delays, critiques Morpho's governance token structure, and presents Fluid as a more effective token model with stablecoin links.
CoinDesk53m ago
Bitcoin traders keep chasing Trump’s Iran noise. The real signals are elsewhere.
The past four weeks have been brutal for bitcoin BTC$66,462.68 traders as prices keep chasing comments by President Donald Trump, who can't make up his mind about Iran.
One day, he talks peace and BTC and risk assets go up while oil drops, the next day he talks hawkish again, sending BTC down and o
CoinDesk1h ago
Stop fixating on Trump’s remarks? The real Bitcoin price movement signals are in the tanker rates and insurance premiums
Bitcoin is trading sideways near $66,000, influenced by remarks by Trump on the situation in Iran. The shipping and insurance costs in the Strait of Hormuz reflect elevated risk. It is expected that an expanding supply shortfall will continue to weigh on Bitcoin and other risk assets, and in the short term the market may still remain choppy.
GateNews1h ago
Bitcoin, ether, solana slide further as Trump threatens to hit Iran 'extremely hard'
Bitcoin and major cryptocurrencies fell sharply after Trump's address threatened escalated military action against Iran, reversing a previous rally. The ongoing conflict continues to create volatility in the market. Despite historical April gains, optimism is tempered by geopolitical tensions.
CoinDesk2h ago
Trump makes a tough statement to pressure Iran, Bitcoin falls below a key level, and the crypto market is under pressure again
Driven by the impact of Trump’s hardline remarks toward Iran, the crypto market weakened, with Bitcoin and Ethereum falling to $66,609 and $2,056, respectively. Market panic sentiment intensified, and the Fear & Greed Index dropped to 8. War risk pushed energy prices up, suppressing the valuations of risk assets, and in the short term volatility in crypto assets could increase.
GateNews2h ago
Trump’s “Stone Age” speech threatens to seriously hit the market; Bitcoin’s price gives back its gains
U.S. President Trump threatened in a speech to launch even harsher strikes against Iran. The market reacted sharply: Bitcoin and the stock market fell significantly, and oil prices surged. Iran has no intention of backing down and is pushing for legislation on permanent tolls, showing that tensions between the two countries have not eased. The market believes a ceasefire cannot be achieved quickly.
MarketWhisper3h ago
