
**Date: **Wed, Jan 07, 2026 | 08:00 AM GMT
The broader cryptocurrency market continues to show strong New Year momentum, with Bitcoin (BTC) up nearly 4% and Ethereum (ETH) posting weekly gains of over 9%. This improving risk sentiment is now extending beyond majors and into select altcoins — including Pudgy Penguins (PENGU).
PENGU has already delivered an impressive 45% gain over the past week. While the rally itself is notable, the more important development lies in the underlying market structure. Recent price behavior on the daily chart suggests that PENGU may be approaching a pivotal breakout zone, one that could define the next directional move.
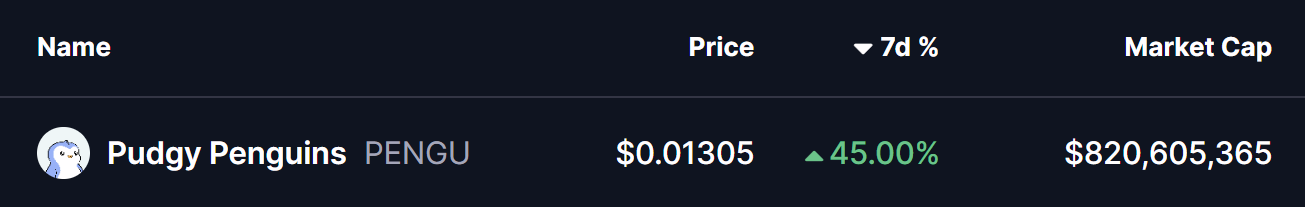
Source: Coinmarketcap
Right-Angled Descending Broadening Pattern in Play
On the daily timeframe, PENGU had been trading within a right-angled descending broadening formation — a bullish reversal pattern characterized by repeated rejections at a flat resistance level and gradually rising downside volatility.
For several weeks, price remained capped beneath the $0.01294–$0.01381 resistance band. Each attempt to push higher was met with selling pressure, keeping PENGU locked in consolidation while the lower boundary of the structure continued to expand.
That dynamic changed after a strong rebound from the lower trendline. Buyers stepped in decisively, triggering a sharp upside move that allowed PENGU to reclaim the 50-day moving average around $0.01062. This level had previously acted as persistent dynamic resistance, and reclaiming it marked a clear shift in short-term momentum.
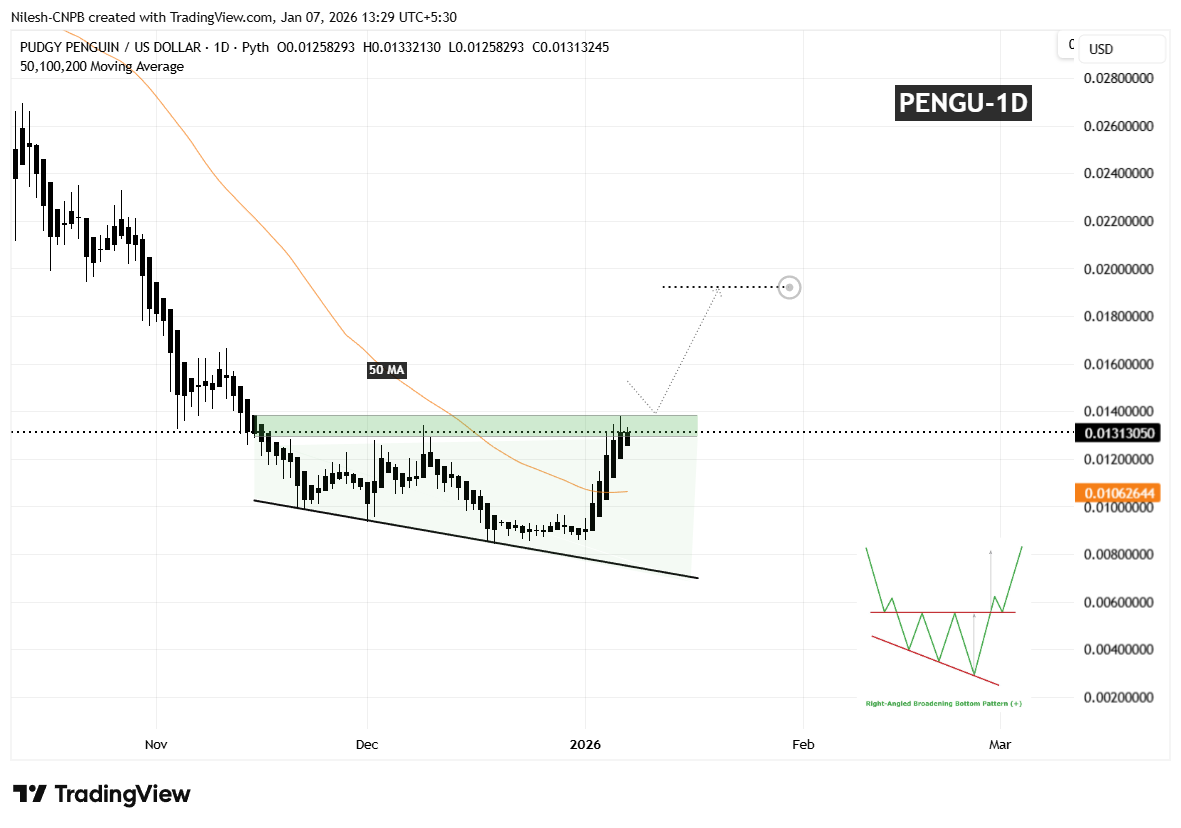
Pudgy Penguins (PENGU) Daily Chart/Coinsprobe (Source: Tradingview)
Following this reclaim, upside strength accelerated, and price has now returned to the same resistance zone that rejected advances multiple times in the past. This move back into resistance places PENGU at a critical inflection point, where market participants are once again being tested.
What’s Next for PENGU?
A decisive daily close above the $0.01294–$0.01381 resistance area would confirm a breakout from the descending broadening formation and validate the broader bullish reversal setup. Sustained acceptance above this zone would likely invite fresh momentum participation, as traders recognize the structural shift underway.
Based on the depth of the pattern and its measured move projection, a successful breakout could open the door toward the $0.01922 region. From current levels, that would represent a potential upside of roughly 45%, aligning with typical expansion behavior seen after clean breakouts from this formation.
That said, patience remains key. Prior to confirmation, PENGU could still experience short-term pullbacks, including a possible retest of the 50-day moving average, which has now transitioned into dynamic support. Such retracements would not invalidate the bullish setup as long as higher-low structures continue to form.
Until a clear breakout and follow-through occur, caution is warranted. The $0.01294–$0.01381 zone remains the defining decision area that will determine whether PENGU transitions into a sustained bullish phase or continues consolidating as the early weeks of 2026 unfold.
Disclaimer: The views and analysis presented in this article are for informational purposes only and reflect the author’s perspective, not financial advice. Technical patterns and indicators discussed are subject to market volatility and may or may not yield the anticipated results. Investors are advised to exercise caution, conduct independent research, and make decisions aligned with their individual risk tolerance.
About Author: Nilesh Hembade is the Founder and Lead Author of Coinsprobe, with over 5 years of experience in the cryptocurrency and blockchain industry. Since launching Coinsprobe in 2023, he has been providing daily, research-driven insights through in-depth market analysis, on-chain data, and technical research.
Disclaimer: The information on this page may come from third parties and does not represent the views or opinions of Gate. The content displayed on this page is for reference only and does not constitute any financial, investment, or legal advice. Gate does not guarantee the accuracy or completeness of the information and shall not be liable for any losses arising from the use of this information. Virtual asset investments carry high risks and are subject to significant price volatility. You may lose all of your invested principal. Please fully understand the relevant risks and make prudent decisions based on your own financial situation and risk tolerance. For details, please refer to
Disclaimer.
Related Articles
Bitcoin rallies on report of Iran ceasefire talks, Algorand extends gains
Bitcoin BTC$69,892.51 climbed to near $70,000 as traders reacted to signs of possible de-escalation in the Iran war and amid a short squeeze that liquidated more than $270 million in shorts.
Crypto prices rose, along with equity index futures and equities, as Axios reported that the U.S. and Iran a
CoinDesk6m ago
Chainlink Sees 25% Whale Growth: Will LINK Push Toward $27?
Chainlink whales grew 25% in a year, signaling strong accumulation by large holders.
Institutional adoption and reserve growth tighten LINK supply, supporting potential upward price movement.
LINK trades in a narrow range; a breakout could push toward $27.
Chainlink — LINK, has been
CryptoNewsLand2h ago
Hyperliquid Faces Volatility as Whales Shift Positions: Will HYPE Hold $35?
Whale activity drives HYPE volatility, creating uncertainty around short-term price movements.
Accumulation trends remain strong, with investors moving $11.7 million HYPE off exchanges.
Key support at $33.48–$35.19 may determine whether HYPE rebounds or drops further.
Hyperliquid — HYPE,
CryptoNewsLand3h ago
BTC profit/loss trade ratio is 2.95, the highest level in 12 weeks
Gate News message: On April 6, according to Santiment data, the BTC profit-loss trade ratio reached 2.95, the highest level in 12 weeks. This indicator measures the ratio of profitable trades to losing trades; the current value shows that the share of profitable trades in the market is significantly higher than that of losing trades, reaching a recent peak level.
GateNews3h ago
SHIB Climbs 1.45% as Golden Cross Signals Potential Breakout
Price rises 1.45% as golden cross signals possible bullish momentum.
Spot inflows surge, indicating some holders may lock in profits.
Open interest rises cautiously, showing traders hesitant to commit strongly.
Shiba Inu has attracted attention after climbing 1.45% over the past 24
CryptoNewsLand4h ago
