Date: Wed, Dec 31, 2025 | 03:40 PM GMT
As the final hours of 2025 approach, the broader cryptocurrency market is showing modest strength. Both Bitcoin (BTC) and Ethereum (ETH) are trading slightly in the green, helping ease recent volatility and stabilize overall market sentiment. This calmer environment has allowed select altcoins — including Plasma (XPL) — to begin forming constructive technical setups after extended periods of downside pressure.
XPL is starting to attract attention with an impressive 11% daily jump, trimming its 60-day decline to roughly 43%. While the broader trend still reflects recovery mode, the more important signal is emerging on the daily chart, where price action is beginning to suggest a meaningful structural shift. If confirmed, this setup could mark the early stages of a bullish continuation heading into the new year.
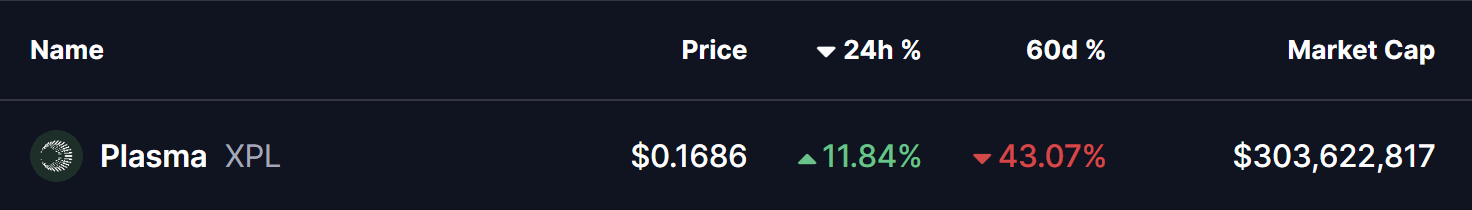
Source: Coinmarketcap
Rounding Bottom in Play
On the daily timeframe, XPL appears to be forming a textbook rounding bottom pattern — a classic bullish reversal structure that typically develops after a prolonged downtrend. This pattern reflects a slow but steady transition from selling dominance to accumulation, as bearish momentum fades and buyers gradually regain control.
Earlier in the trend, XPL faced strong rejection near the $0.3321 neckline zone, triggering a sharp decline that extended through November and December. That sell-off ultimately found a floor near the $0.1152 level, which has since proven to be a critical demand zone. Repeated defenses of this area prevented further downside and laid the foundation for a potential trend reversal.
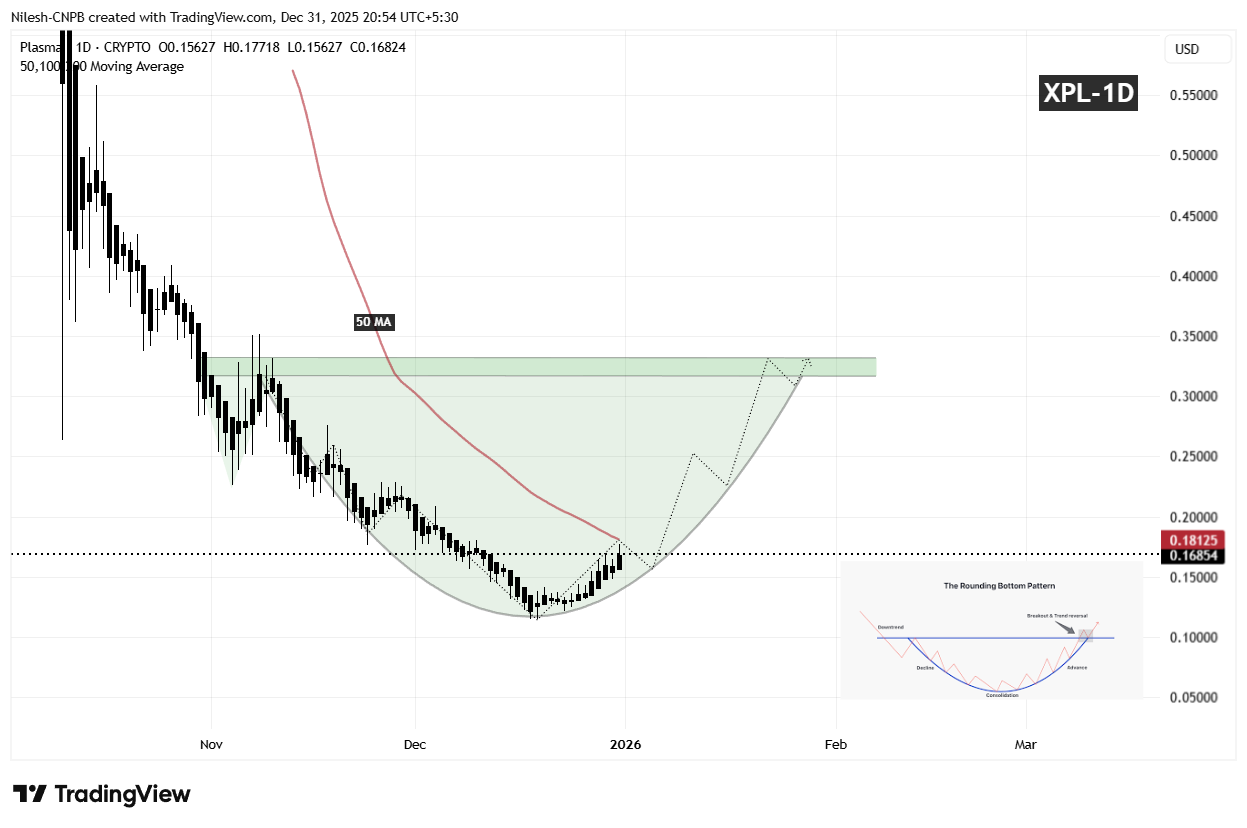
XPL Daily Chart/Coinsprobe (Source: Tradingview)
Since establishing that base, XPL has begun to curve higher in a rounded fashion, mirroring the classic structure of a developing bottom. This gradual recovery suggests that selling pressure is no longer aggressive, and that accumulation is taking place beneath the surface. The recent push back above the $0.16 region further reinforces the idea that buyers are positioning ahead of a larger directional move.
What’s Next for XPL?
For the rounding bottom pattern to gain confirmation, XPL needs to reclaim the 50-day moving average, currently positioned near the $0.1812 level. A sustained move above this area would signal a clear momentum shift and indicate that bulls are regaining control after months of corrective price action.
Looking higher, the most significant technical barrier remains the neckline resistance around $0.3321, highlighted by the prior distribution zone on the chart. A clean breakout above this region would validate the entire reversal structure and could open the door for a broader bullish expansion phase, with momentum traders and sidelined participants likely re-entering the market.
Until those levels are reclaimed, the pattern remains in its development phase. Short-term consolidation or minor pullbacks remain possible if price struggles near the 50-day moving average. However, as long as XPL continues to hold higher lows above the $0.1152 base, the broader bottoming structure remains intact.
Overall, XPL is approaching a technically important inflection point. The emerging rounding bottom formation, improving price structure, and proximity to key resistance levels suggest the coming sessions could prove decisive for Plasma’s next major directional move as the market transitions into 2026.
Disclaimer: The views and analysis presented in this article are for informational purposes only and reflect the author’s perspective, not financial advice. Technical patterns and indicators discussed are subject to market volatility and may or may not yield the anticipated results. Investors are advised to exercise caution, conduct independent research, and make decisions aligned with their individual risk tolerance.
About Author: Nilesh Hembade is the Founder and Lead Author of Coinsprobe, with over 5 years of experience in the cryptocurrency and blockchain industry. Since launching Coinsprobe in 2023, he has been providing daily, research-driven insights through in-depth market analysis, on-chain data, and technical research.
Disclaimer: The information on this page may come from third parties and does not represent the views or opinions of Gate. The content displayed on this page is for reference only and does not constitute any financial, investment, or legal advice. Gate does not guarantee the accuracy or completeness of the information and shall not be liable for any losses arising from the use of this information. Virtual asset investments carry high risks and are subject to significant price volatility. You may lose all of your invested principal. Please fully understand the relevant risks and make prudent decisions based on your own financial situation and risk tolerance. For details, please refer to
Disclaimer.
Related Articles
Fractal data: The price of TAO on Bittensor could drop sharply by 40% within five weeks.
Bittensor (TAO) recently surged 160%, but signs of weakness are appearing with a golden cross formation, historically leading to significant pullbacks. Past instances suggest a potential 40% decline in the coming weeks, amidst overbought conditions and macroeconomic pressures. Despite increased discussions surrounding TAO, investor sentiment remains cautious.
TapChiBitcoin48m ago
The Iran conflict drove Ethereum to rise against the trend, and Tom Lee advised selling gold to buy cryptocurrencies
Since the war between the U.S. and Iran began at the end of February, Ethereum has performed exceptionally well, outperforming several major assets. Fundstrat's research shows that Ethereum has risen 17% against the S&P 500, and Tom Lee believes it has significant potential as a risk-averse asset. He predicts that Ether could rise to $250,000, and multiple institutions are optimistic about investing in it. Currently, the price of Ethereum is fluctuating around $2,000, with market attention continuously increasing.
GateNews52m ago
Zilliqa faces downward pressure as bears dominate the market.
Zilliqa (ZIL) has dropped below $0.0040, indicating market weakness. On-chain data and derivatives suggest a bearish trend, with increasing selling pressure and a negative funding rate indicating further downside risk in the near future.
TapChiBitcoin55m ago
Dogecoin (DOGE) falls, attracting whales to buy in, while ETF investors remain inactive.
Dogecoin has fallen over 5% in the past 24 hours, with a price around $0.091, and the total market capitalization has decreased to approximately $2.4 trillion. Technical indicators show increased short-term selling pressure, with support around $0.092. Although institutions remain cautious, some retail investors are seizing the opportunity to buy, and there is still hope for a breakout above $0.10. Additionally, Qubic plans to launch Dogecoin mining on April 1, which could bring new vitality to its ecosystem.
GateNews1h ago
Crypto Market Drops As $BTC and $ETH Fall With Persisting Fear Index
The global crypto market is experiencing a downturn, with a total market cap of $2.36T and significant declines in Bitcoin and Ethereum prices. Major gainers like Black Phoenix have surged dramatically. DeFi and NFT sectors are also seeing decreases, alongside regulatory actions in India and the UK.
BlockChainReporter1h ago
CEX CEO: The US stock market evaporated over $1 trillion in a single day, while Bitcoin's performance remained relatively stable.
On March 27, a CEX CEO said that the sharp drop in U.S. stocks reflects a rapid repricing of macro risks across global markets. Rising oil prices and geopolitical impacts are influencing global capital allocation. Despite Bitcoin’s short-term high volatility, its relatively resilient performance suggests that leverage in the crypto market is falling, and some investors view Bitcoin as a neutral allocation choice.
GateNews1h ago
