Bitcoin (BTC) is currently trading around $90,022, as the bulls are trying to regain control by pushing the price above the important psychological level of $90,000. However, BTC’s long-term outlook still makes investors cautious. On the Polymarket market, the probability of Bitcoin reaching $150,000 before 2027 is only 21%, reflecting rather conservative expectations for 2026.
Sharing on the Milk Road program, Mr. Julio Moreno – Head of Research at CryptoQuant – stated that Bitcoin officially entered a bear market from early November and has not yet shown clear signs of recovery. According to Moreno, based on the realized price and historical cycles, BTC is likely to bottom out in the $56,000–$60,000 range.
This view also aligns with the opinion of veteran Bitcoin investor Michael Terpin. He forecasts BTC may bottom around $60,000 in Q4/2026 and considers this an attractive buying opportunity. Terpin believes the next halving could trigger a “supply shock,” thereby activating a strong rally in 2028–2029.
So, are Bitcoin and the top altcoins ready for a significant recovery? Let’s analyze the charts of the 10 largest cryptocurrencies to find the answer.
Technical Analysis of BTC
Bitcoin has been trading within a narrow range from $86,400 to $90,600 in recent days. Usually, such tight accumulation phases lead to a strong breakout.
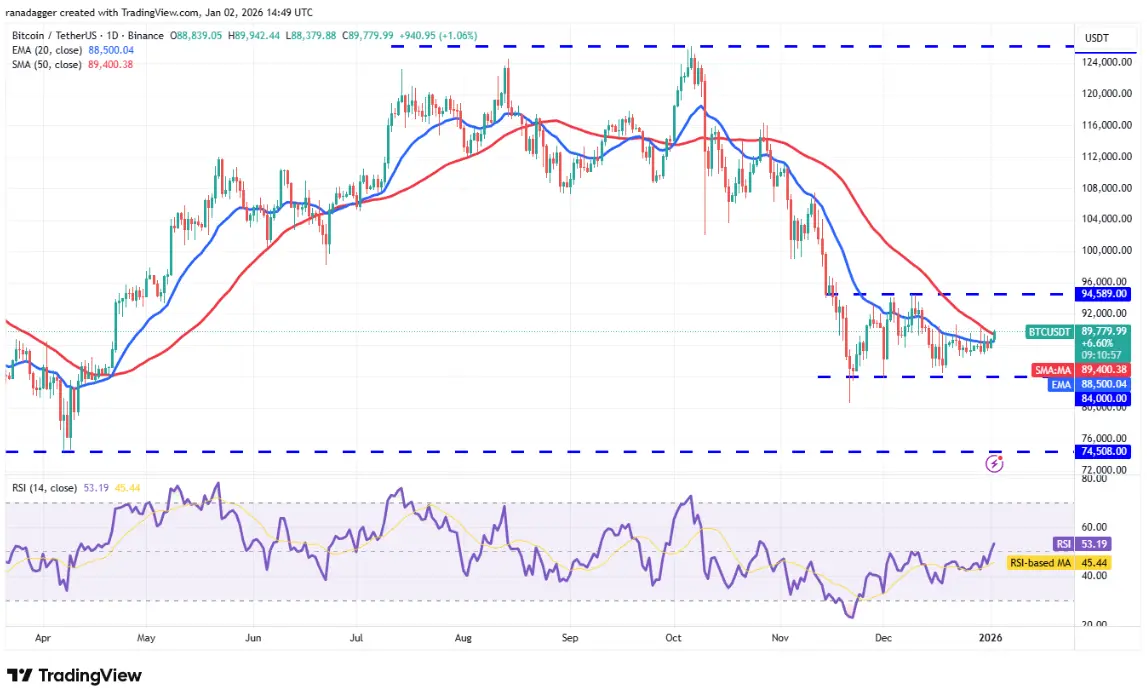 Daily BTC/USDT Chart | Source: TradingView The 20-day EMA is moving sideways around $88,500, with the RSI oscillating near the midpoint, indicating that supply and demand are in balance.
If the bulls push the price above $90,600, the BTC/USDT pair could rise to $94,589. This is a key resistance level that the bears need to defend, because if the price closes above this level, Bitcoin could move towards $100,000 and beyond to $107,500.
Conversely, the bears will gain the advantage if the price turns down and breaks below $86,400, increasing the risk of a breakdown below the support zone at $84,000.
Technical Analysis of ETH
Ether (ETH) is still oscillating within an symmetrical triangle pattern, reflecting market indecision about the next trend.
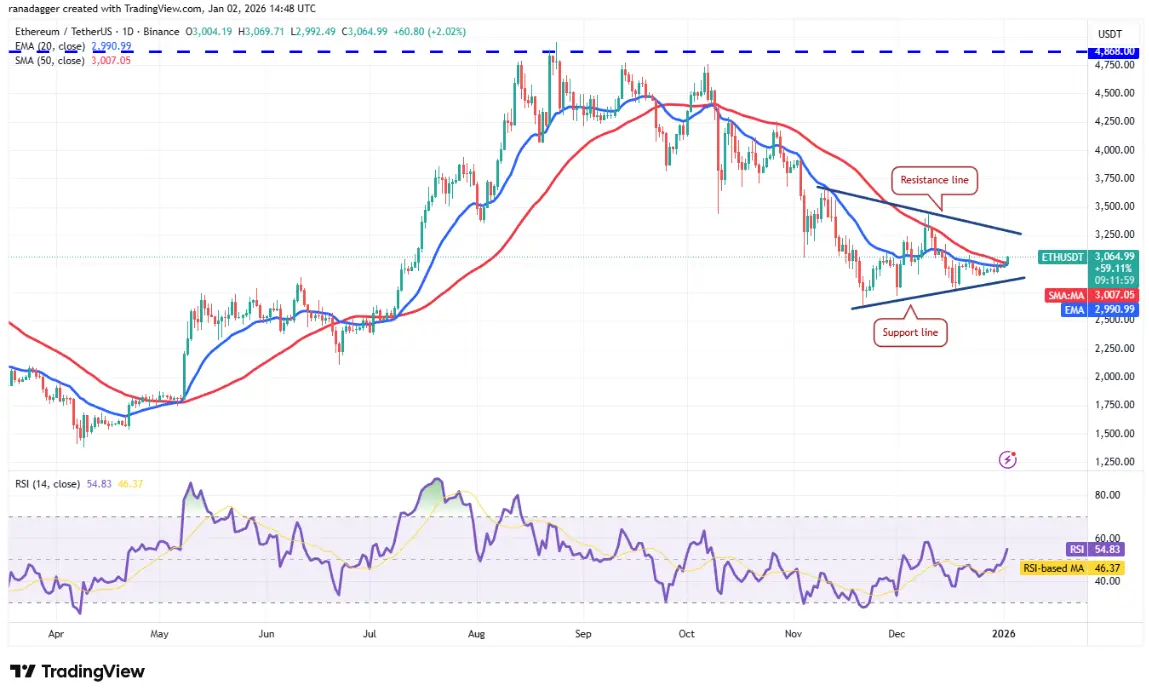 Daily ETH/USDT Chart | Source: TradingView If the price closes above the 50-day SMA at $3,007, the ETH/USDT pair could rise to the resistance line of the pattern. The bears are expected to defend this level vigorously, because if it breaks, ETH could open the way for an upward move toward $4,000.
In the opposite scenario, if the price reverses downward from the resistance line, it indicates ETH may continue to be trapped within the triangle. The bears will regain control if the price closes below the support line.
Technical Analysis of BNB
The bears are trying to defend the 50-day SMA at $873, but a positive sign is that the BNB bulls are still maintaining upward pressure.
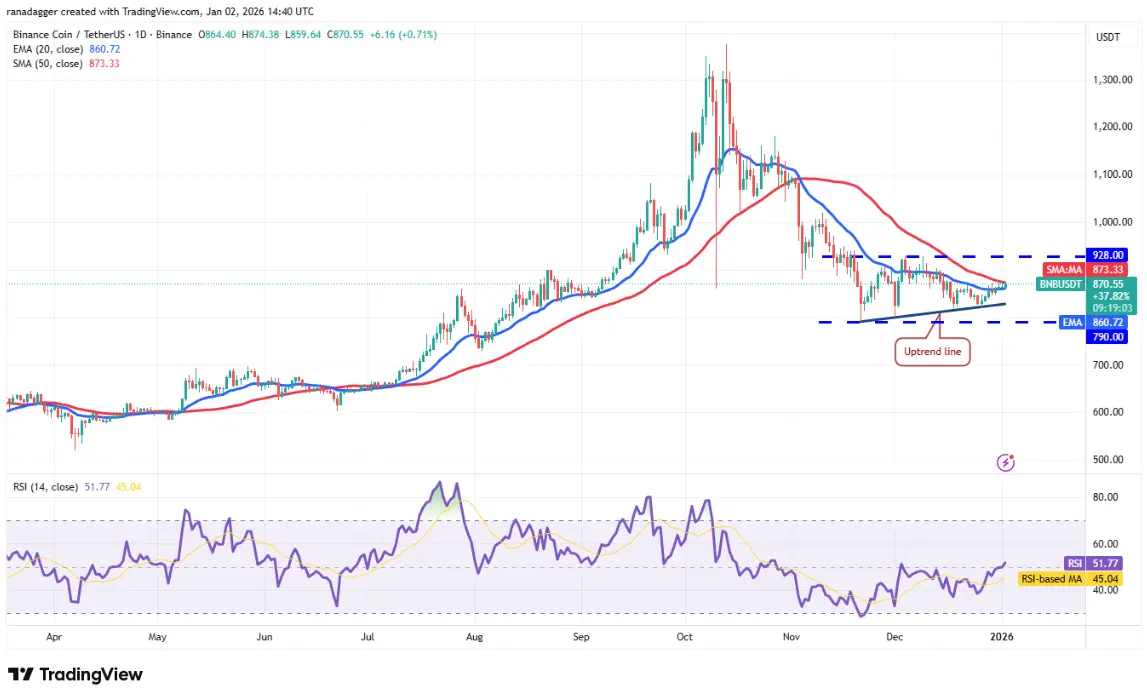 Daily BNB/USDT Chart | Source: TradingView This increases the likelihood of the price moving up to the $928 zone, where the bears are likely to intervene. If the bulls overcome this barrier, the BNB/USDT pair will complete a bullish triangle pattern, with a target up to $1,066 based on the pattern.
On the other hand, if BNB reverses downward and breaks below the upward trendline, it indicates the bulls have given up. A new decline could then begin if the price closes below $790.
Technical Analysis of XRP
XRP has been closely following the 20-day EMA at $1.90 in recent days, increasing the potential for a breakout upward.
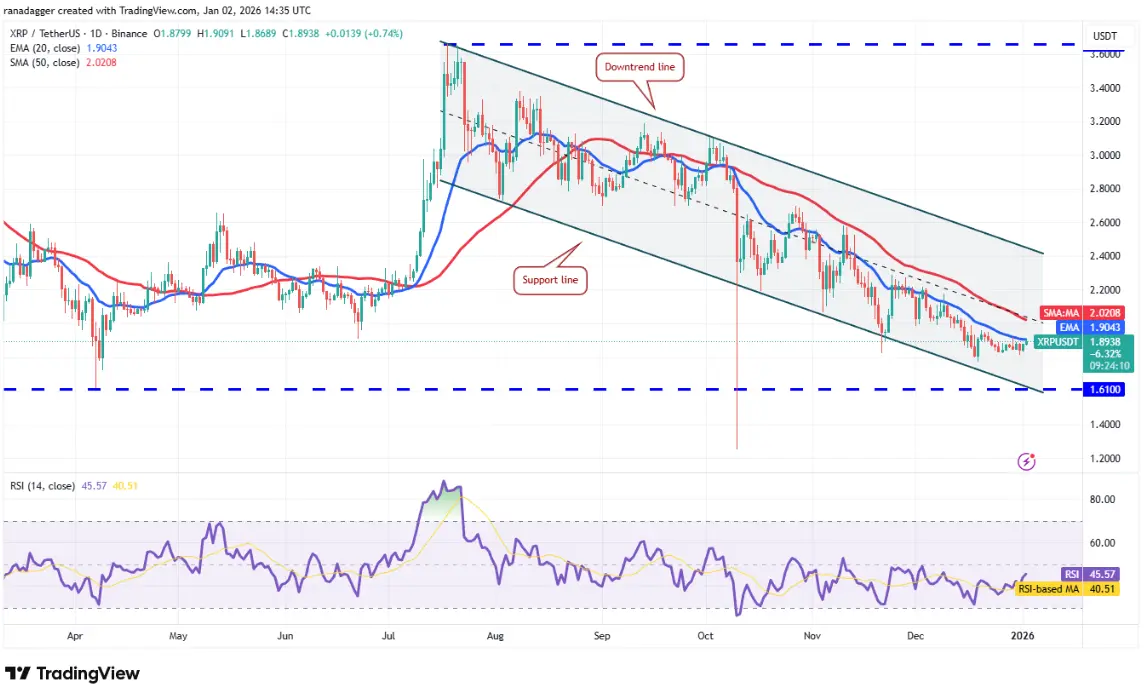 Daily XRP/USDT Chart | Source: TradingView If this occurs, the XRP/USDT pair could rise to the downward trendline. Although there is resistance at the 50-day SMA at $2.02, it is likely to be surpassed. However, the bears are expected to defend strongly at the downward trendline. If the price drops sharply from here, XRP may continue to fluctuate within the channel for some time.
Conversely, the $1.61 level is a key support zone. If broken, XRP could enter a new downtrend, heading toward the October 10 low around $1.25.
Technical Analysis of SOL
Solana (SOL) has risen to the 50-day SMA at $131. However, the long wick indicates that the bears are defending this zone very aggressively.
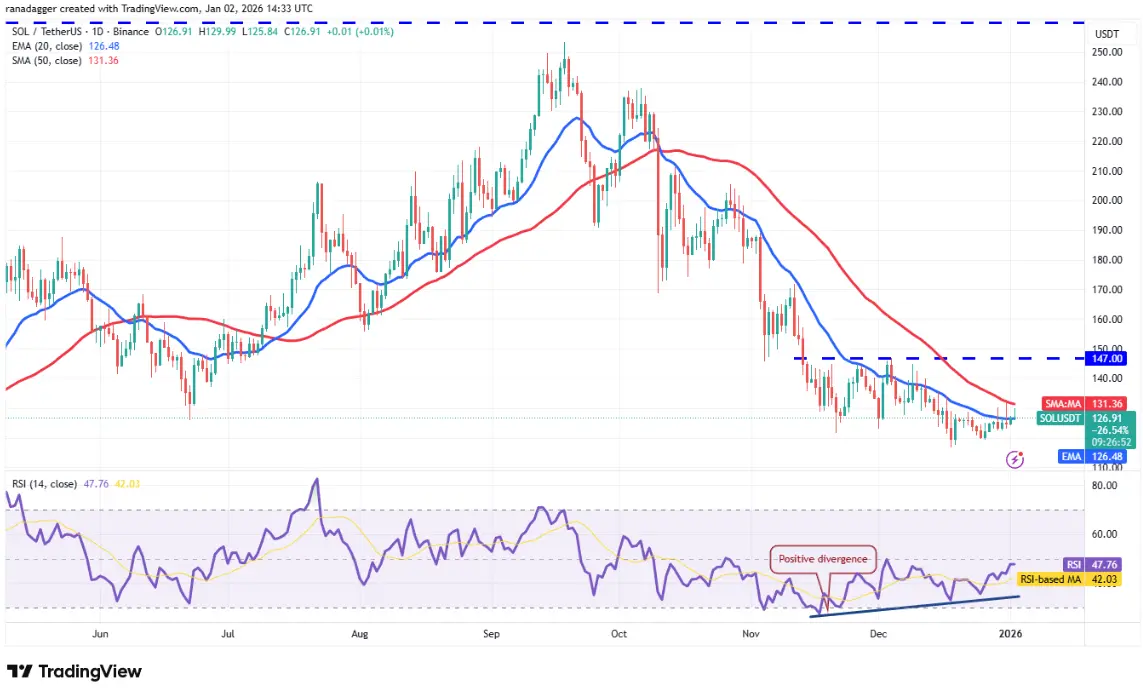 Daily SOL/USDT Chart | Source: TradingView Nonetheless, positive divergence on the RSI suggests selling pressure is weakening. The bulls will continue to attempt to push the price above the 50-day SMA. If successful, the SOL/USDT pair could rise to $147.
Conversely, if the price reverses downward from the moving averages and breaks below $116, it indicates the bears still control the market. In that case, SOL could fall to $108 and then to $95.
Technical Analysis of DOGE
Dogecoin (DOGE) fell below $0.12 on Wednesday but the bears could not sustain the decline.
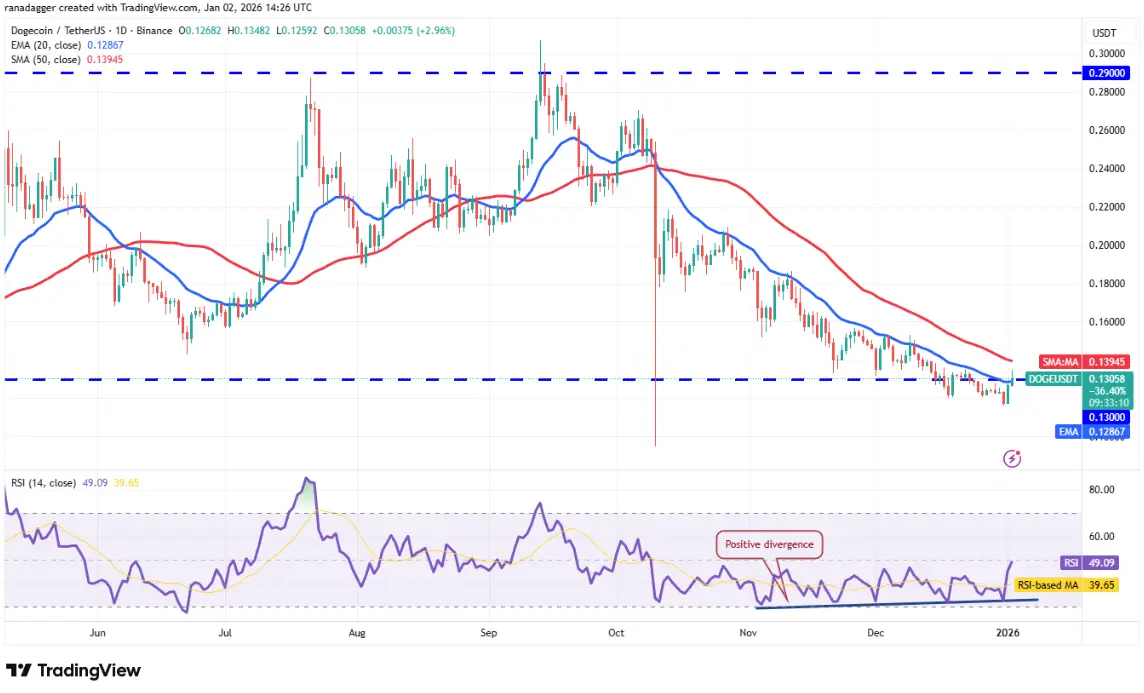 Daily DOGE/USDT Chart | Source: TradingView The bulls pushed the price back above the breakout zone of $0.13 on Thursday but are struggling to hold higher levels. If the price reverses downward and breaks below $0.12, it indicates the bears have turned the $0.13 level into resistance. Then, the DOGE/USDT pair could slide back to the October 10 low around $0.10.
On the other hand, if the price rebounds and breaks above the 50-day SMA at $0.14, it shows the market has rejected the previous breakdown. Dogecoin could then advance toward the $0.16 zone.
Related Articles
BTC 15-minute drop of 0.45%: spot selling pressure led the move, and leveraged funds stayed on the sidelines, without worsening volatility
2026-04-11 13:00 to 13:15 (UTC), BTC recorded a short-term return of -0.45%, with a price range of 72526.3 to 72935.7 USDT, and the 15-minute swing amplitude was 0.56%. Overall market attention remains at a high level. Volatility is not extremely elevated, but downward pressure is clear, and disagreement between long and short positions in the short term has intensified.
The main driving force behind this abnormal move is active sell pressure in the spot market. During this period, the combined total trading volume of the spot market and perpetual futures increased month-over-month by about 12%. Order book data shows a slight rise in resting sell orders, faster cancellations of buy orders, and short-term liquidity tightening, triggering
GateNews31m ago
Passive BTC Earnings Made Simple: Bitcoin Everlight Phase 5 Shards Now Available for $100
Earning Bitcoin passively used to sound like something reserved for people with deep pockets, technical expertise, or industrial mining setups. Phase 5 of the Bitcoin Everlight presale just made that assumption obsolete. For $100 worth of BTCL tokens, anyone can now activate a shard and start
BlockChainReporter45m ago
Under the Iran-U.S. conflict, the Bitcoin market is currently splitting: institutions continue to buy, while whales and mining firms are accelerating their sell-offs
Amid the impact of the U.S.-Iran geopolitical conflict, the Bitcoin market has diverged: institutional investors continue to accumulate Bitcoin, while whales, mining firms, and some countries are reducing their holdings. Data shows that large holders have shifted to net selling, mining firms’ sell-offs have been significant, and sovereign holders have also clearly cut exposure. Despite muted market sentiment, the price of Bitcoin has held in the $65k to $73k range, and its future direction will depend on continued inflows of institutional capital.
GateNews1h ago
CME Bitcoin futures open interest falls to $8.41 billion, hitting a 14-month low
Chicago Mercantile Exchange bitcoin futures open interest fell to a 14-month low. Driven by the unwinding of basis trades, institutions are leaning toward directly holding spot, and the leverage level in the futures market has dropped significantly.
GateNews2h ago
STRC This week’s fundraising is expected to be able to buy 8,000 BTC, or hold 10,000 coins
Gate News message. On April 11, Strategy's Stretch (STRC) has, to date this week, raised enough funds to purchase 8,000 BTC. It is estimated that STRC may hold 10,000 BTC by the end of this week.
GateNews2h ago
