
As the new year 2026 begins, the broader cryptocurrency market has shown modest strength over the past few hours, with both Bitcoin (BTC) and Ethereum (ETH) turning slightly green. This improvement in sentiment has started to spill over into the altcoin market as well, with several tokens attempting to build upward momentum — including Render (RENDER).
RENDER is currently up around 4% on the day, but the more compelling development lies beneath the surface. On lower timeframes, price action is beginning to highlight a constructive bullish structure that could soon pave the way for a meaningful breakout if confirmed.
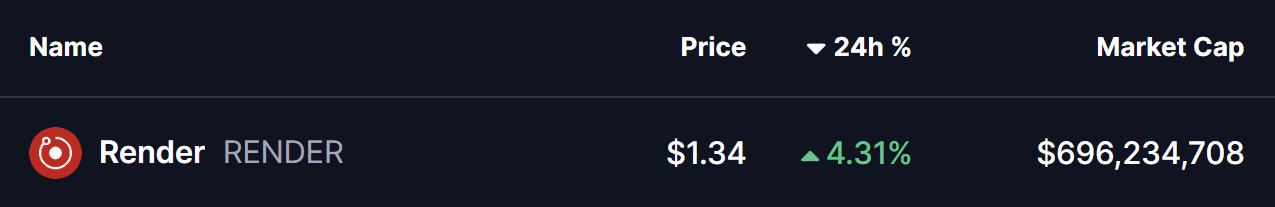
Source: Coinmarketcap
Ascending Triangle Structure Takes Shape
On the 4-hour chart, RENDER appears to be forming a textbook ascending triangle, characterized by a sequence of higher lows pressing steadily against a well-defined horizontal resistance zone. This structure is widely viewed as a bullish continuation pattern, particularly when it develops after a period of consolidation and shows signs of accumulation.
RENDER recently faced rejection near the $1.36 neckline resistance, which pushed price back toward its rising support trendline around the $1.28 region. However, each pullback has been met with strong buying interest, keeping the pattern intact and preventing any deeper breakdown. This behavior suggests that sellers are gradually losing control as buyers continue to step in at higher levels.

Render (RENDER) 4H Chart/Coinsprobe (Source: Tradingview)
The latest rebound has carried RENDER back toward the upper boundary of the pattern, reinforcing the idea that demand remains firm. Rather than signaling weakness, this price action points to healthy consolidation as the market tightens ahead of a potential breakout.
What’s Next for RENDER?
From here, RENDER appears to be preparing for another test of the $1.36 resistance zone. A confirmed breakout and sustained close above this level, ideally followed by a successful retest as support, would validate the ascending triangle structure and likely trigger a bullish expansion phase.
Based on the measured move of the pattern, the technical upside projection points toward the $1.54 region. This target represents a potential upside of roughly 14% from current levels and also aligns with previous price structure, strengthening the bullish case.
That said, caution remains warranted. A failure to break above resistance could result in a pullback toward the rising support trendline. As long as that trendline continues to hold, the broader bullish structure would remain intact. A decisive breakdown below support, however, would invalidate the pattern and delay any breakout scenario.
For now, the combination of improving market sentiment, persistent buying pressure, and a tightening ascending triangle structure suggests that Render is approaching a critical decision point — one that could define its next significant move as 2026 gets underway.
Disclaimer: The views and analysis presented in this article are for informational purposes only and reflect the author’s perspective, not financial advice. Technical patterns and indicators discussed are subject to market volatility and may or may not yield the anticipated results. Investors are advised to exercise caution, conduct independent research, and make decisions aligned with their individual risk tolerance.
About Author: Nilesh Hembade is the Founder and Lead Author of Coinsprobe, with over 5 years of experience in the cryptocurrency and blockchain industry. Since launching Coinsprobe in 2023, he has been providing daily, research-driven insights through in-depth market analysis, on-chain data, and technical research.

Disclaimer: The information on this page may come from third parties and does not represent the views or opinions of Gate. The content displayed on this page is for reference only and does not constitute any financial, investment, or legal advice. Gate does not guarantee the accuracy or completeness of the information and shall not be liable for any losses arising from the use of this information. Virtual asset investments carry high risks and are subject to significant price volatility. You may lose all of your invested principal. Please fully understand the relevant risks and make prudent decisions based on your own financial situation and risk tolerance. For details, please refer to
Disclaimer.
Related Articles
What next as XRP rises to $1.33 but fails to break out
XRP is currently trading around $1.33, showing slight upward movement but lacking a breakout. Volume is up, indicating potential positioning rather than strong conviction. Key price levels to watch are $1.30 as support and $1.34-$1.35 as resistance, with XRP remaining range-bound in the meantime.
CoinDesk9m ago
Bittensor Price Faces Resistance as Bearish Signals Emerge
Key Insights
The Bittensor price rally from $144 to $375 shows slowing momentum as resistance near $380 continues to limit further upside expansion in recent sessions.
The TD Sequential indicator flashes a sell
CryptoNewsLand12m ago
Solana Holds Key Support as Bitcoin Rally Lifts Crypto Market
Solana's price remained above $80 amid rising Bitcoin values, contributing to a broader crypto market recovery with a capitalization of $2.35 trillion. Institutional demand and easing geopolitical tensions supported this growth, while Solana led in decentralized finance activity, recording significant DEX and stablecoin volumes in March.
CryptoNewsLand18m ago
Hyperliquid Sees Sharp Volume Drop as Netflows Turn Deeply Negative
Hyperliquid’s derivatives volume dropped sharply, with some platforms reporting declines above 60%, signaling reduced speculative activity and weakening trader engagement across markets.
Netflows turned deeply negative near -285%, reflecting sustained capital withdrawal as both spot and
CryptoNewsLand22m ago
Hyperliquid Price Gains as Futures Activity Lifts Momentum
Key insights
Hyperliquid open interest climbed above one point six billion dollars, signaling stronger derivatives participation and reinforcing current price momentum across markets.
Commodity perpetuals and event contracts increased trading activity, pushing daily volumes past two point fo
CryptoNewsLand2h ago
FIDA Soars Past $0.020 — 19.51% Surge Captivates Traders
FIDA's price surged 19.51% to $0.02058 amid increased trading volume and social media buzz, reflecting a shift in market sentiment. Traders are monitoring resistance at $0.026 and support at $0.01713 for potential future movements.
Coinfomania2h ago
