Date: Sun, Dec 21 2025 | 12:15 PM GMT
The broader cryptocurrency market is showing relative strength over the weekend, with both Bitcoin (BTC) and Ethereum (ETH) trading in the green. This stability in the majors has helped lift sentiment across the altcoin space, and Kaspa (KAS) is beginning to respond positively.
KAS is up more than 4% on the day, and more importantly, its recent price action is starting to outline a clear technical structure. The 4-hour chart suggests that a harmonic pattern is developing, hinting that KAS could be setting up for another upside attempt if key levels are reclaimed.
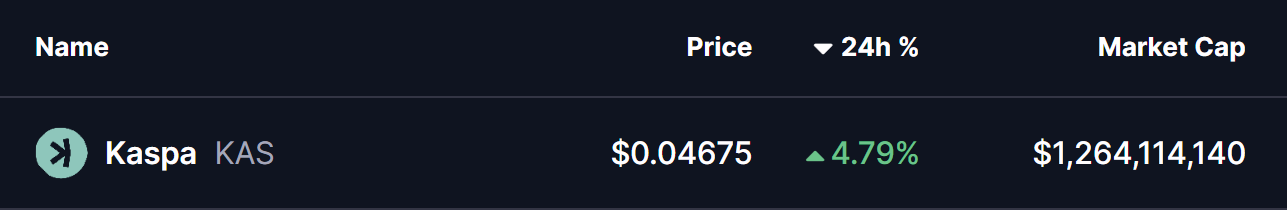
Source: Coinmarketcap
Harmonic Pattern Taking Shape
On the 4-hour timeframe, KAS appears to be forming a Bearish ABCD harmonic pattern. Despite the bearish label, this setup often delivers a strong bullish CD-leg before price reaches the Potential Reversal Zone (PRZ). This interim rally is typically the most aggressive phase of the structure, and that is the move currently unfolding.
The pattern began with a sharp advance from point A near $0.0360 to point B, marking KAS’s initial impulse higher. This was followed by a corrective pullback into point C around $0.0400, where downside momentum stalled and buyers stepped in decisively. The defense of this level suggests that selling pressure is weakening and that demand is beginning to build.
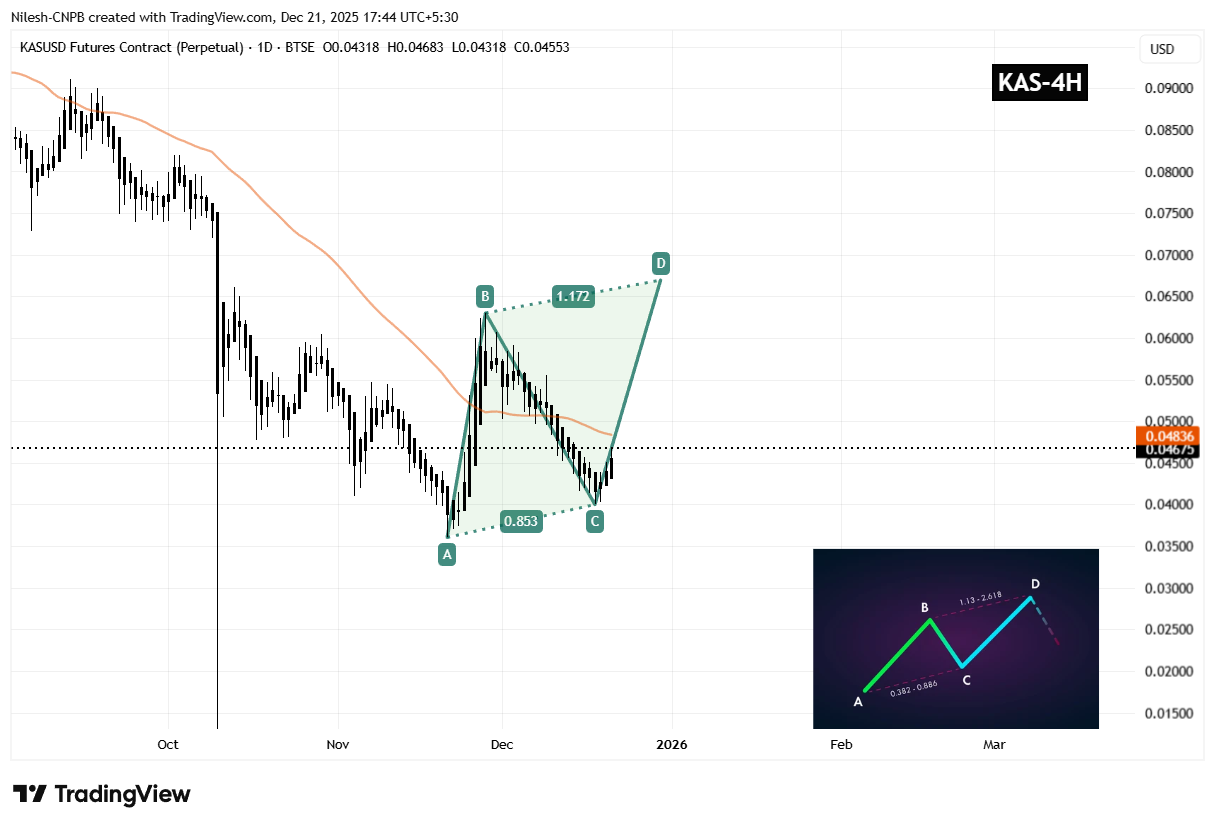
Kaspa (KAS) 4H Chart/Coinsprobe (Source: Tradingview)
Since bouncing from point C, KAS has pushed back toward the $0.046–$0.047 region, signaling the early stages of the CD-leg. This recovery phase indicates improving short-term momentum as the market tests overhead resistance.
A key technical obstacle now lies at the 50-period moving average, currently near $0.0484. This level has acted as dynamic resistance throughout the recent downtrend, and price is now compressing just below it. A clean breakout and sustained close above the 50 MA would be an important confirmation that bulls are regaining control and that the harmonic structure is progressing as expected.
What’s Next for KAS?
If buyers can drive KAS above the 50 MA and maintain momentum, the next upside objective aligns with the harmonic PRZ near the 1.17 Fibonacci extension around $0.0670. Reaching this zone would complete the ABCD pattern and represent a potential upside of roughly 40%–45% from current levels.
That said, the bullish scenario remains conditional. A failure to break above the 50 MA, followed by a drop back below the C-leg support near $0.0400, would weaken the harmonic setup and reopen the door for renewed bearish pressure.
For now, the structure on the chart suggests KAS is at a technically important inflection point. As long as price continues to hold above recent lows and challenge key resistance levels, the path of least resistance may remain tilted to the upside in the short term.
Disclaimer: The views and analysis presented in this article are for informational purposes only and reflect the author’s perspective, not financial advice. Technical patterns and indicators discussed are subject to market volatility and may or may not yield the anticipated results. Investors are advised to exercise caution, conduct independent research, and make decisions aligned with their individual risk tolerance.
Disclaimer: The information on this page may come from third parties and does not represent the views or opinions of Gate. The content displayed on this page is for reference only and does not constitute any financial, investment, or legal advice. Gate does not guarantee the accuracy or completeness of the information and shall not be liable for any losses arising from the use of this information. Virtual asset investments carry high risks and are subject to significant price volatility. You may lose all of your invested principal. Please fully understand the relevant risks and make prudent decisions based on your own financial situation and risk tolerance. For details, please refer to
Disclaimer.
Related Articles
Crypto consolidates as volatility cools and futures markets tilt bearish
The crypto market continued to exhibit signs of choppiness on Friday, with bitcoin BTC$67,135.03 trading at $67,000 in the middle of a trading range that spans back to early February.
A selection of altcoins picked up during the lower liquidity Asia hours, prompting the likes of ALGO and RENDER to
CoinDesk45m ago
XRP Eyes $1.50 Breakout as Price Holds Critical Range
XRP trades in a tight range, testing support near $1.33 and resistance $1.40–$1.42.
A breakout above $1.50 could signal bullish momentum toward $1.52–$1.60.
Breakdown below $1.27 may extend the current downtrend and increase selling pressure.
Ripple’s XRP continues to trade within a
CryptoNewsLand1h ago
CryptoQuant: Ethereum derivatives market net traders trading volume turns positive, buyer pressure reaches $104 million
On April 4, CryptoQuant analyst Darkfrost posted a message, pointing out that the Ethereum derivatives market is showing a “structural change.” The net trader execution volume has turned positive for the first time, with buy-side pressure in control, which could help form a market bottom and may kick off a new round of upside.
GateNews1h ago
VanEck Research Director: BTC derivative protective demand hits the 99th percentile historically, signaling a potential contrarian long setup
VanEck Research head Matthew Sigel said that demand for hedging in the Bitcoin derivatives market has reached the 99th percentile in history, suggesting that it may be suitable to establish long positions. At the same time, he warned that high capital expenditures in the artificial intelligence sector could put pressure on the market, especially in the S&P 500.
GateNews3h ago
Bitcoin’s ‘no direction’ action may lead to heavier breakout: Analyst
Bitcoin's prolonged consolidation below $70,000 may indicate a potential rally, despite mixed analyst sentiment. While some predict a breakout, others warn of deeper bearish trends. Current trading is stagnant, with Bitcoin at $66,890.
Cointelegraph4h ago
