Irys was launched only a few hours ago, and its price has shown a significant early trading range. It is an L1 data chain designed to integrate on-chain data storage and smart contract execution, making it one of the most anticipated projects in this cycle. The potential airdrop-style supply unlock has also triggered early fluctuations, and the volume-weighted average price (VWAP) support level remains effective, with key price levels around $0.024 defining the first real trend after Irys's listing.
VWAP support and early buying power analysis
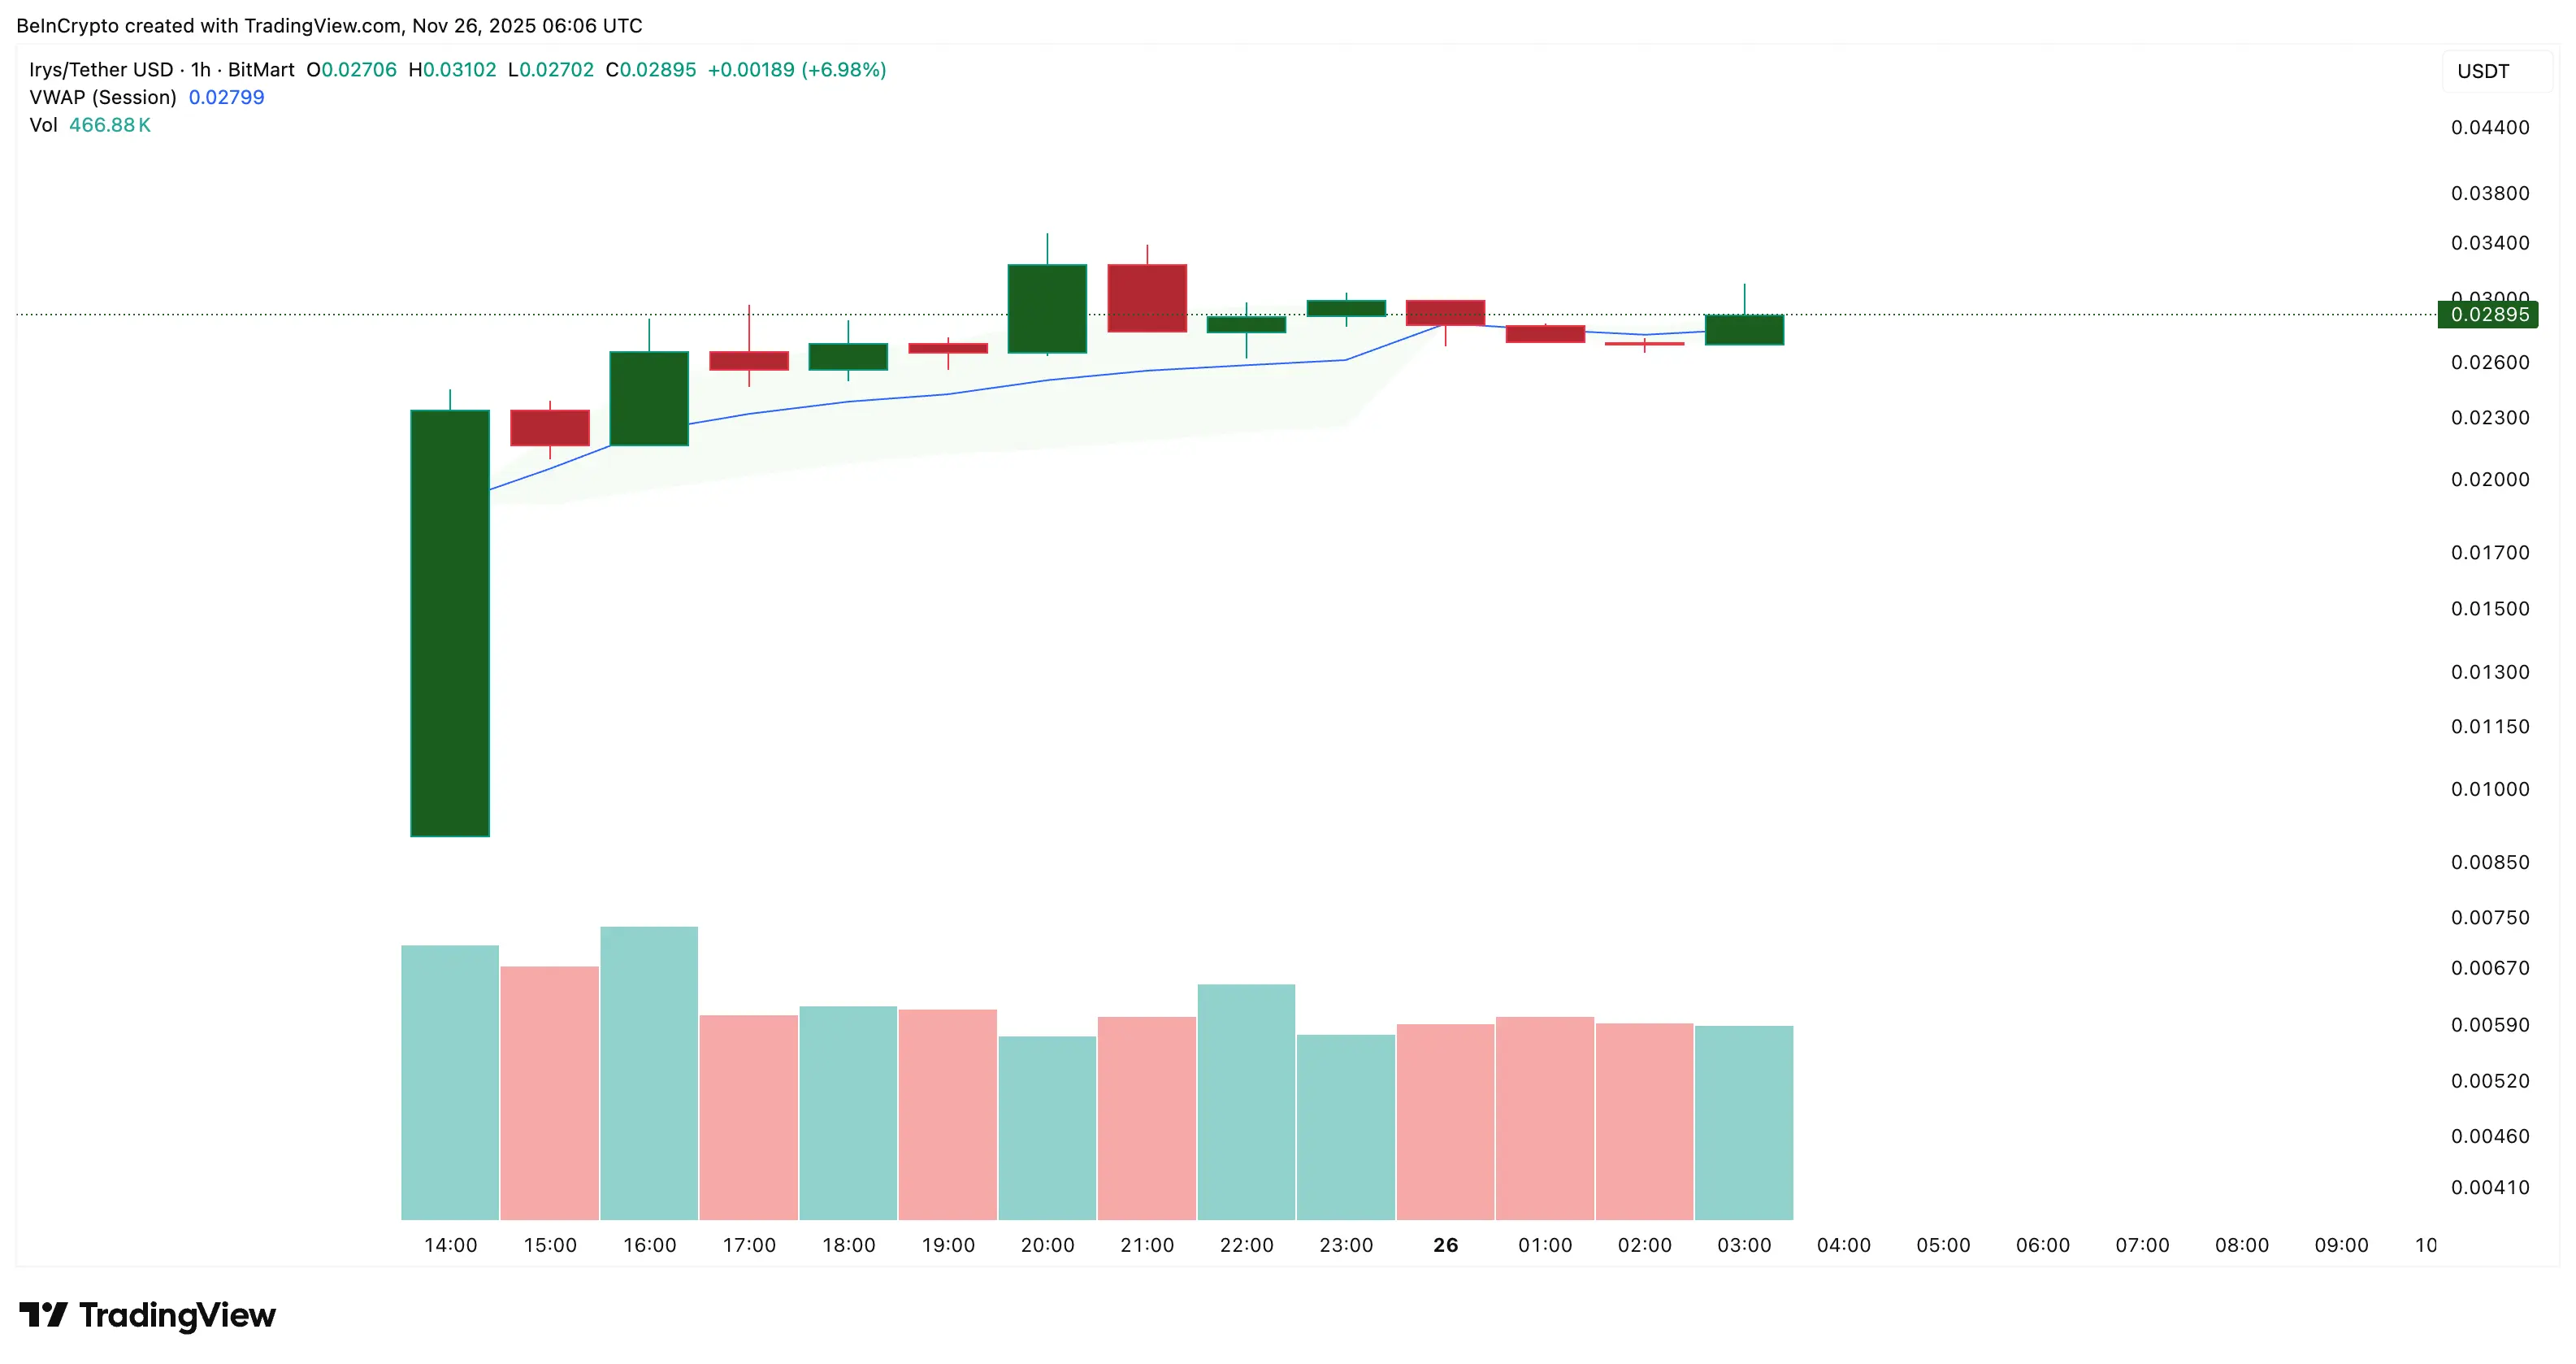
(Source: Trading View)
On the 1-hour chart, the price of Irys primarily uses the Volume Weighted Average Price (VWAP) as a reference indicator. VWAP tracks the average price of trading over a single day, but it assigns different weights based on the trading volume of each transaction, allowing it to better reflect where the “true” trading volume is concentrated. Since the market opened, the first large green candle closed above the VWAP line, initiating the initial uptrend.
The standard trading volume bar chart also confirms this: early K-line trading volume was high, followed by a decrease in volume, but it remained stable, with prices staying near or slightly above the VWAP. The last two K-lines briefly closed below this line, but the next K-line quickly regained lost ground. This indicates that, although there has not yet been a significant volume surge to confirm a strong trend, the current pullback below the VWAP is still supported by buying pressure.
The importance of VWAP in the trading of newly listed coins cannot be ignored. Due to the lack of historical price data, traditional moving averages and support/resistance levels have not yet formed, making VWAP the only reliable price anchoring indicator for market participants. When the price maintains above the VWAP, it indicates that buyers are willing to pay a premium above the average price, which is a bullish signal. Conversely, if the price continues to stay below the VWAP, it suggests that selling pressure is dominant.
Currently, the Irys price is able to quickly recover after briefly falling below the VWAP, indicating a market consensus on support at this price level. This kind of “pullback confirmation” trend is considered a healthy price behavior in technical analysis, as it allows early buyers to lock in profits while providing new buyers with a lower entry point, thus forming a more solid support base.
OBV negative value reveals concerns and Airdrop selling pressure
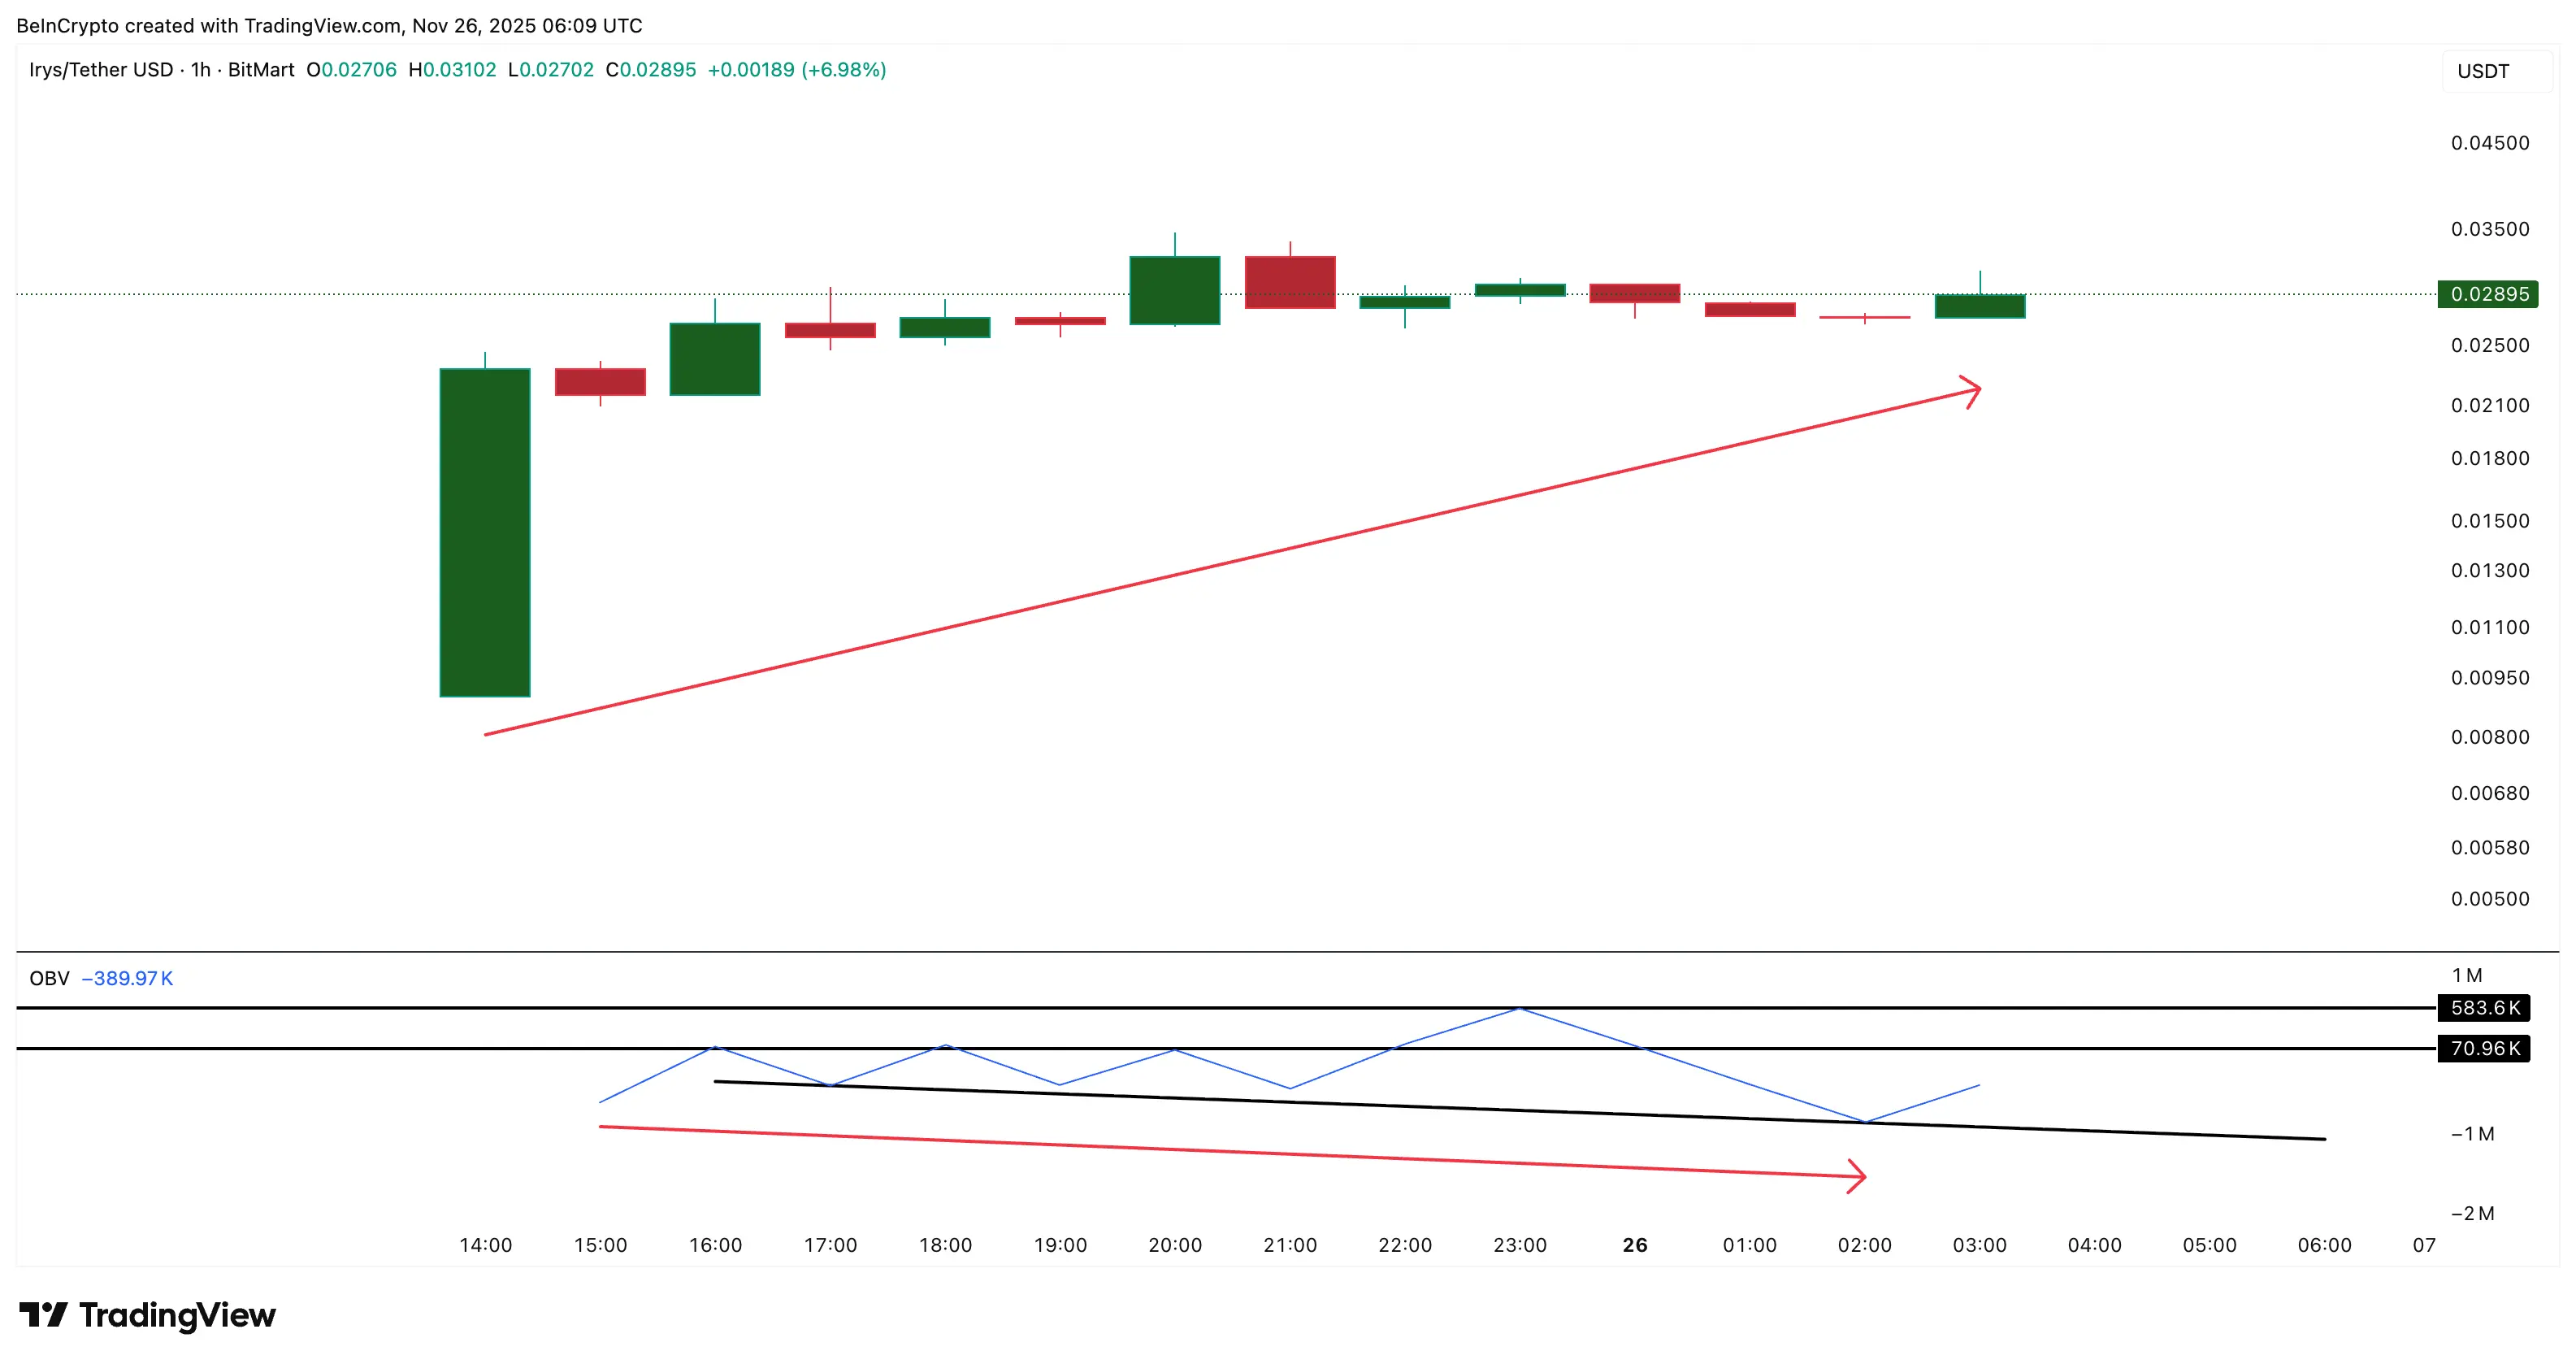
(Source: Trading View)
The On-Balance Volume (OBV) indicator on the 1-hour chart shows a different scenario. The On-Balance Volume (OBV) tracks the flow of actual trading volume in and out. Since its release, the price of Irys has created higher lows. However, the volume indicator (OBV) has created lower lows, which means that buyers currently control the price but have not yet gained control of the trading volume.
The OBV is currently in the negative territory, close to -389,970, with the first target level it must regain being 70,960. A breakout above this level, followed by a breakthrough of the next range at 583,600, would indicate the formation of a valid higher high pattern. This would confirm a reversal of the trading volume support on the hourly chart. The possibility of early Irys Airdrop distribution also explains the initial negative OBV, as early holders may have subscribed and sold a small amount.
The Warning Significance of OBV Divergence from Price
Price Trend: Creating higher lows, indicating a positive technical outlook
OBV Trend: Creating lower lows, indicating that Trading Volume has not kept up.
Divergence Meaning: Buyers control the price but sellers control the trading volume, indicating a weak trend.
Key Turning Point: OBV must break through 70,960 to confirm a real reversal.
The divergence between price and Trading Volume indicators is the most concerning signal in Irys's early trading. In a healthy uptrend, new price highs should be accompanied by new highs in OBV, indicating that each price increase has real buying support. The current divergence suggests that Irys's rise may rely more on a few large orders or speculative buying, rather than broad market participation.
VWAP and OBV combined can present a complete picture of the market. VWAP tells us where most of the trading occurs, while OBV shows who is actually controlling the trading volume. Currently, the price is maintained above VWAP, but OBV still lags behind. Therefore, the next price movement depends on whether the Trading Volume will flow back to the buyers.
0.024 US key support and bullish-bearish dividing line
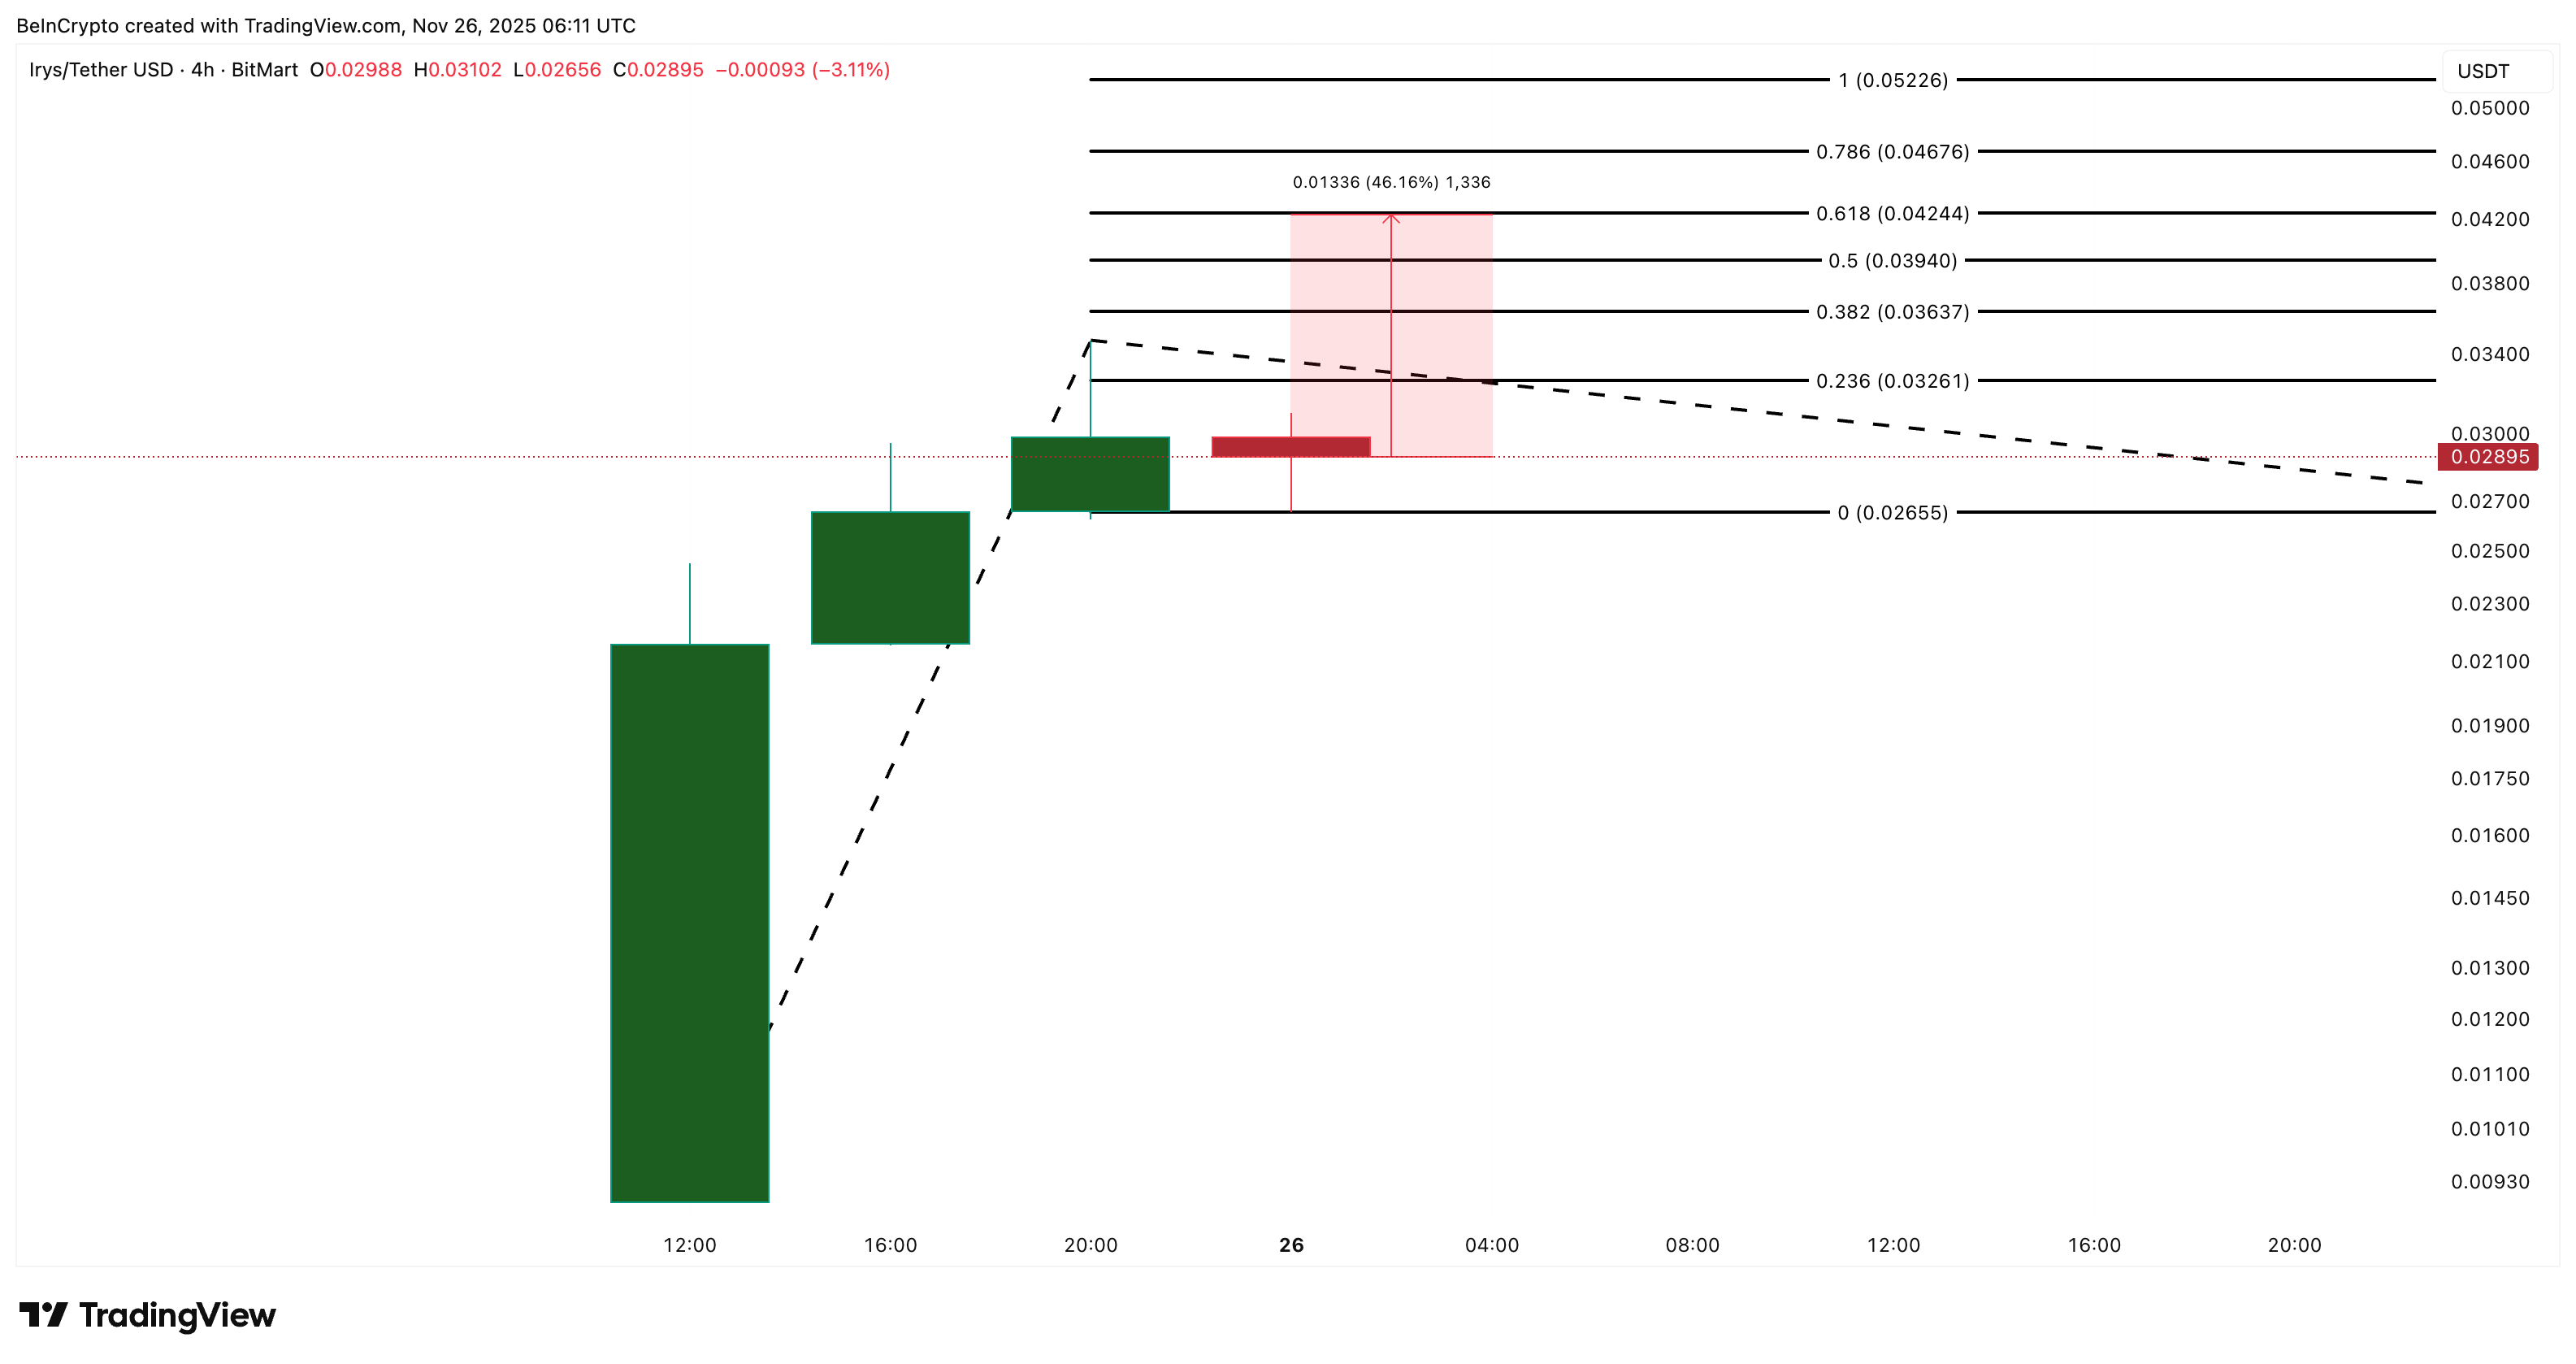
(Source: Trading View)
The Irys 4-hour price chart shows a brand new trend-based Fibonacci layout. The key price levels around $0.024 define the first real trend after the listing of Irys. This price level is not chosen randomly, but is derived from technical analysis of the early trading range as a crucial dividing point.
The immediate target for an upward move is at $0.032, followed by $0.039, while the earliest strong resistance level is at $0.042. The last resistance level is close to the 0.618 Fibonacci retracement level, which is often where newly listed stocks encounter their first real sell wall. If momentum strengthens, $0.052 will still be the highest extension price for the first stage. However, this requires a strong performance of OBV and expansion of VWAP support, not just isolated green candles.
On the downside, the key support level is at 0.024 USD, with deeper support levels at 0.018 USD and then 0.014 USD. A drop below 0.018 USD could even see it testing 0.009 USD. This would indicate that the price trend after the launch of Irys is turning into a full retracement. However, this also means that the OBV may have broken below its upward trend line.
Key Price Level Roadmap
Upward Path: $0.032 (First Target) → $0.039 (Second Target) → $0.042 (Golden Ratio Resistance) → $0.052 (Extension Target)
Downward Path: $0.024 (current key support) → $0.018 (deep support) → $0.014 (secondary support) → $0.009 (extreme downward target)
The resistance level at 0.042 USD is particularly worth noting, as it is close to the 0.618 Fibonacci retracement level. In technical analysis, 0.618 is one of the most important golden ratio levels, often marking key turning points in trends. For newly listed tokens, this level is typically the area where early buyers start to take profits, as they have already gained substantial returns and wish to lock in their profits.
Airdrop supply unlocks the double-edged sword effect
The potential airdrop-like supply unlock also signifies that Irys's price is likely to experience significant early fluctuations. This mechanism is becoming increasingly common in cryptocurrency projects, but its impact on prices is often two-sided. On one hand, airdrops can quickly establish a broad base of token holders and enhance project visibility. On the other hand, users who receive tokens for free often lack a cost basis, making them more likely to choose to sell off when prices see any increase.
The possibility of early Irys Airdrop distribution explains the phenomenon of OBV being negative. When a large number of airdrop tokens are unlocked immediately after going online, these holders face the temptation to realize gains immediately. Since their cost of acquiring the tokens is zero, any price is pure profit, which creates natural selling pressure. This selling pressure is particularly evident in the early stages after going online, as liquidity has not yet been fully established, and a large number of sell orders can lead to severe price fluctuations.
However, the Airdrop selling pressure is not a permanent phenomenon. Over time, airdrop holders who are willing to sell at low prices will gradually exit, and the remaining holders are often long-term supporters who have confidence in the project. This process of “weak hands exiting” is painful, but it is necessary for the long-term healthy development of the price. Once the main airdrop selling pressure is released, the price structure of Irys will become more stable.
Trading Volume is the ultimate deciding factor
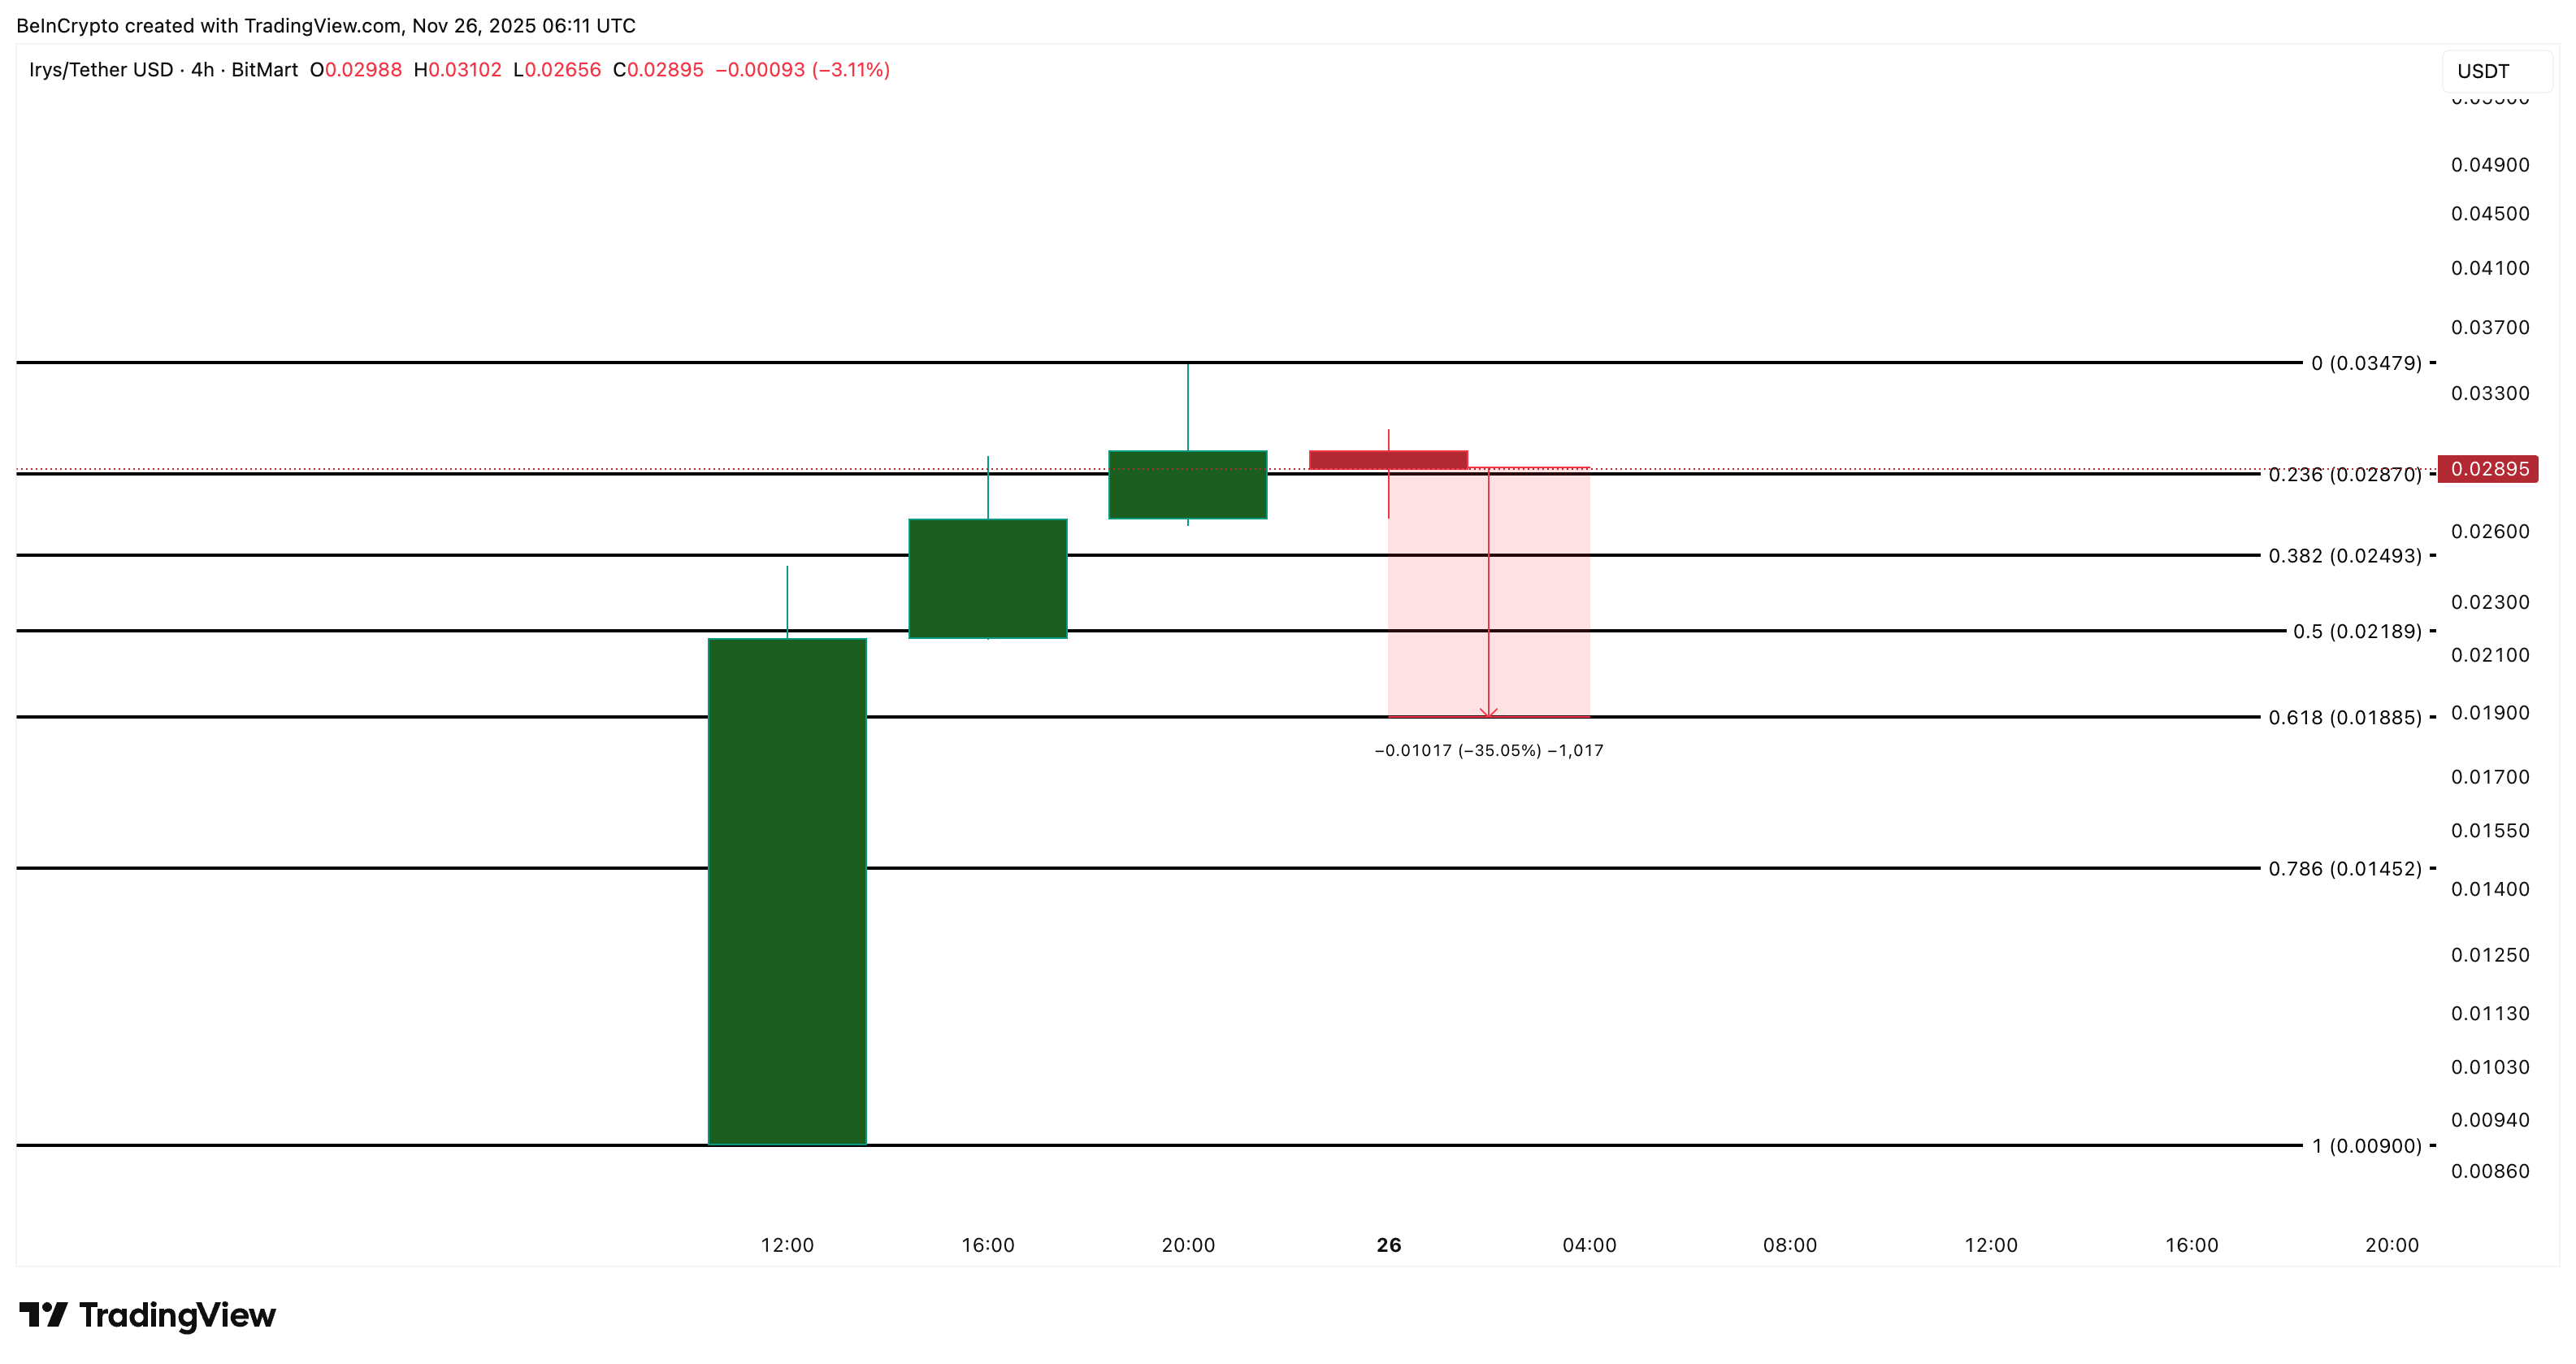
(Source: Trading View)
Currently, the trading price of Irys is at the middle of this wide range, and two outcomes may occur. The early trend is strong, but the trading volume indicates a cautious start. A support at the volume-weighted average price (VWAP) and an improvement in the on-balance volume (OBV) will open up space for upward movement. However, a weakening of the trading volume and a drop below 0.018 USD will allow sellers to dominate.
The early trading range for Irys is relatively large, and both outcomes are uncertain. This kind of uncertainty is the norm for all new coins when they are listed. The lack of historical price data means that the market is discovering prices in real-time, with each transaction contributing to the establishment of a value consensus for this token. In this process, trading volume is the most important confirmation indicator.
If the OBV can rebound from the current -389,970 and break through 70,960, coupled with the price breaking through $0.024 and stabilizing, Irys will confirm the first stage of the upward trend. In this scenario, the target levels of $0.032 and $0.039 will become realistic short-term goals. Conversely, if the Trading Volume continues to be weak, the OBV further declines, and the price falls below $0.018, the market will shift into a full retracement mode, preparing for a deeper bottoming.
