On September 17, the price of Bitcoin successfully broke through the key resistance level of $116,000, with long positions targeting the psychological barrier of $120,000. Meanwhile, Ethereum and Ripple also held above the key support level, showing strong rebound potential. As the Federal Reserve is set to announce its interest rate decision in the early hours of September 18, the three major Crypto Assets may face significant Fluctuation, presenting important trading opportunities for investors.
Bitcoin breaks through key resistance level, target of $120,000 in sight
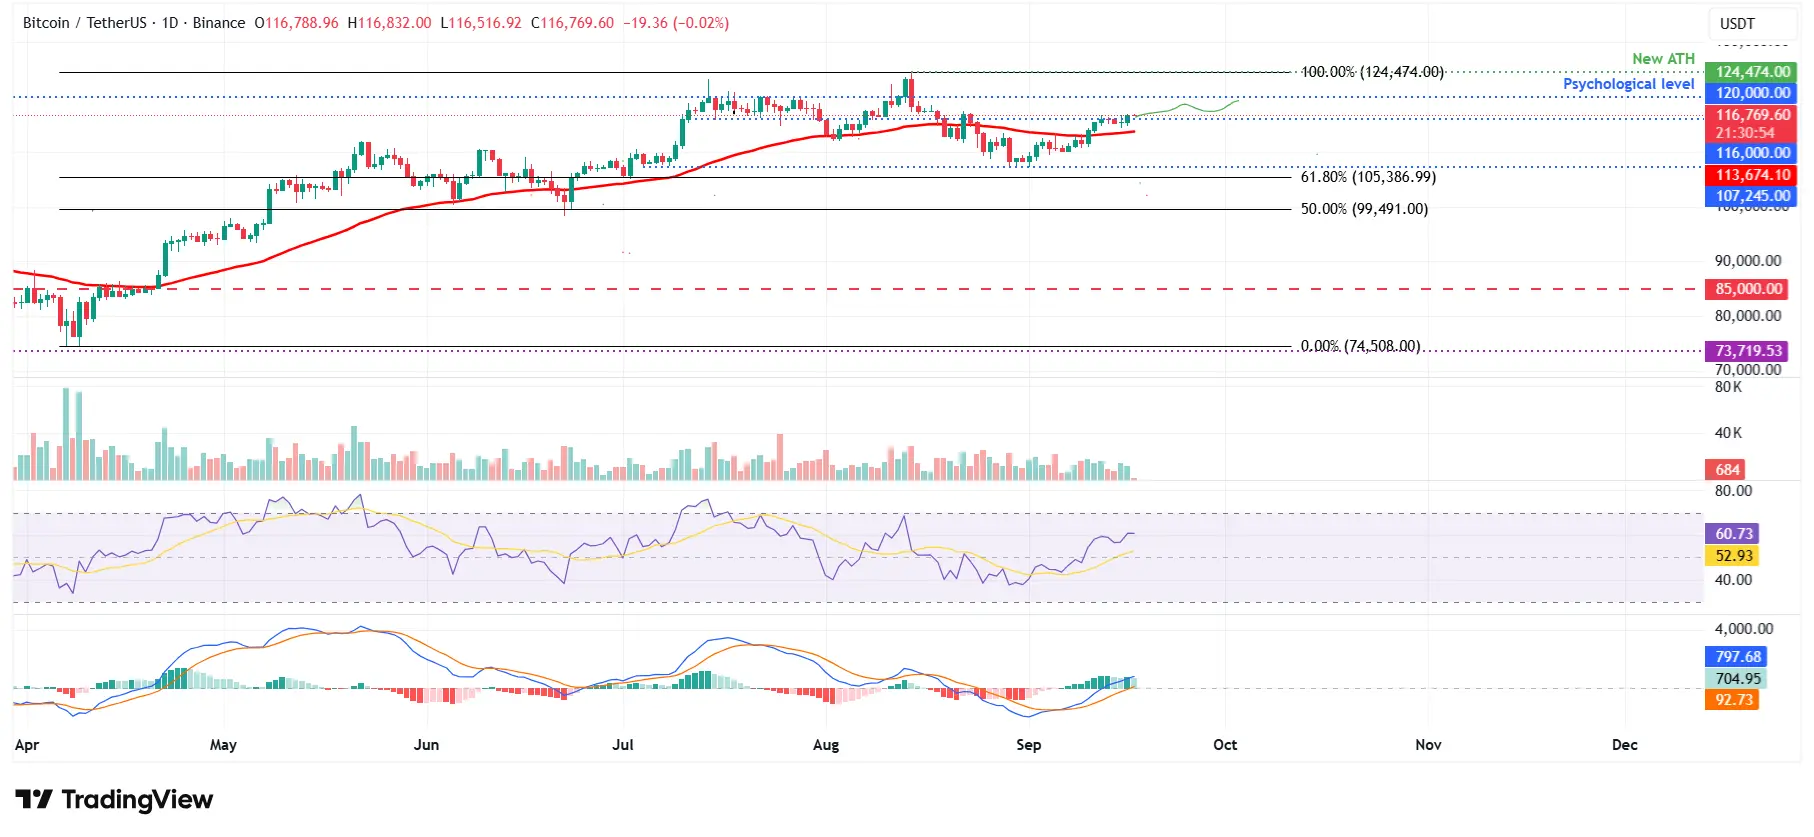
(Source: Trading View)
After hovering below the resistance level of 116,000 USD for several days, the price of Bitcoin finally broke through and held above this key level on September 16. As of September 17, BTC is trading at approximately 116,700 USD, demonstrating a sustained upward momentum.
On the technical side, the daily chart relative strength index (RSI) reading is 60, clearly above the neutral level of 50, indicating that bullish momentum is strengthening. The Moving Average Convergence Divergence (MACD) has remained effective since forming a bullish crossover on September 6, further supporting the continuation of the upward trend.
If BTC can hold above the support level of 116,000 USD, long positions are likely to target the psychological barrier of 120,000 USD. However, if the price falls below 116,000 USD, it could lead to a pullback to the 50-day exponential moving average of 113,674 USD.
Key price level:
Current Price: 116,700 USD
Key support: $116,000
Secondary support: $113,674 (50-day EMA)
Upward target: $120,000
Ethereum holds above the key support level, ready to challenge the historical high again
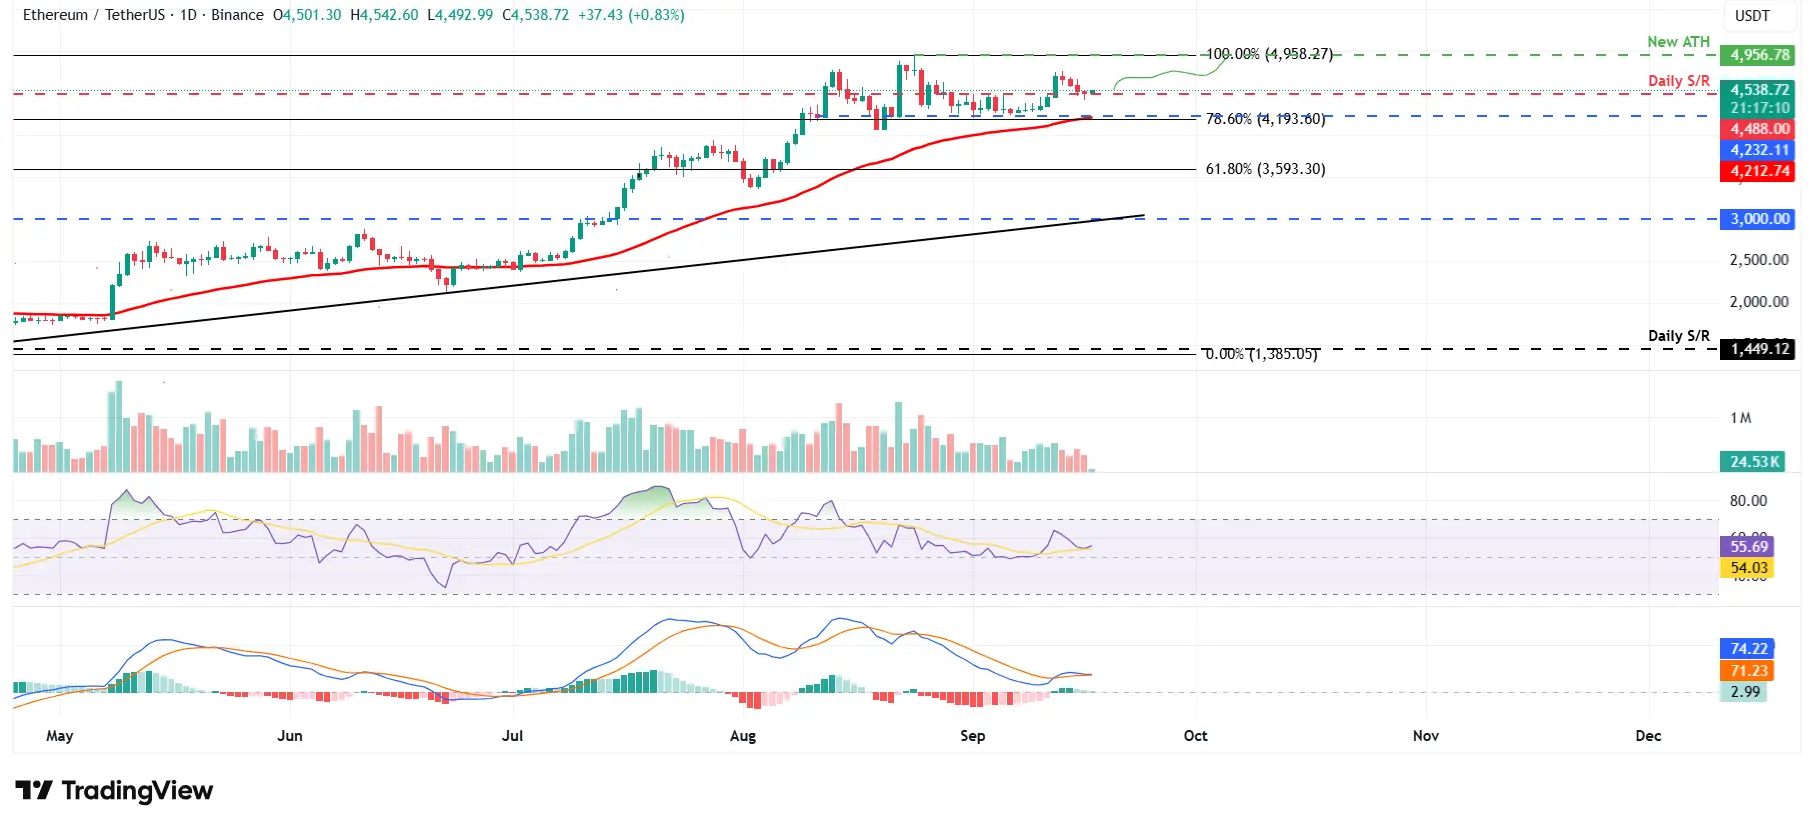
(Source: Trading View)
The price of Ethereum broke through the upper boundary of the consolidation range at $4,488 last Friday, experienced a brief pullback, but successfully retested and held above this key support level on Tuesday. Currently, ETH is trading at around $4,538, slightly above the support level.
The daily chart RSI reading is 55, maintaining above the midpoint, indicating slight bullish momentum. Although the MACD line is converging, suggesting some hesitation in the market, the overall technical outlook remains positive.
If ETH can hold above the support level of $4,488, the price is expected to challenge the historical high of $4,956 again. Conversely, if it falls below the support level, it may continue to decline to the lower boundary of the consolidation range at $4,232.
Key price level:
Current Price: 4,538 USD
Key support: $4,488
Secondary support: $4,232
Upside target: $4,956 (historical high)
Ripple descending wedge breakout, $3.40 in sight
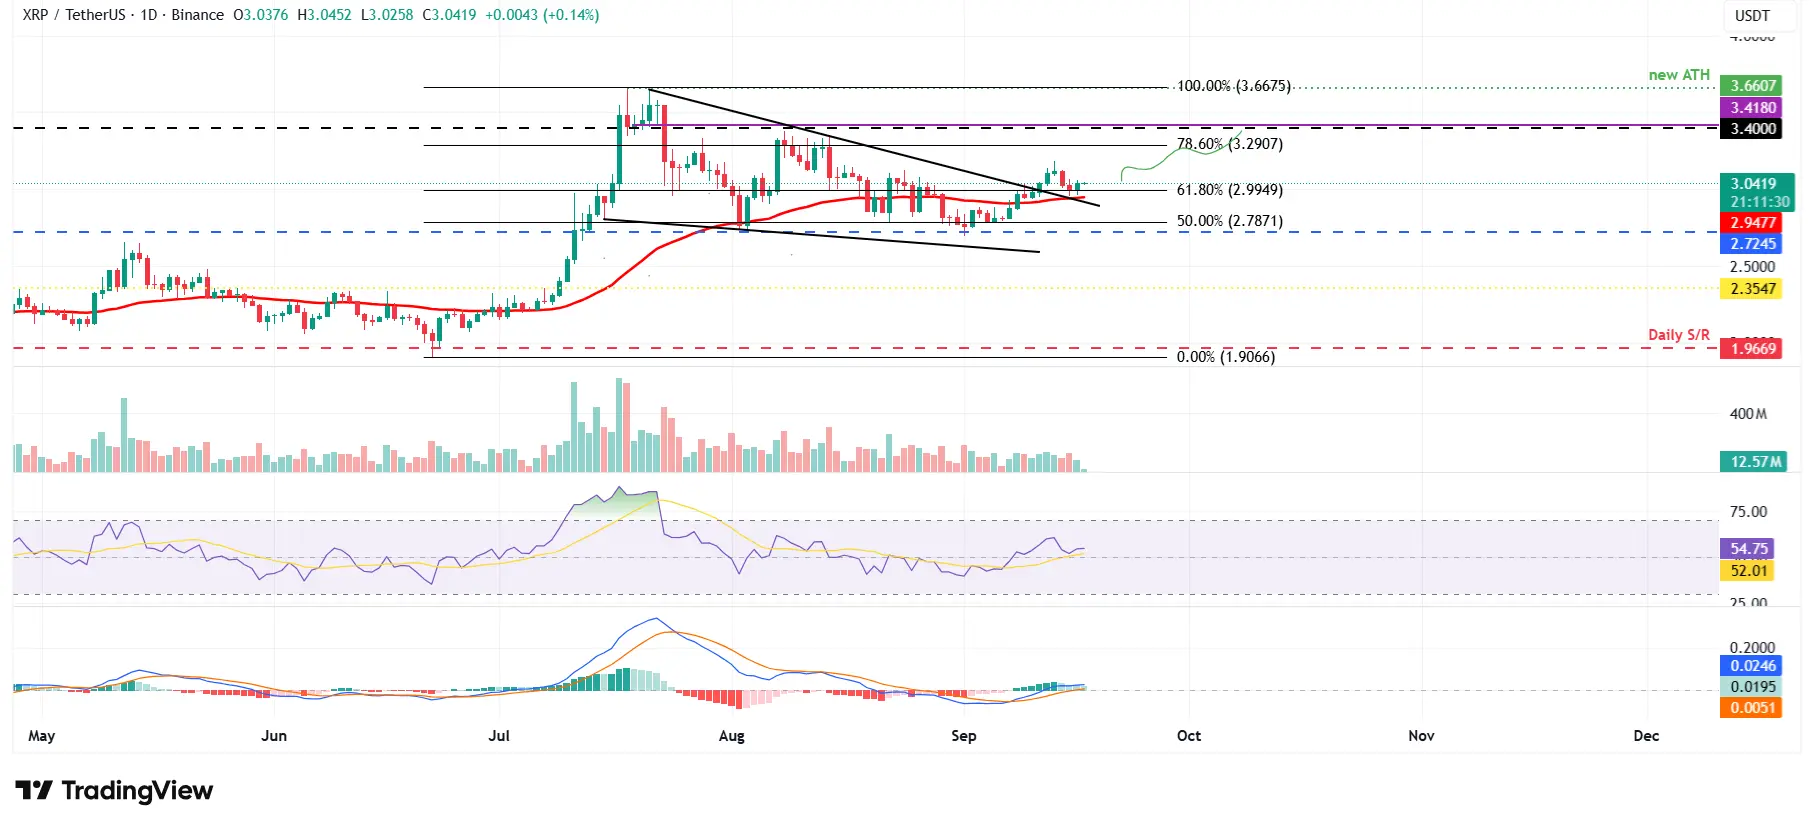
(Source: Trading View)
The price of Ripple successfully broke through the descending wedge pattern formed in mid-July on September 11, a technical pattern that usually indicates a bullish reversal. Although XRP briefly pulled back to the breakout point of about $2.99 at the start of this week, it subsequently showed rebound momentum and is currently trading at around $3.04.
The daily chart RSI reading is 54, above the neutral level of 50, indicating slight bullish momentum. Similar to Bitcoin, the MACD indicator for XRP also supports the bullish view.
If XRP can maintain its upward momentum, the price is expected to advance towards the daily resistance level of $3.40. However, if a pullback occurs, it may drop to the support level of $2.94 at the 50-day EMA.
Key price level:
Current Price: 3.04 USD
Key support: 2.99 USD
Secondary support: $2.94 (50-day EMA)
Upside target: 3.40 USD
The Federal Reserve (FED) interest rate decision will be announced on September 17, which may have a significant impact on the Crypto Assets market. Investors should closely monitor market trends and seize potential trading opportunities.
Disclaimer: The information on this page may come from third parties and does not represent the views or opinions of Gate. The content displayed on this page is for reference only and does not constitute any financial, investment, or legal advice. Gate does not guarantee the accuracy or completeness of the information and shall not be liable for any losses arising from the use of this information. Virtual asset investments carry high risks and are subject to significant price volatility. You may lose all of your invested principal. Please fully understand the relevant risks and make prudent decisions based on your own financial situation and risk tolerance. For details, please refer to
Disclaimer.
Related Articles
Tom Lee's Bitmine Acquires 40,000 ETH Worth $82.07 Million
Gate News message, Tom Lee's Bitmine purchased an additional 40,000 ETH valued at $82.07 million from centralized exchanges today. The transaction marks another significant ETH accumulation by the firm.
GateNews1h ago
Ethereum Foundation stakes another $93 million ether, reaching its 70,000 ETH target
The Ethereum Foundation staked $93 million in ether, reaching nearly $143 million in total staked ETH, almost fulfilling its 70,000 ETH target. This shift to staking generates yield for funding operations without selling assets, although some ETH remains unstaked.
CoinDesk2h ago
Early ETH Accumulation Hints at Breakout—Can Momentum Hold?
Ethereum shows early accumulation, with most holders near breakeven and selling pressure easing.
Taker Buy/Sell Ratio rising indicates growing demand and selective buying across exchanges.
Sustained momentum above key levels could trigger a breakout toward higher price targets.
At press
CryptoNewsLand3h ago
$ETH Whale Pulls $82M From FalconX, Market Speculates Tom Lee Connection
An Ethereum whale withdrew $82M in ETH from FalconX, increasing their holdings to 40,000 ETH. The transaction pattern resembles Bitmine's, sparking speculation about Tom Lee's involvement. Traders are monitoring its market impact.
BlockChainReporter3h ago
Ethereum Revisits $2,000 While Smart Money Turns to BlockchainFX, the Best Crypto Presale Approac...
Twelve times. That’s how many times Ethereum has touched $2,000 since April 2021, and somehow April 2026 is on that list too. While ETH holders stare at the same number they’ve been staring at for five years, a different crowd is moving quietly and deliberately into BlockchainFX (BFX), a
BlockChainReporter5h ago
Naoris Protocol's quantum-resistant blockchain goes live as Bitcoin and Ethereum face 'Q-Day' threats
Naoris Protocol launched a quantum-resistant blockchain, designed to secure transactions against future quantum threats. It utilizes post-quantum cryptography and has validated over 100 million transactions, preparing to protect digital assets despite vulnerabilities in existing systems like Bitcoin and Ethereum.
CoinDesk5h ago
