Trade
Basic
Futures
Futures
Hundreds of contracts settled in USDT or BTC
TradFi
Gold
Trade global traditional assets with USDT in one place
Options
Hot
Trade European-style vanilla options
Unified Account
Maximize your capital efficiency
Demo Trading
Futures Kickoff
Get prepared for your futures trading
Futures Events
Participate in events to win generous rewards
Demo Trading
Use virtual funds to experience risk-free trading
Earn
Launch
CandyDrop
Collect candies to earn airdrops
Launchpool
Quick staking, earn potential new tokens
HODLer Airdrop
Hold GT and get massive airdrops for free
Launchpad
Be early to the next big token project
Alpha Points
Trade on-chain assets and enjoy airdrop rewards!
Futures Points
Earn futures points and claim airdrop rewards
Investment
Simple Earn
Earn interests with idle tokens
Auto-Invest
Auto-invest on a regular basis
Dual Investment
Buy low and sell high to take profits from price fluctuations
Soft Staking
Earn rewards with flexible staking
Crypto Loan
0 Fees
Pledge one crypto to borrow another
Lending Center
One-stop lending hub
VIP Wealth Hub
Customized wealth management empowers your assets growth
Private Wealth Management
Customized asset management to grow your digital assets
Quant Fund
Top asset management team helps you profit without hassle
Staking
Stake cryptos to earn in PoS products
Smart Leverage
New
No forced liquidation before maturity, worry-free leveraged gains
GUSD Minting
Use USDT/USDC to mint GUSD for treasury-level yields
More
# GATEPOST
37.07K
MarketLady
🚀 BTC $93K BREAKOUT? January 5 Market Alpha 📊
Bitcoin is starting the first full week of 2026 with a BANG. We just touched a multi-week high of $93,323! 📈 The bulls are clearly in control, but are we ready for $100K or a local top?
Here is the breakdown for the Gate.io Fam:
1️⃣ The Technical Setup (1H Chart)
• Resistance: $93,500. This is the big one. Flip this, and we enter the "FOMO Zone" toward $96K-$100K.
• Support: $91,500 is our immediate floor. If we lose it, look for a "Buy the Dip" opportunity at $88,200 (Major Whale Liquidity).
• RSI: Sitting at 64—strong momentum but not yet over
- Reward
- 9
- 8
- Repost
- Share
GorgeousQueen:
DYOR 🤓View More
Market Status: Are the Bulls Dominant?
Currently, the market is in the "short-term oversold rebound followed by bulls attempting to regain dominance" phase.
1. Support Confirmation: The 4-hour and 1-hour charts show that ETH has formed a clear double bottom or support stabilization in the 2886-2900 range.
2. Indicator Resonance:
• 1-hour/4-hour charts: Price has successfully broken through the middle band (BOLL) of the Bollinger Bands, MACD has completed a golden cross below the 0 line and started to expand, a typical rebound initiation signal.
• Daily chart: Price has retested the daily middl
ETH-2,98%
- Reward
- 2
- 2
- Repost
- Share
GateUser-4077d3f8 :
:
Both double bottoms have been broken through.View More
Market Status: Are the Bulls Dominant?
Currently, the market is in the "short-term oversold rebound followed by bulls attempting to regain dominance" phase.
1. Support Confirmation: The 4-hour and 1-hour charts show that ETH has formed a clear double bottom or support stabilization in the 2886-2900 range.
2. Indicator Resonance:
• 1-hour/4-hour charts: Price has successfully broken through the middle band (BOLL) of the Bollinger Bands, MACD has completed a golden cross below the 0 line and started to expand, a typical rebound initiation signal.
• Daily chart: Price has retested the daily middl
Currently, the market is in the "short-term oversold rebound followed by bulls attempting to regain dominance" phase.
1. Support Confirmation: The 4-hour and 1-hour charts show that ETH has formed a clear double bottom or support stabilization in the 2886-2900 range.
2. Indicator Resonance:
• 1-hour/4-hour charts: Price has successfully broken through the middle band (BOLL) of the Bollinger Bands, MACD has completed a golden cross below the 0 line and started to expand, a typical rebound initiation signal.
• Daily chart: Price has retested the daily middl
ETH-2,98%

- Reward
- 5
- 1
- Repost
- Share
CryptoSpecto :
:
good information🔥 #分享我的交易 | GT Futures Short Trade Review (Clean Setup) 🔥
Market: GT/USDT Perpetual
Trade Type: Futures (Short)
Leverage: 5×
Timeframe: 1H + 15M
Result: ✅ +5.8% account growth
---
📌 Trade Background
GT was showing a clear lower-high structure on the 1H timeframe after failing to break and hold above a key resistance zone around $8.45.
Each rebound came with declining volume, indicating weak bullish participation rather than genuine strength.
At the same time, funding remained positive, suggesting the majority of traders were still leaning long — a good contrarian signal.
---
🎯 Entry Logic
GT-2,14%
- Reward
- 2
- 1
- Repost
- Share
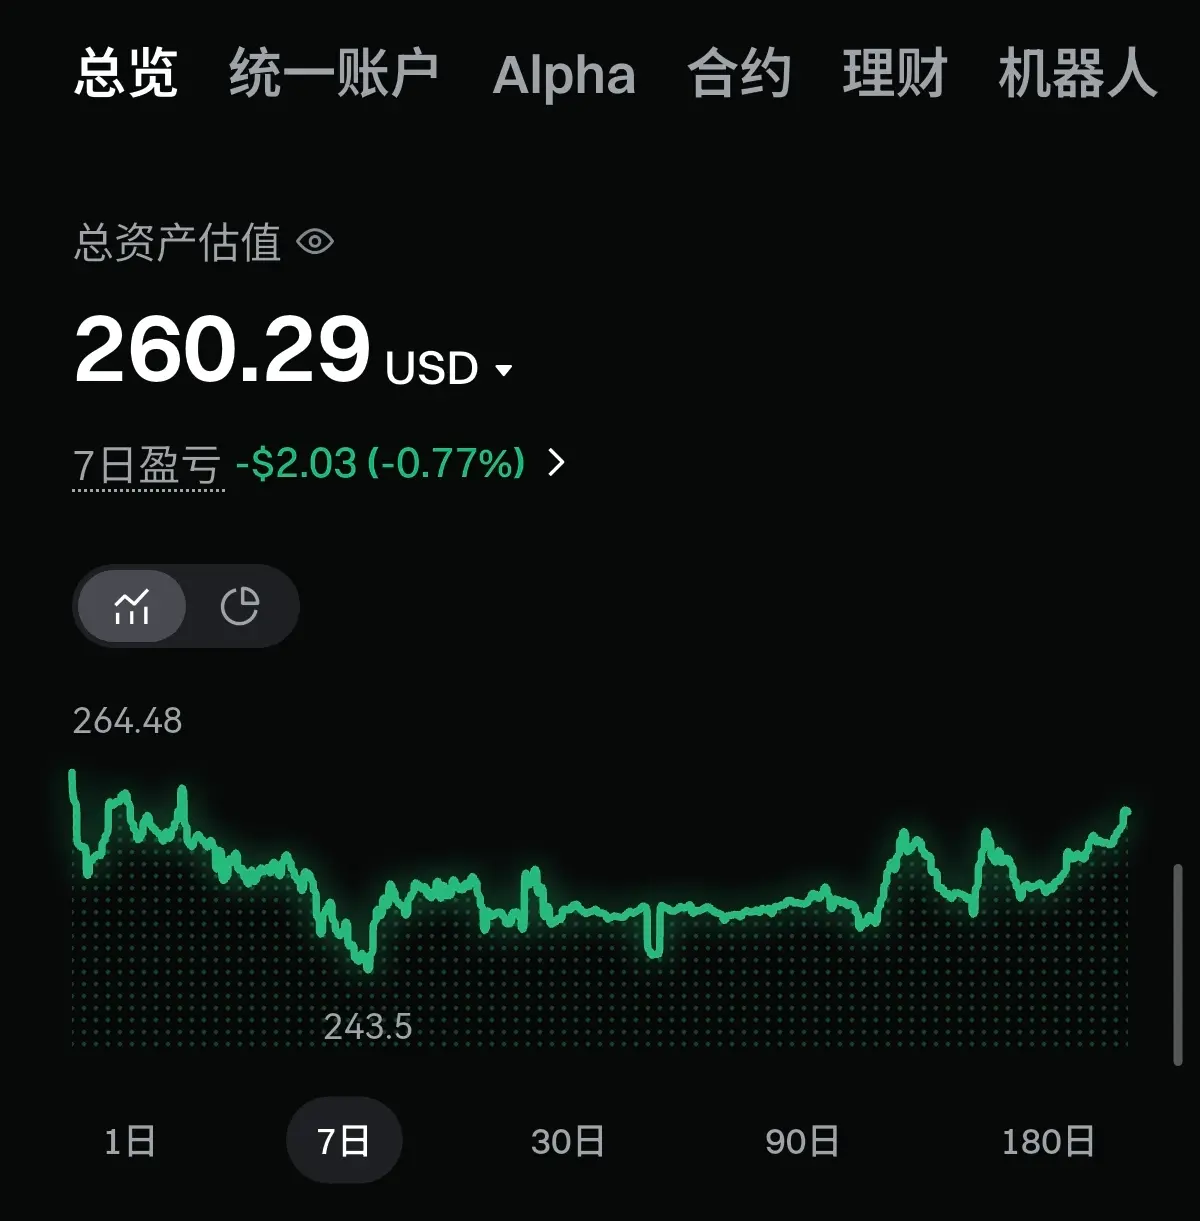
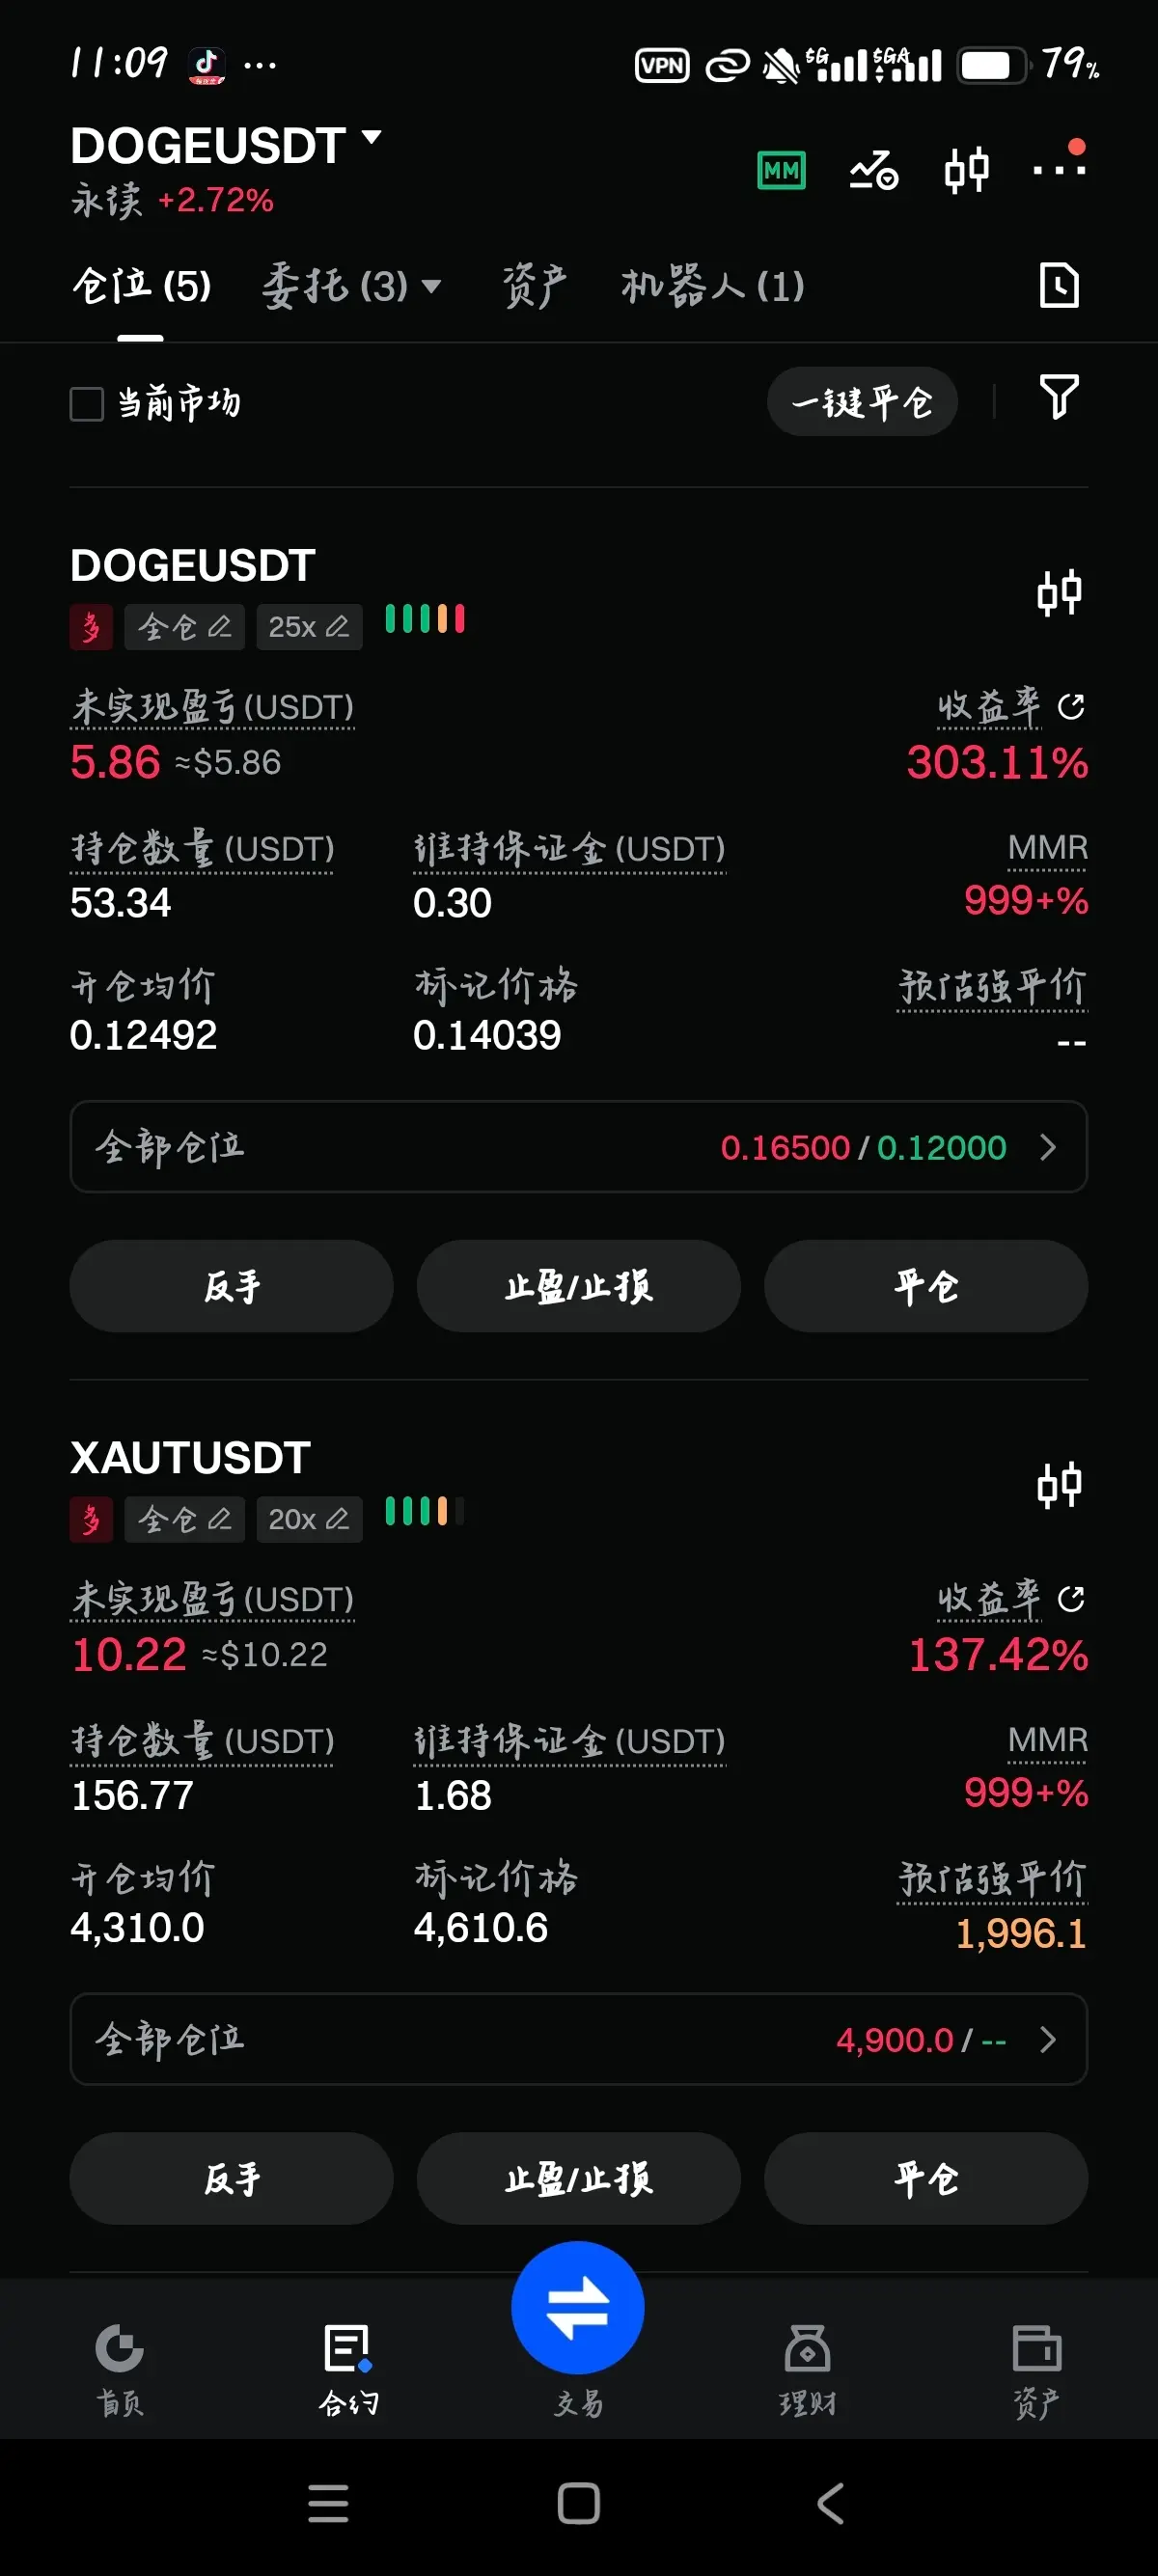
Challenge starting at 250U, where will I be after 1000 days?
Content:
Family members, officially setting a flag!
Using 250U to start a 1000-day trading challenge. Currently, the account has 260U. Although the past week has not seen much fluctuation, my mindset remains steady as an old dog. 🐶
If you have 250U, would you choose:
1️⃣ Go all-in with high leverage for extreme explosion?
2️⃣ Hold long-term spot positions, waiting for the next raging bull market?
3️⃣ Roll-over strategy, relying on compound interest to grow gradually?
I will update progress daily/weekly. Welcome everyone to watch
BTC-2,52%
- Reward
- 1
- Comment
- Repost
- Share
Market Status: Are the Bulls Dominant?
Currently, the market is in the "short-term oversold rebound followed by bulls attempting to regain dominance" phase.
1. Support Confirmation: The 4-hour and 1-hour charts show that ETH has formed a clear double bottom or support stabilization in the 2886-2900 range.
2. Indicator Resonance:
• 1-hour/4-hour charts: Price has successfully broken through the middle band (BOLL) of the Bollinger Bands, MACD has completed a golden cross below the 0 line and started to expand, a typical rebound initiation signal.
• Daily chart: Price has retested the daily middl
Currently, the market is in the "short-term oversold rebound followed by bulls attempting to regain dominance" phase.
1. Support Confirmation: The 4-hour and 1-hour charts show that ETH has formed a clear double bottom or support stabilization in the 2886-2900 range.
2. Indicator Resonance:
• 1-hour/4-hour charts: Price has successfully broken through the middle band (BOLL) of the Bollinger Bands, MACD has completed a golden cross below the 0 line and started to expand, a typical rebound initiation signal.
• Daily chart: Price has retested the daily middl
ETH-2,98%
- Reward
- 3
- 4
- Repost
- Share
Mr.LV:
New Year Wealth Explosion 🤑View More
Market Status: Are the Bulls Dominant?
Currently, the market is in the "short-term oversold rebound followed by bulls attempting to regain dominance" phase.
1. Support Confirmation: The 4-hour and 1-hour charts show that ETH has formed a clear double bottom or support stabilization in the 2886-2900 range.
2. Indicator Resonance:
• 1-hour/4-hour charts: Price has successfully broken through the middle band (BOLL) of the Bollinger Bands, MACD has completed a golden cross below the 0 line and started to expand, a typical rebound initiation signal.
• Daily chart: Price has retested the daily middl
Currently, the market is in the "short-term oversold rebound followed by bulls attempting to regain dominance" phase.
1. Support Confirmation: The 4-hour and 1-hour charts show that ETH has formed a clear double bottom or support stabilization in the 2886-2900 range.
2. Indicator Resonance:
• 1-hour/4-hour charts: Price has successfully broken through the middle band (BOLL) of the Bollinger Bands, MACD has completed a golden cross below the 0 line and started to expand, a typical rebound initiation signal.
• Daily chart: Price has retested the daily middl
ETH-2,98%

[The user has shared his/her trading data. Go to the App to view more.]
- Reward
- 24
- 10
- Repost
- Share
MagicalOldEight:
Very helpful post, thank you for sharing this information.View More
Market Status: Are the Bulls Dominant?
Currently, the market is in the "short-term oversold rebound followed by bulls attempting to regain dominance" phase.
1. Support Confirmation: The 4-hour and 1-hour charts show that ETH has formed a clear double bottom or support stabilization in the 2886-2900 range.
2. Indicator Resonance:
• 1-hour/4-hour charts: Price has successfully broken through the middle band (BOLL) of the Bollinger Bands, MACD has completed a golden cross below the 0 line and started to expand, a typical rebound initiation signal.
• Daily chart: Price has retested the daily middl
Currently, the market is in the "short-term oversold rebound followed by bulls attempting to regain dominance" phase.
1. Support Confirmation: The 4-hour and 1-hour charts show that ETH has formed a clear double bottom or support stabilization in the 2886-2900 range.
2. Indicator Resonance:
• 1-hour/4-hour charts: Price has successfully broken through the middle band (BOLL) of the Bollinger Bands, MACD has completed a golden cross below the 0 line and started to expand, a typical rebound initiation signal.
• Daily chart: Price has retested the daily middl
ETH-2,98%
- Reward
- like
- Comment
- Repost
- Share
🛑 Macro Outlook 2026: The Fed and Oil Drive the Markets
The future of US interest rates and geopolitical developments in Venezuela are keeping investors on high alert. Here's what to watch:
🏦 Interest Rate Scenarios (CME FedWatch):
January: Probability of rates remaining unchanged is 82.8%. The market has effectively priced in this scenario.
March: The real shift may begin here, with a split over a 25 basis point cut.
💡 Trader Tip: Stable interest rates mean continued positive pressure on $BTC and $GT, but any sudden cut will serve as fuel for altcoin growth.
🌎 Policy and Energy:
US pressu
View OriginalThe future of US interest rates and geopolitical developments in Venezuela are keeping investors on high alert. Here's what to watch:
🏦 Interest Rate Scenarios (CME FedWatch):
January: Probability of rates remaining unchanged is 82.8%. The market has effectively priced in this scenario.
March: The real shift may begin here, with a split over a 25 basis point cut.
💡 Trader Tip: Stable interest rates mean continued positive pressure on $BTC and $GT, but any sudden cut will serve as fuel for altcoin growth.
🌎 Policy and Energy:
US pressu


- Reward
- like
- Comment
- Repost
- Share
Current Market: Are the Bulls in Control?
Currently, the market is in the "Attempt by the bulls to regain control after a short-term oversold rebound."
1. Support Confirmation: The 4-hour and hourly charts show that ETH has formed a clear double bottom or stabilized at a support level.
2. Indicator Convergence:
• Hourly / 4-hour chart: The price successfully broke through the middle of the Bollinger (BOLL) range, and the MACD has completed a golden cross below zero and started to expand, which is a typical sign of a rebound beginning.
• Daily chart: After bouncing from the middle of the Bollin
ETH-2,98%
- Reward
- 2
- 1
- Repost
- Share
GateUser-40f776ca:
Bullish market at its peak 🐂Load More
Join 40M users in our growing community
⚡️ Join 40M users in the crypto craze discussion
💬 Engage with your favorite top creators
👍 See what interests you
Trending Topics
229.17K Popularity
52.79K Popularity
21.24K Popularity
16.95K Popularity
16.7K Popularity
91.51K Popularity
6.14K Popularity
11.35K Popularity
6.77K Popularity
4.09K Popularity
5.39K Popularity
15.09K Popularity
4.03K Popularity
22.12K Popularity
13.78K Popularity
News
View MoreBalancer: The white hat rescue fund application window for the V2 security incident on November 3rd is now open
3 m
TradeFi Downtrend Alert: U Drops Over 12%
10 m
Hyperliquid Strategies Announces Financial Report: Spent $129.5 million to acquire 5 million HYPE tokens, still holding $125 million in cash reserves
19 m
Data: 51,020,400 HOLO transferred out from an anonymous address, then routed through a relay and flowed into an anonymous address
27 m
Intercontinental Exchange launches seven CoinDesk Index cryptocurrency futures contracts
31 m
Pin