$SOL #IranDeploysMinesInStraitOfHormuz Here is a technical analysis of the SOL/USDT charts.
The Analysis: The Squeeze Before the Breakout
SOL/USDT, and the story they tell is one of compression, consolidation, and the impending potential for expansion. The market is coiling, and as traders, we need to be ready for the spring.
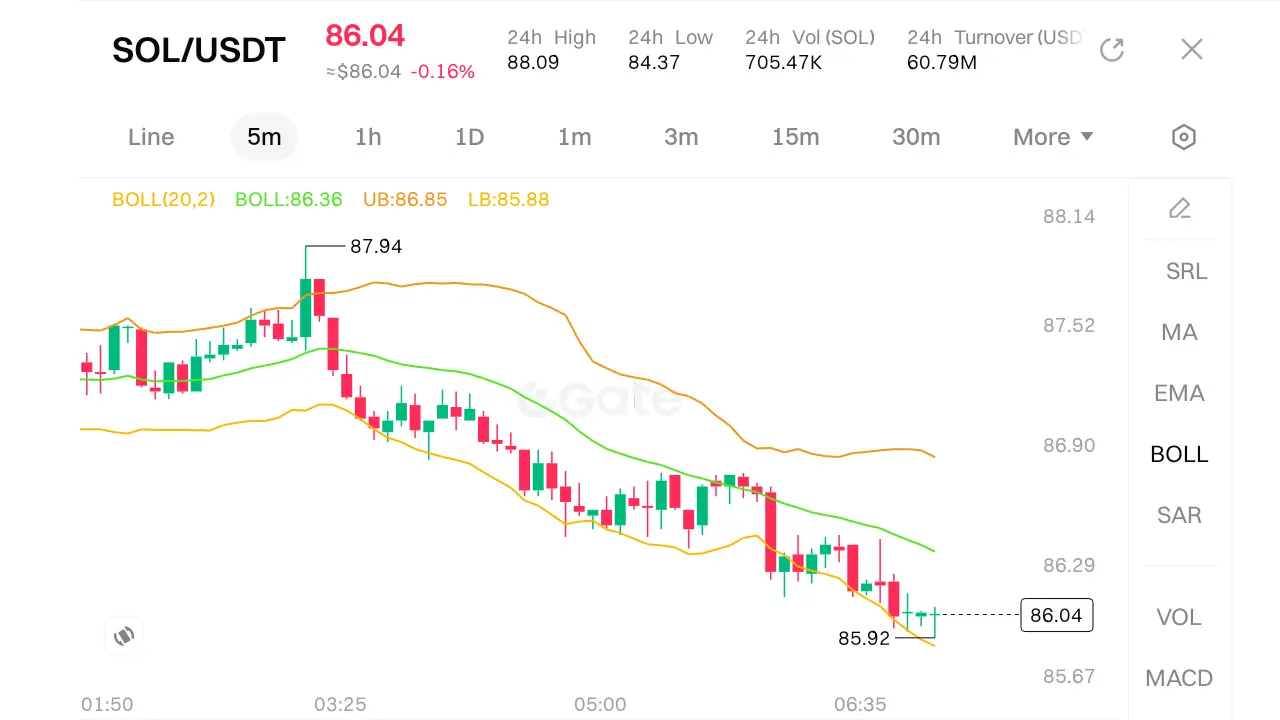
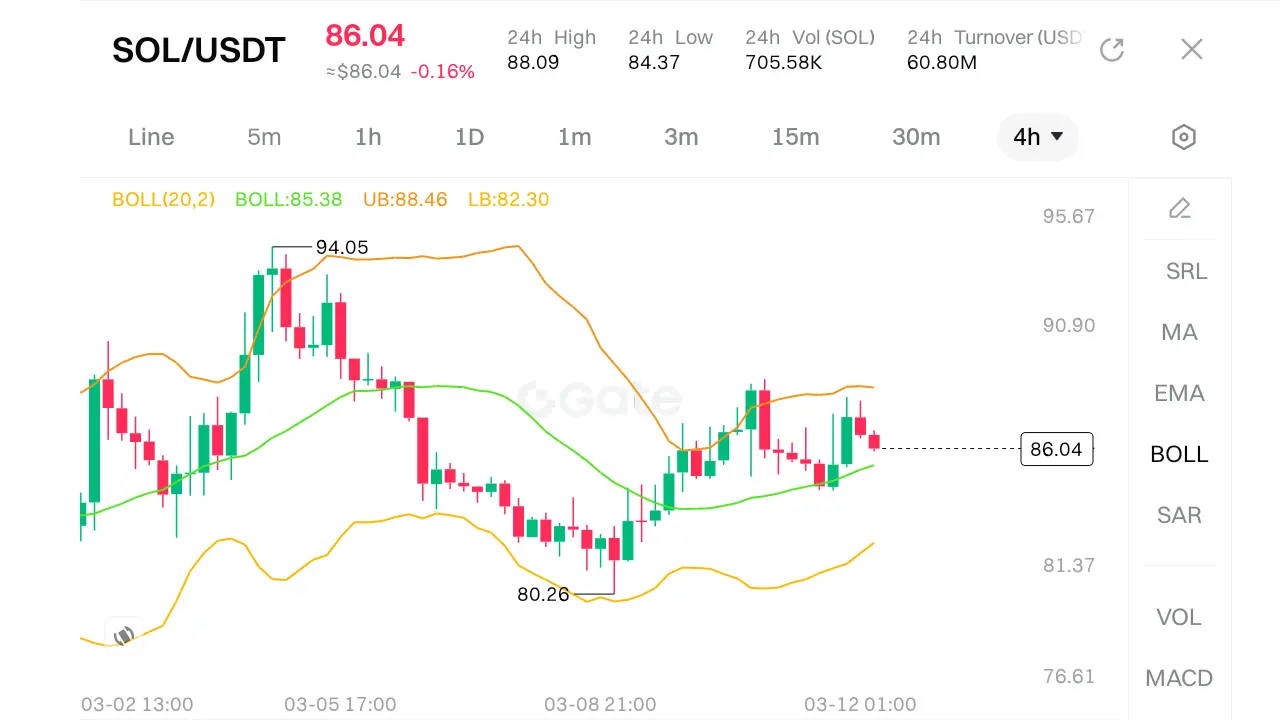
Chart 1: The High-Probability Scalp Setup.
This 4H chart is trader's edge for the immediate session. We are witnessing a classic Bollinger Band Squeeze on the lower timeframe.
· The Squeeze Play: The bands are tight, with the Upper Bollinger Band (UB) at $86.85** and th