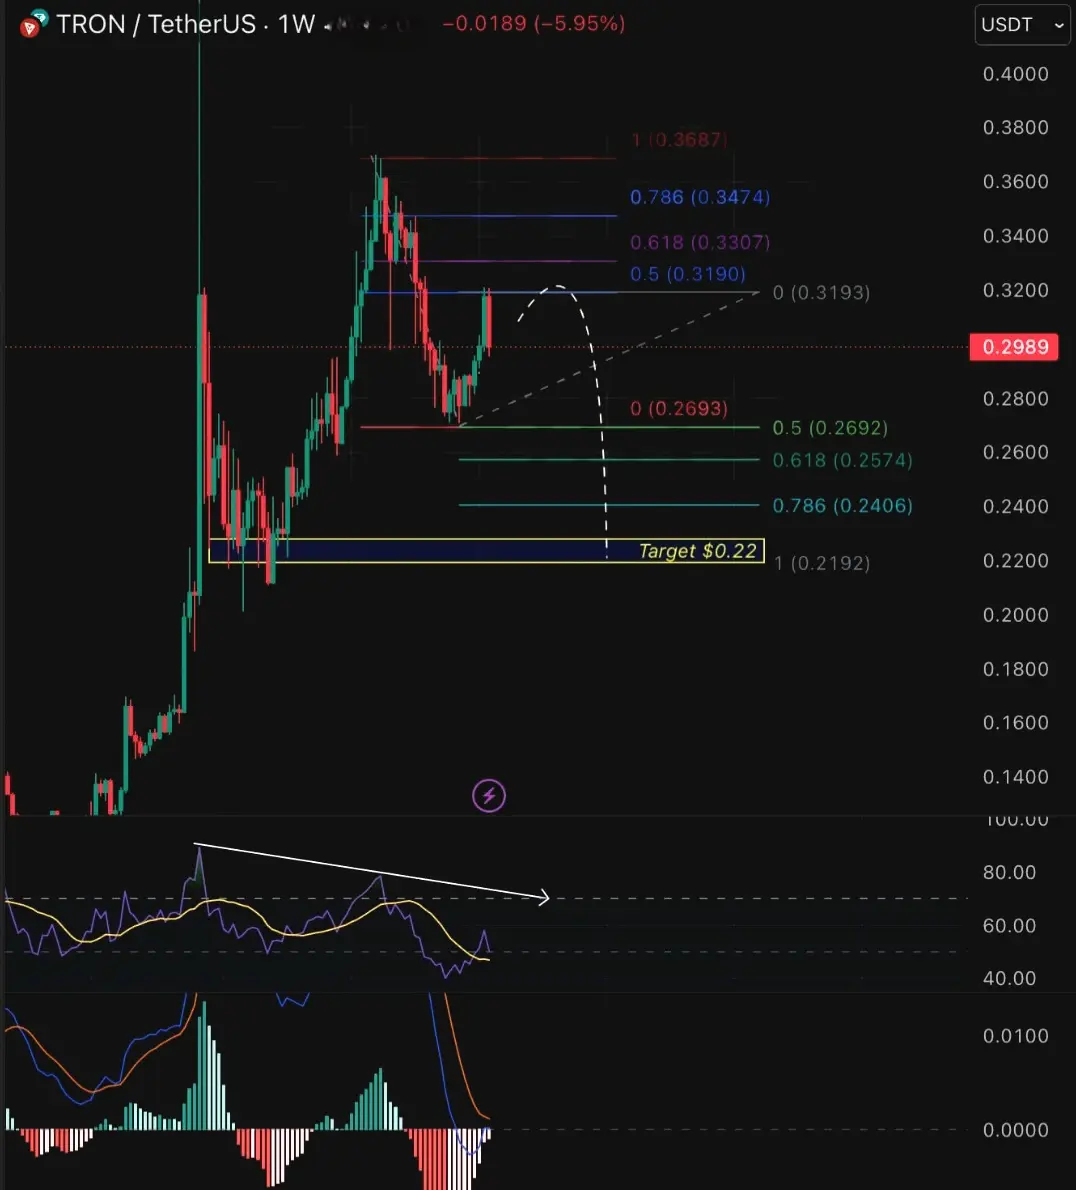
#TRXUSDT – Downtrend 📉
On the weekly timeframe, it appears that the
$TRX stock has reversed from an uptrend to a downtrend. The green candle that appeared last week may be a lower high, especially if this week closes lower.
The price was rejected at the 0.5 Fibonacci level. Using Fibonacci extension, the downside target is $0.22 (extension 1.0) – a strong previous support level.
The Relative Strength Index (RSI) shows bearish divergence: the price made a higher high, while the RSI made a lower low ⚠️
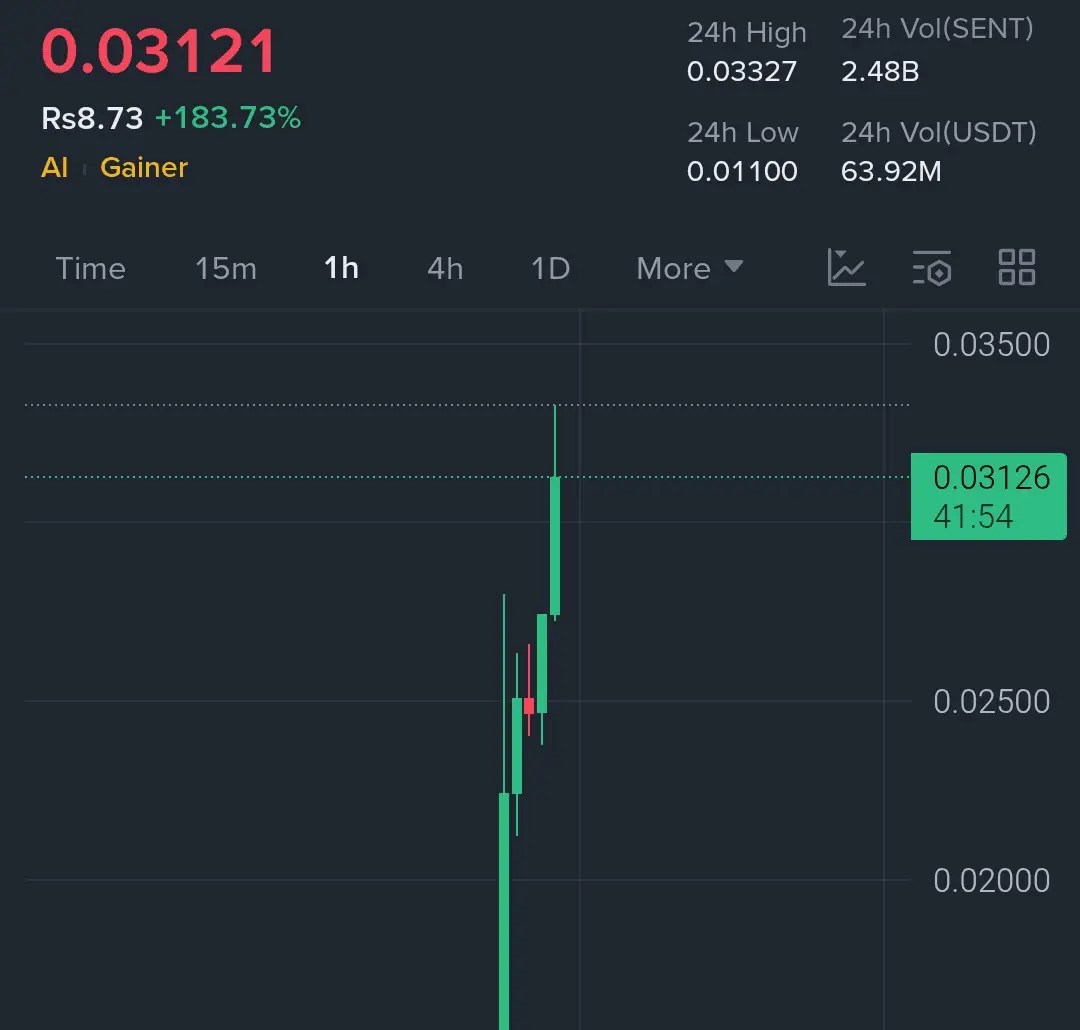
#TRX $TRX