Trade
Basic
Futures
Futures
Hundreds of contracts settled in USDT or BTC
Options
HOT
Trade European-style vanilla options
Unified Account
Maximize your capital efficiency
Demo Trading
Futures Kickoff
Get prepared for your futures trading
Futures Events
Participate in events to win generous rewards
Demo Trading
Use virtual funds to experience risk-free trading
Earn
Launch
CandyDrop
Collect candies to earn airdrops
Launchpool
Quick staking, earn potential new tokens
HODLer Airdrop
Hold GT and get massive airdrops for free
Launchpad
Be early to the next big token project
Alpha Points
NEW
Trade on-chain assets and enjoy airdrop rewards!
Futures Points
NEW
Earn futures points and claim airdrop rewards
Investment
Simple Earn
Earn interests with idle tokens
Auto-Invest
Auto-invest on a regular basis
Dual Investment
Buy low and sell high to take profits from price fluctuations
Soft Staking
Earn rewards with flexible staking
Crypto Loan
0 Fees
Pledge one crypto to borrow another
Lending Center
One-stop lending hub
VIP Wealth Hub
Customized wealth management empowers your assets growth
Private Wealth Management
Customized asset management to grow your digital assets
Quant Fund
Top asset management team helps you profit without hassle
Staking
Stake cryptos to earn in PoS products
Smart Leverage
NEW
No forced liquidation before maturity, worry-free leveraged gains
GUSD Minting
Use USDT/USDC to mint GUSD for treasury-level yields
More
Asiftahsin
[New Year Market] | Uncertainty emerges over the next Fed Chair: Kevin Hassett may be out — why is Kevin Warsh now the biggest dark horse?
995
- Reward
- 1
- 1
- Repost
- Share
LittleGodOfWealthPlutus :
:
2026 Prosperity Prosperity😘

- Reward
- like
- Comment
- Repost
- Share
汗血宝马
汗血宝马
Created By@gatefunuser_22b1
Listing Progress
100.00%
MC:
$63.07K
Create My Token
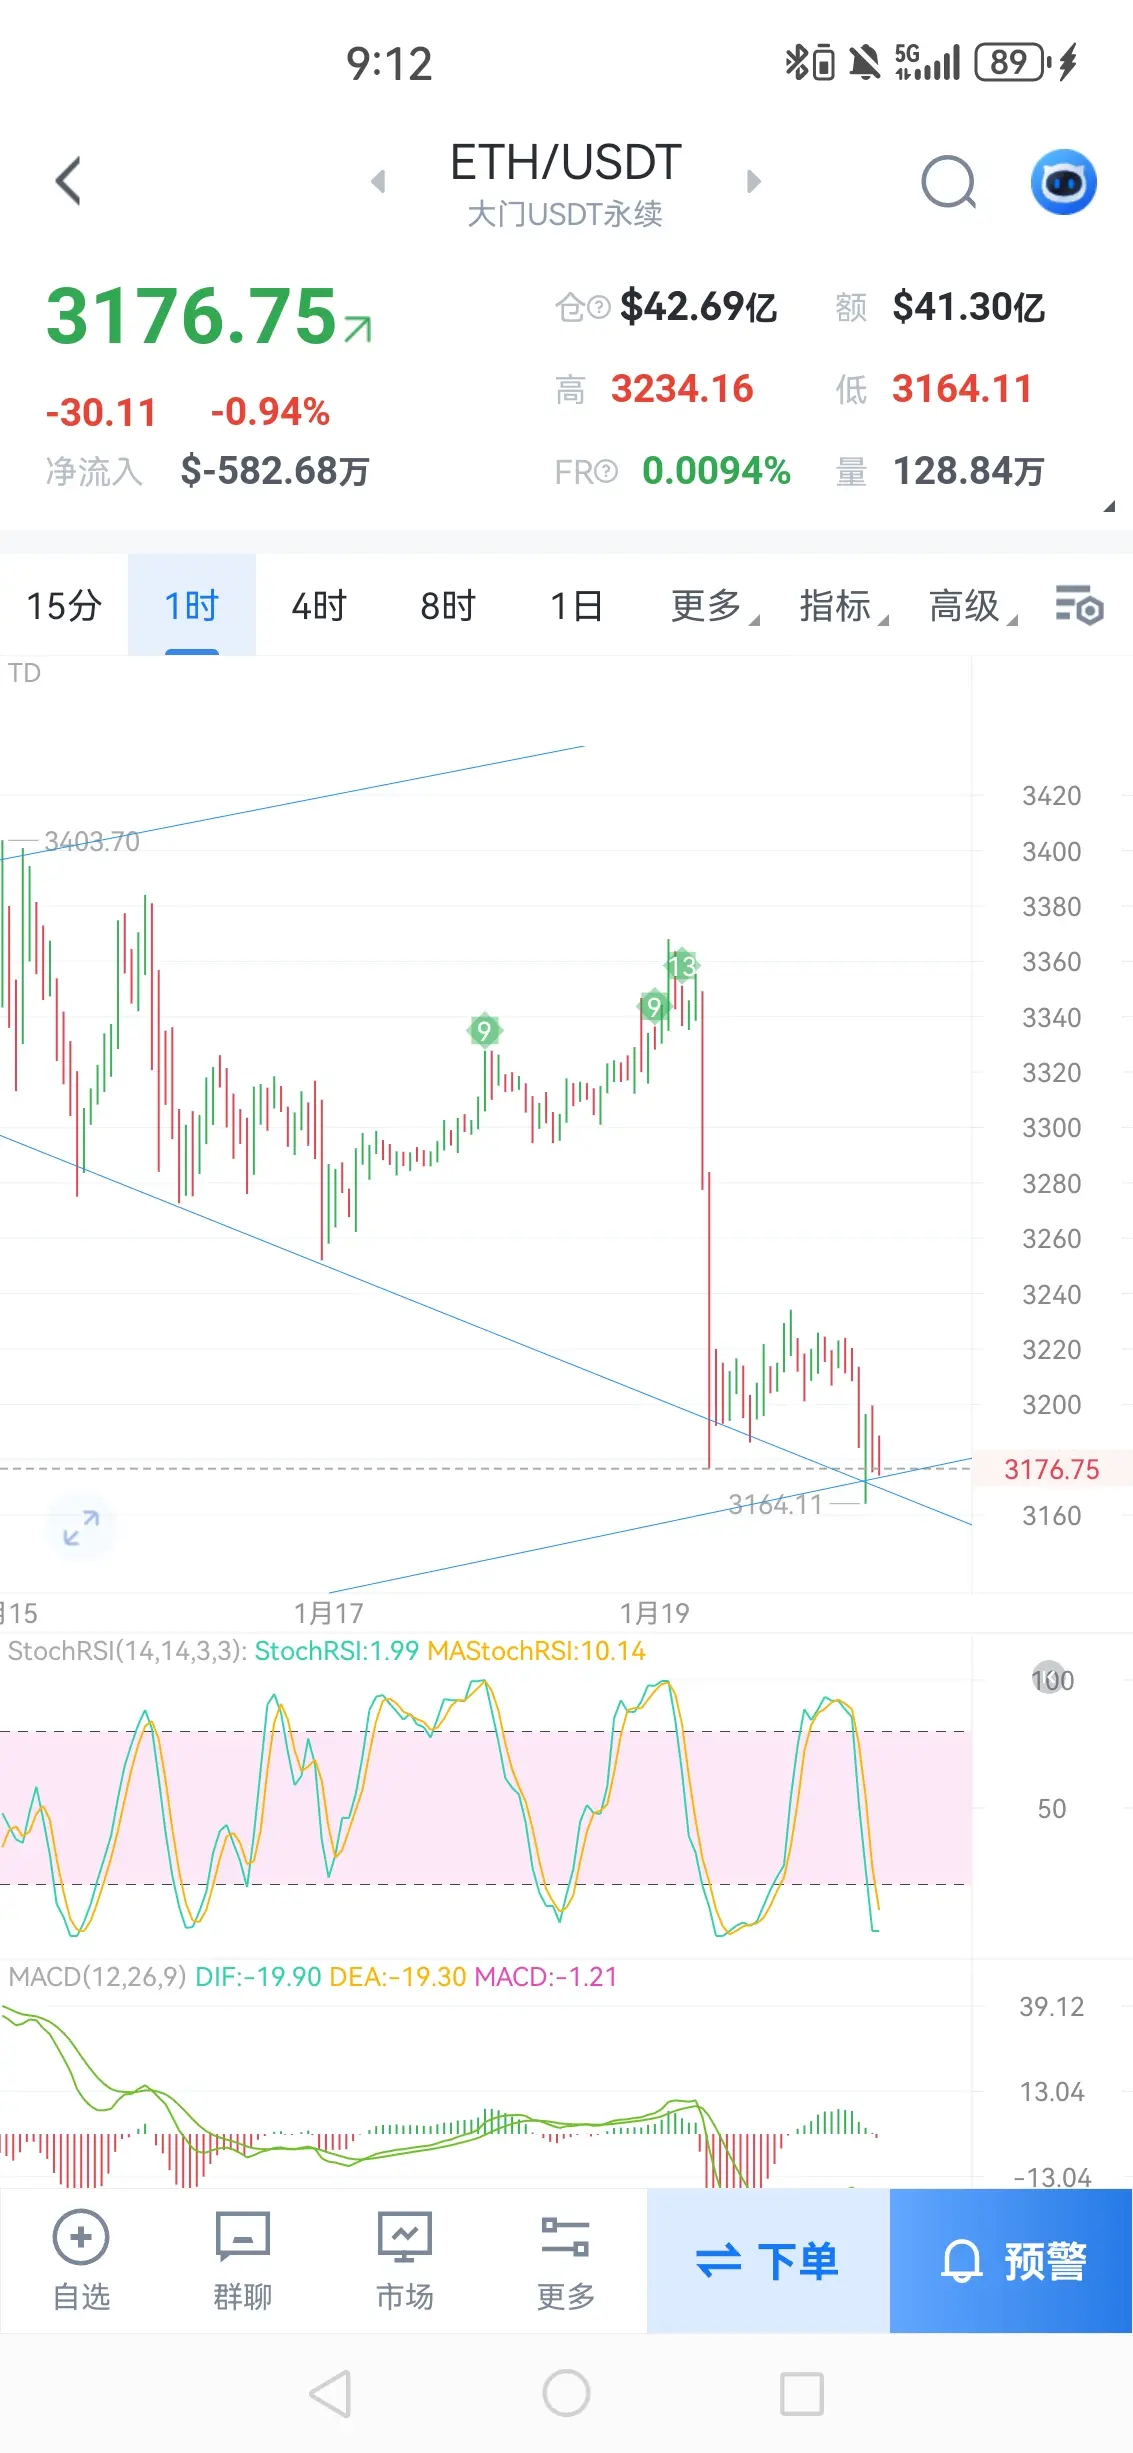
Price Trend Analysis
1. Candlestick Patterns:
- The daily chart shows recent prices pulling back from high levels, forming consecutive bearish candles, indicating a weak downward trend.
- In the 4-hour cycle, the price is consolidating around 3200, but overall remains within a downward channel.
2. Technical Indicators:
- MACD: The 4-hour MACD remains below the zero line, with DIF and DEA diverging downward, indicating strong bearish momentum.
- RSI: RSI(14) is around 36, approaching the oversold zone, suggesting a potential short-term rebound, but not yet in a clear trend phase.
- EMA
View Original1. Candlestick Patterns:
- The daily chart shows recent prices pulling back from high levels, forming consecutive bearish candles, indicating a weak downward trend.
- In the 4-hour cycle, the price is consolidating around 3200, but overall remains within a downward channel.
2. Technical Indicators:
- MACD: The 4-hour MACD remains below the zero line, with DIF and DEA diverging downward, indicating strong bearish momentum.
- RSI: RSI(14) is around 36, approaching the oversold zone, suggesting a potential short-term rebound, but not yet in a clear trend phase.
- EMA
- Reward
- like
- 1
- Repost
- Share
DemonCultBrother-In-Law:
Years of hard study in the cold window. Only for today, with leverage at its maximum a hundred times. A promise to the one I love. Losing half would be a disrespect to the dog in disguise. A lack of trust in myself.#Gate 2025 Year-End Community Gala#
Top Streamers & Content Creators Year-End Awards
Who will be the Top Streamers of the Year? Who will claim the top spot on the Content Creator leaderboard? Join me in voting to support your favorite streamers and creators, and witness the rise of community stars!
https://www.gate.com/activities/community-vote-2025?invite=1&ref=VQISAVPFVG&refType=2&refUid=47174415&ref_type=165&utm_cmp=xjdtmcgP

- Reward
- like
- Comment
- Repost
- Share
$ETH Long-term struggle, took a 70-point 🥩✅, congratulations to the followers 🎉#欧美关税风波冲击市场
ETH-0,62%

- Reward
- 2
- 3
- Repost
- Share
JM郑天文 :
:
It's not the bottom yet. I'll do a live broadcast for everyone at noon.View More
People always say that retail investors love to fantasize
But isn't meme all about opening up imagination and daydreaming?
Without starting from 100k and fantasizing about 1B, where does the thrill come from?
View OriginalBut isn't meme all about opening up imagination and daydreaming?
Without starting from 100k and fantasizing about 1B, where does the thrill come from?

- Reward
- 2
- 1
- Repost
- Share
Miss2021 :
:
Hold on tight, we're about to take off 🛫The broadcast has started! Yesterday was okay! The brave ones are already eating meat!
View Original
- Reward
- like
- Comment
- Repost
- Share
Bitcoin Ethereum January 20 Operation Plan Still in a bearish sentiment, but cherish the low-buying opportunities
Yesterday morning, due to the sudden escalation of the tariff war, the market suddenly plunged, just hitting the support line of the God of Wealth. Next, pay attention to whether this support line can hold. If this level is broken, it may accelerate the decline to a lower level.
Every long position in this wave of decline should be taken seriously. Because negative news will eventually pass, once the market recovers, it will rise again quickly, and may even go higher!
#比特币 #BTC #ET
View OriginalYesterday morning, due to the sudden escalation of the tariff war, the market suddenly plunged, just hitting the support line of the God of Wealth. Next, pay attention to whether this support line can hold. If this level is broken, it may accelerate the decline to a lower level.
Every long position in this wave of decline should be taken seriously. Because negative news will eventually pass, once the market recovers, it will rise again quickly, and may even go higher!
#比特币 #BTC #ET

- Reward
- like
- Comment
- Repost
- Share
$VOOI This market cap... secretly pumped in the middle of the night and then crashed, and the contract was directly reduced from 20X to 10X. The next step is to delist the contract, which clearly indicates a zeroing and delisting trend. Additionally, I noticed that your trading data clearly shows bot activity, as shown in the screenshot.
VOOI25,42%
- Reward
- 1
- 1
- Repost
- Share
45790893 :
:
It's normal to do a push before delisting🌈 Gate Live Broadcast Inspiration - January 20
Trending Topics:
🔹 Silent for 13 Years! Bitcoin Ancient Whale Moves 909 BTC, Unrealized Gains Up to 13,900 Times
🔹 Ethereum Treasury FG Nexus Short-Term Sells 2,500 ETH, How Will the Market React?
🔹 Pump.fun Establishes Investment Department Pump Fund, Meme Coin Ecosystem May Welcome a New Round of Layout
🔹 Crypto Fear Index Drops to 32, Market Still in "Fear Zone," Short-Term Opportunities Hidden
🔹 Citibank Warns: Yen Weakness May Trigger the Bank of Japan to Raise Interest Rates Three Times by 2026, Global Capital May Shift to Crypto
🔹 Th
View OriginalTrending Topics:
🔹 Silent for 13 Years! Bitcoin Ancient Whale Moves 909 BTC, Unrealized Gains Up to 13,900 Times
🔹 Ethereum Treasury FG Nexus Short-Term Sells 2,500 ETH, How Will the Market React?
🔹 Pump.fun Establishes Investment Department Pump Fund, Meme Coin Ecosystem May Welcome a New Round of Layout
🔹 Crypto Fear Index Drops to 32, Market Still in "Fear Zone," Short-Term Opportunities Hidden
🔹 Citibank Warns: Yen Weakness May Trigger the Bank of Japan to Raise Interest Rates Three Times by 2026, Global Capital May Shift to Crypto
🔹 Th

- Reward
- 1
- 1
- Repost
- Share
WallStreetTiger|LittleFriend:
2026 Go Go Go 👊#Today #MarketNews #News #TopMarket #LOVE FUUCCCCKKKKKKKKKKK , LOVE RUGPUIIILLLLLLLL DAMN 😭. SELL LOVE NOW, or cry latter. HurryUp Brooo.
LOVE3,52%

- Reward
- like
- Comment
- Repost
- Share

My end-of-year summary for 2025 at Gate is right here! See how I performed this year.
Click the link to view the exclusive summary #2025GateYearEndSummary and a 20 USDT position voucher. https://www.gate.com/vi/competition/your-year-in-review-2025?ref=VVHHVF1XBA&ref_type=126&shareUid=U1JFXFpbBwUO0O0O
View OriginalClick the link to view the exclusive summary #2025GateYearEndSummary and a 20 USDT position voucher. https://www.gate.com/vi/competition/your-year-in-review-2025?ref=VVHHVF1XBA&ref_type=126&shareUid=U1JFXFpbBwUO0O0O

- Reward
- like
- Comment
- Repost
- Share
炒币给我爷爷买点煤过冬
炒币给我爷爷买点煤过冬
Created By@gatefunuser_e101
Listing Progress
0.10%
MC:
$3.51K
Create My Token
The US dollar is still depreciating, and interest rates will continue to be cut, with countries constantly printing money.
Just saying we're already in a bear market, I really don't understand you guys.
I dare say that if Bitcoin doesn't experience a big bull run by 2026,
and if interest rates are still being cut during that time,
there definitely won't be a bull market during the dollar rate hikes. To be clear about this.
BTC0,01%

- Reward
- 1
- Comment
- Repost
- Share
The position on the 20th continues to run~
View Original
MC:$22.92KHolders:125
58.70%
- Reward
- 2
- 3
- Repost
- Share
LittleYuIsNotLittleFish. :
:
Hold on tight, we're about to take off 🛫View More
- Reward
- like
- Comment
- Repost
- Share
Viewing the Top Market Coins Spot Chart and comparing them
1
- Reward
- like
- Comment
- Repost
- Share
Buy 20U small toys, win or lose.
Zhang Zuolin's catchphrase "妈了个巴子"
Sesame Gatefun has a storefront "马勒戈币" Chinese top meme
Foreigners should also learn the art of Chinese characters
The world's three major memes
Americans have Dogecoin
Japan has Shitcoin
My China has 马勒戈币#btc #eth #sol #中文MEME
View OriginalZhang Zuolin's catchphrase "妈了个巴子"
Sesame Gatefun has a storefront "马勒戈币" Chinese top meme
Foreigners should also learn the art of Chinese characters
The world's three major memes
Americans have Dogecoin
Japan has Shitcoin
My China has 马勒戈币#btc #eth #sol #中文MEME


MC:$57.13KHolders:49
100.00%
- Reward
- like
- Comment
- Repost
- Share
- Reward
- like
- Comment
- Repost
- Share
This image says it all 🌿
It starts with you. Make a difference.
Read the article 👉
Earn GREEN when you act with ECOX Network:
#ECOX #GREEN #ECO_TO_EARN
It starts with you. Make a difference.
Read the article 👉
Earn GREEN when you act with ECOX Network:
#ECOX #GREEN #ECO_TO_EARN
View Original

- Reward
- like
- Comment
- Repost
- Share
Load More
Join 40M users in our growing community
⚡️ Join 40M users in the crypto craze discussion
💬 Engage with your favorite top creators
👍 See what interests you
Trending Topics
View More21.33K Popularity
333.71K Popularity
44.97K Popularity
6.75K Popularity
6.06K Popularity
News
View MoreBLUAI (Bluwhale) increased by 34.15% in the past 24 hours
3 m
Animoca Brands Co-Founder: NFTs Still Favored by Wealthy Collectors, They Are Core Assets with Long-Term Value
4 m
Analysis: Institutional demand for Bitcoin remains strong, with institutions increasing their holdings by approximately $53 billion worth of BTC over the past year.
5 m
XRP (XRP) increased by 1.30% in the last 24 hours
6 m
FG Nexus Sells 2,500 ETH Worth $8.04 Million
17 m
Pin