Trade
Basic
Futures
Futures
Hundreds of contracts settled in USDT or BTC
Options
HOT
Trade European-style vanilla options
Unified Account
Maximize your capital efficiency
Demo Trading
Futures Kickoff
Get prepared for your futures trading
Futures Events
Participate in events to win generous rewards
Demo Trading
Use virtual funds to experience risk-free trading
Earn
Launch
CandyDrop
Collect candies to earn airdrops
Launchpool
Quick staking, earn potential new tokens
HODLer Airdrop
Hold GT and get massive airdrops for free
Launchpad
Be early to the next big token project
Alpha Points
NEW
Trade on-chain assets and enjoy airdrop rewards!
Futures Points
NEW
Earn futures points and claim airdrop rewards
Investment
Simple Earn
Earn interests with idle tokens
Auto-Invest
Auto-invest on a regular basis
Dual Investment
Buy low and sell high to take profits from price fluctuations
Soft Staking
Earn rewards with flexible staking
Crypto Loan
0 Fees
Pledge one crypto to borrow another
Lending Center
One-stop lending hub
VIP Wealth Hub
Customized wealth management empowers your assets growth
Private Wealth Management
Customized asset management to grow your digital assets
Quant Fund
Top asset management team helps you profit without hassle
Staking
Stake cryptos to earn in PoS products
Smart Leverage
NEW
No forced liquidation before maturity, worry-free leveraged gains
GUSD Minting
Use USDT/USDC to mint GUSD for treasury-level yields
More
TradeDots
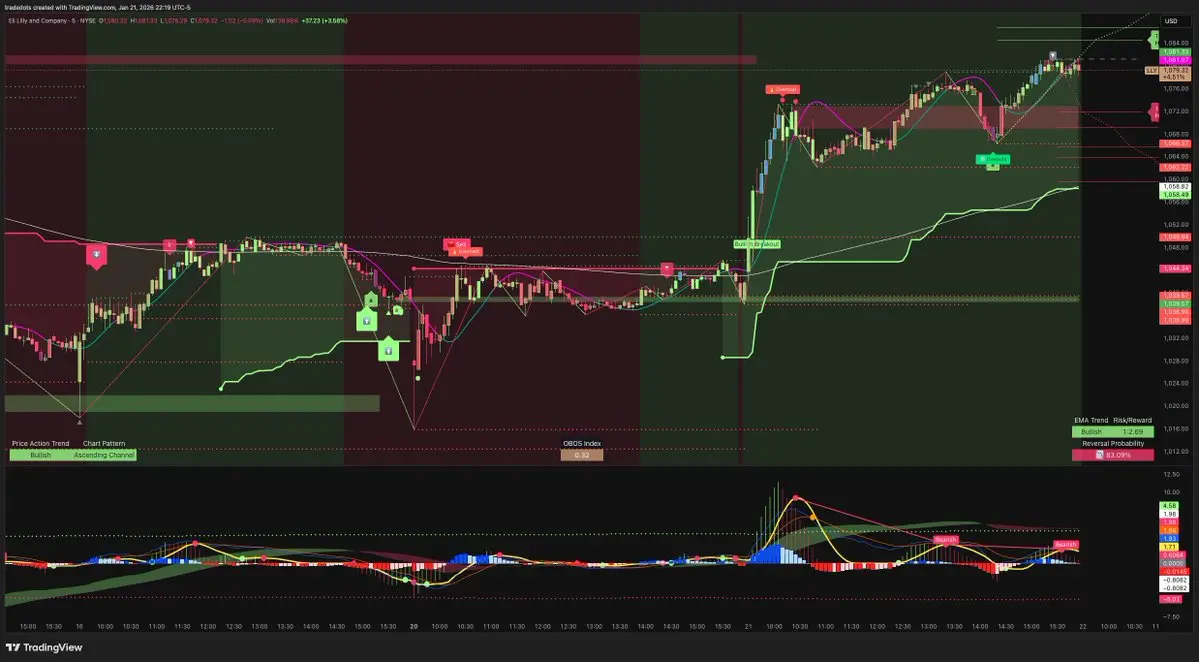
$LLY: Breakthrough Ovarian Cancer Treatment\n\nSentiment: Positive\n\nEli Lilly earned FDA Breakthrough Therapy status for its ovarian cancer candidate, supporting optimism for its oncology pipeline expansion.
- Reward
- 1
- 1
- Repost
- Share
XSEAM:
hi good morning I hope you have a good dayThe Greenland century trade nearly blinded the global markets!
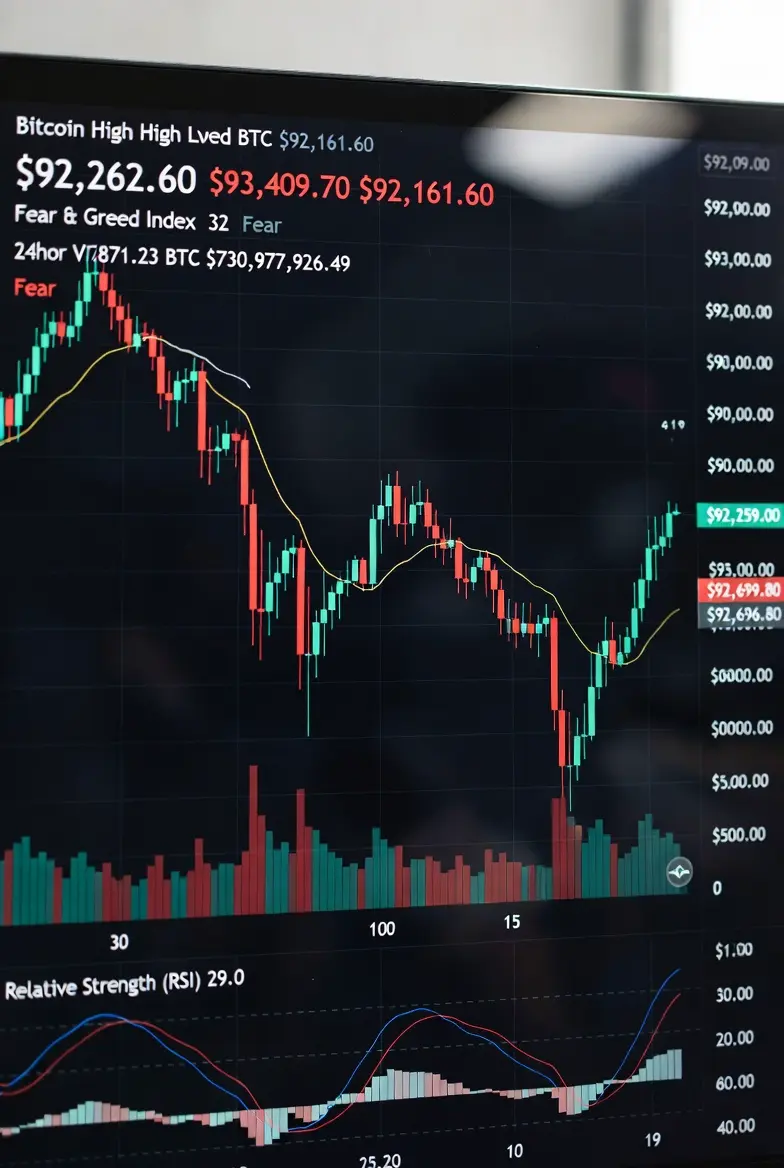
With Trump's promise to temporarily delay tariffs, the stock market rebounded in response, but the crypto market remains at a freezing point. BTC once fell below 88,000, and the Fear & Greed Index plummeted to 32. Watching ETF funds withdraw without hesitation, investors on the streets are all watching cautiously, not daring to catch this falling knife.
Don't let Greenland's mudslinging distract you; the real heavy hitters are hiding in the shadows! Whales have a clear understanding: the root of this sharp decline isn't in the Arct
BTC0,39%

- Reward
- 1
- 1
- Repost
- Share
Discovery :
:
Watching Closely 🔍️#GrowthPointsDrawRound16 Is anyone really getting an iPhone from this program? Come on, speak up guys, I'm just curious sometimes whether it's really possible to win the grand prize.
View Original

- Reward
- 1
- Comment
- Repost
- Share
孔子
孔子
Created By@PiggyFromTheOcean
Listing Progress
100.00%
MC:
$25.81K
Create My Token
U.S. stocks close higher, crypto stocks diverge! What do capital flows suggest about market expectations
1
- Reward
- like
- Comment
- Repost
- Share
Viewing the Top Market Coins Spot Chart and comparing them
1
- Reward
- like
- Comment
- Repost
- Share
#BTCMarketAnalysis #BTCFutureOutlook
Smart Money Is Watching This Zone
Bitcoin is once again at a make-or-break level, and this is exactly where future trends are born, not at the top when everyone is euphoric.
As we move deeper into Q1–Q2 2026, BTC’s recent correction from the January highs is not a sign of weakness
it’s a reset before the next expansion phase.
Where We Stand Right Now
BTC Price: ~$88,400
Correction: ~8% from the $96K January peak
Market Structure: Higher lows still intact
This is not panic selling.
This is controlled distribution followed by accumulation.
What the Marke
BTC0,39%
- Reward
- 3
- Comment
- Repost
- Share
Is Leviste already in prison? $SPNEC
View Original- Reward
- like
- Comment
- Repost
- Share
- Reward
- 1
- 2
- Repost
- Share
CryptoVortex:
2026 GOGOGO 👊View More
Gold current price range, suggested 4784-4778 buy, target to see 4790-4809, wave 4830, stop loss 4770#Gate每10分钟送1克黄金
View Original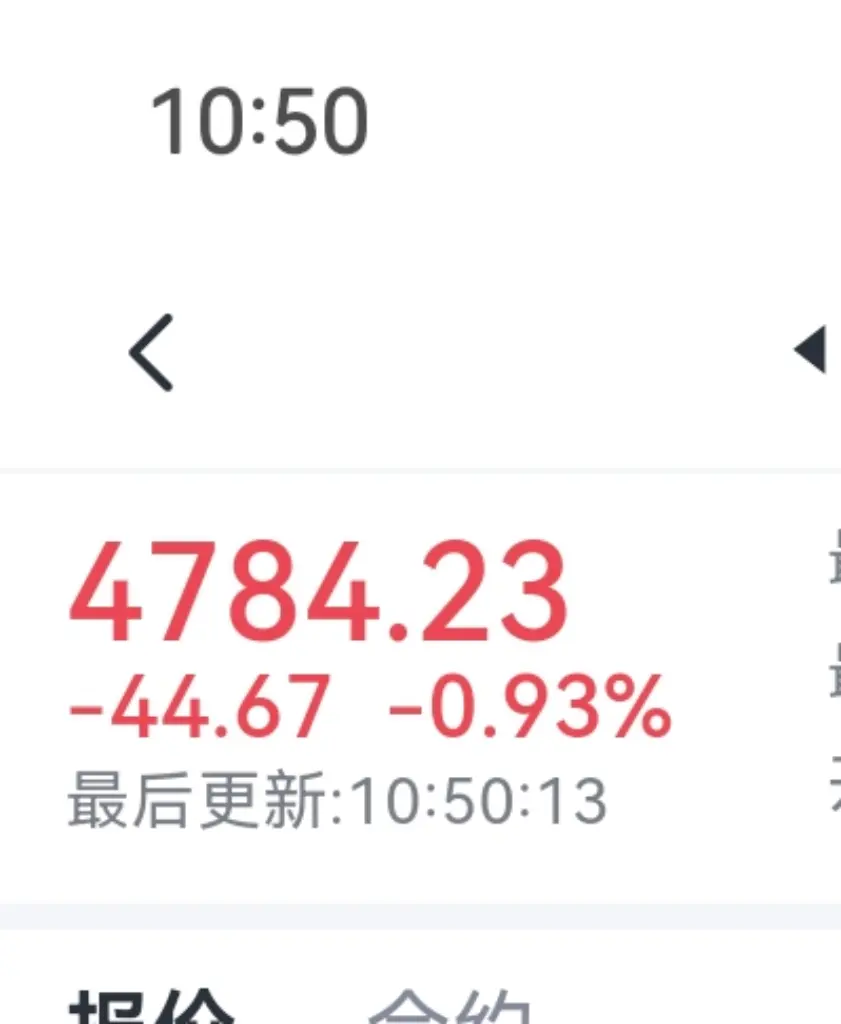
- Reward
- like
- Comment
- Repost
- Share
#DoubleRewardsWithGUSD
Double Rewards Opportunity with GUSD Yusfirah’s Thoughts
As I see it, the current DeFi and staking landscape is presenting a rare opportunity for maximizing returns with GUSD. Investors now have the chance to earn dual rewards: a stable APR through minting, combined with high-yield staking in Launchpool. From my perspective, this setup not only leverages the stability of GUSD but also exposes you to top-performing altcoin pools, creating a balanced strategy of safety and upside.
Mint GUSD for Consistent Returns My Analysis
One of the first layers of opportunity is the 4

- Reward
- 1
- 1
- Repost
- Share
Eshall:
2026 GOGOGO 👊Long position at 9 AM perfectly rose to 3037, with a 35-point profit👍
View Original- Reward
- 4
- 2
- Repost
- Share
GateUser-22da27e9 :
:
The data is always so accurate, perfectly eating meatView More
AI
AIE
Created By@GateUser-9c9c7698
Listing Progress
0.00%
MC:
$3.45K
Create My Token
#GateTradFi1gGoldGiveaway: Bridging Traditional Finance and Digital Innovation
In today’s fast-evolving financial landscape, the line between traditional finance (TradFi) and digital assets is becoming increasingly blurred. Platforms that successfully bridge these two worlds are leading the next phase of financial innovation—and Gate is once again at the forefront. With the
#GateTradFi1gGoldGiveaway, Gate is offering users a unique opportunity to experience the power of TradFi-inspired products while earning real, tangible rewards.
The Gate TradFi 1g Gold Giveaway is more than just a promotio


- Reward
- 3
- 4
- Repost
- Share
User_any :
:
2026 GOGOGO 👊View More
US stock profit-taking series, students copy homework and achieve a passive income life!
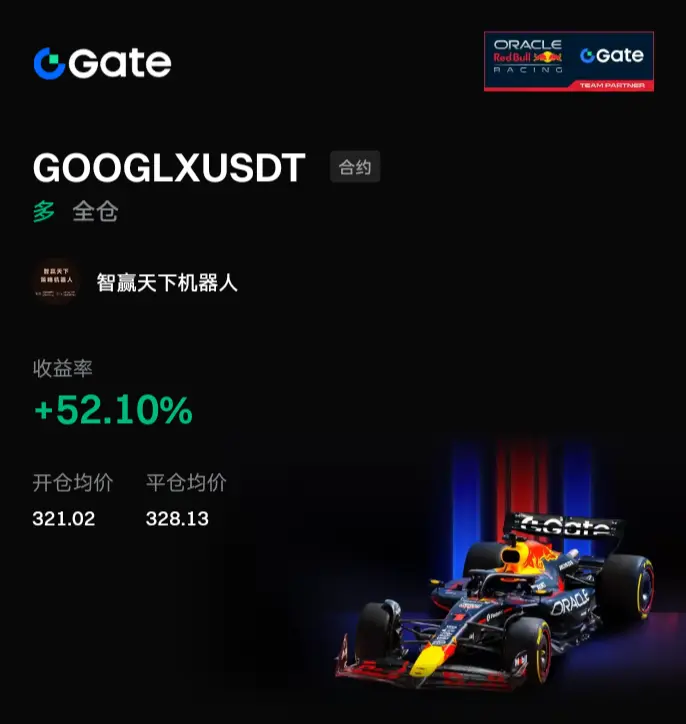
Strategy: Smart Win World Strategy Robot "ZYTX GKDD V8"
Using TradingView Smart Win World indicator strategy, create "Signal Robot" and "Portfolio Indicator" robots, quickly become a quantitative expert in one day, and achieve a free life in one month.
#带着Gate去旅行
#GateTravel旅行分享官
#智赢天下TradingView指标
#智赢天下TradingView策略机器人
View OriginalStrategy: Smart Win World Strategy Robot "ZYTX GKDD V8"
Using TradingView Smart Win World indicator strategy, create "Signal Robot" and "Portfolio Indicator" robots, quickly become a quantitative expert in one day, and achieve a free life in one month.
#带着Gate去旅行
#GateTravel旅行分享官
#智赢天下TradingView指标
#智赢天下TradingView策略机器人

- Reward
- 2
- Comment
- Repost
- Share
📢 Streamers, assemble! Go live daily and don’t miss the rewards
The Gate Live Streamer Incentive Program is live.
Join the Live-to-Earn check-in and unlock multiple rewards when you stream:
💰 Monthly rewards
🎫 Livestream traffic boosts
⭐ VIP level upgrades
🏆 Share the $10,000 prize pool
👑 Monthly Top Streamer selection & official support
📈 Every stream counts
The more consistently you stream, the more you earn
🚀 Rewards are live — start today
👉 Don’t forget to sign up before going live. Stream sessions are tracked automatically
Not a streamer yet? Become one now:
https://www.gate.com/l

- Reward
- 3
- 2
- Repost
- Share
Khosabloch52:
2026 GOGOGO 👊View More
#CLARITYBillDelayed #CLARITYBillDelayed
A Pause Today, A Turning Point Tomorrow
The delay of the CLARITY Act in the US Senate has once again highlighted a hard truth for the digital asset industry: regulation is not just a legal process
it’s a political, economic, and technological balancing act. While many in the crypto market were hoping for clarity, what we received instead was another chapter of uncertainty.
Why This Delay Matters More Than It Seems
The CLARITY Act was never just another bill. It symbolized a potential shift from fragmented oversight to a unified federal framework for di
DEFI-0,66%

- Reward
- 5
- Comment
- Repost
- Share
The early morning pullback long strategy was re-entered for profit-taking, with target levels all exceeding expectations. The intraday multiple short-term long setups during the pullback were perfectly validated.
View Original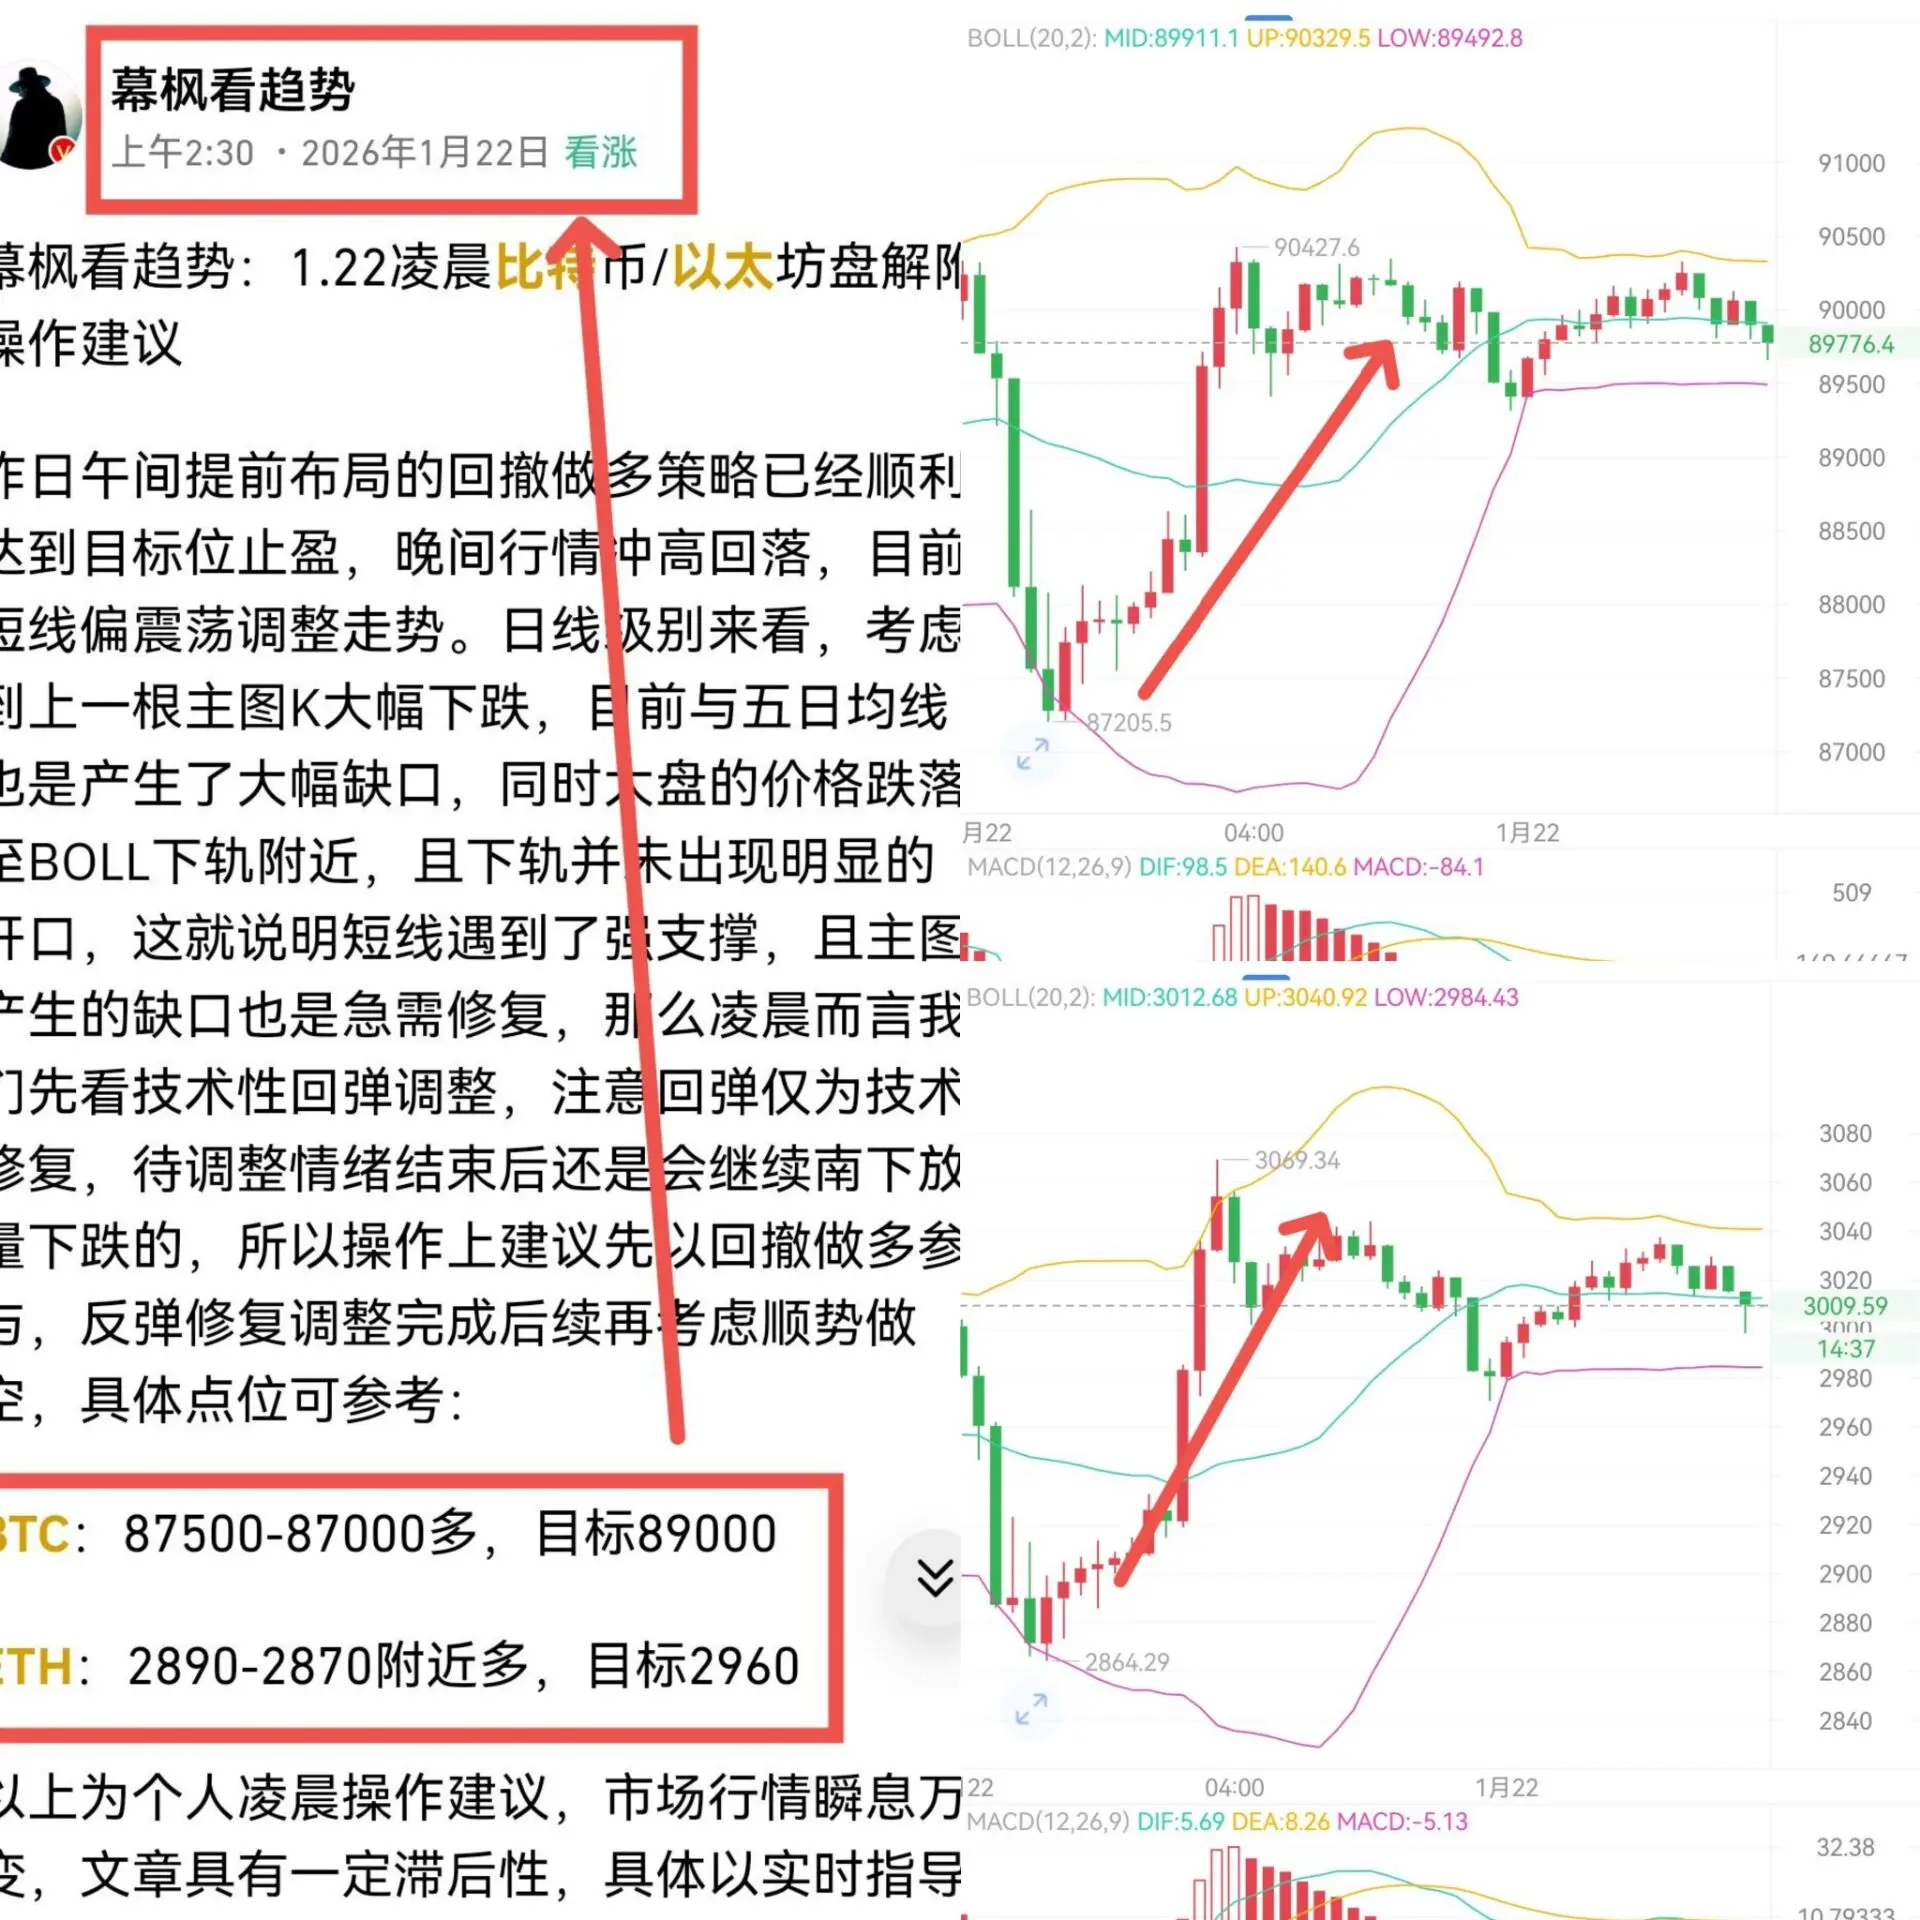
- Reward
- 1
- 2
- Repost
- Share
MufengLooksAtTheTren:
2026 Go Go Go 👊View More
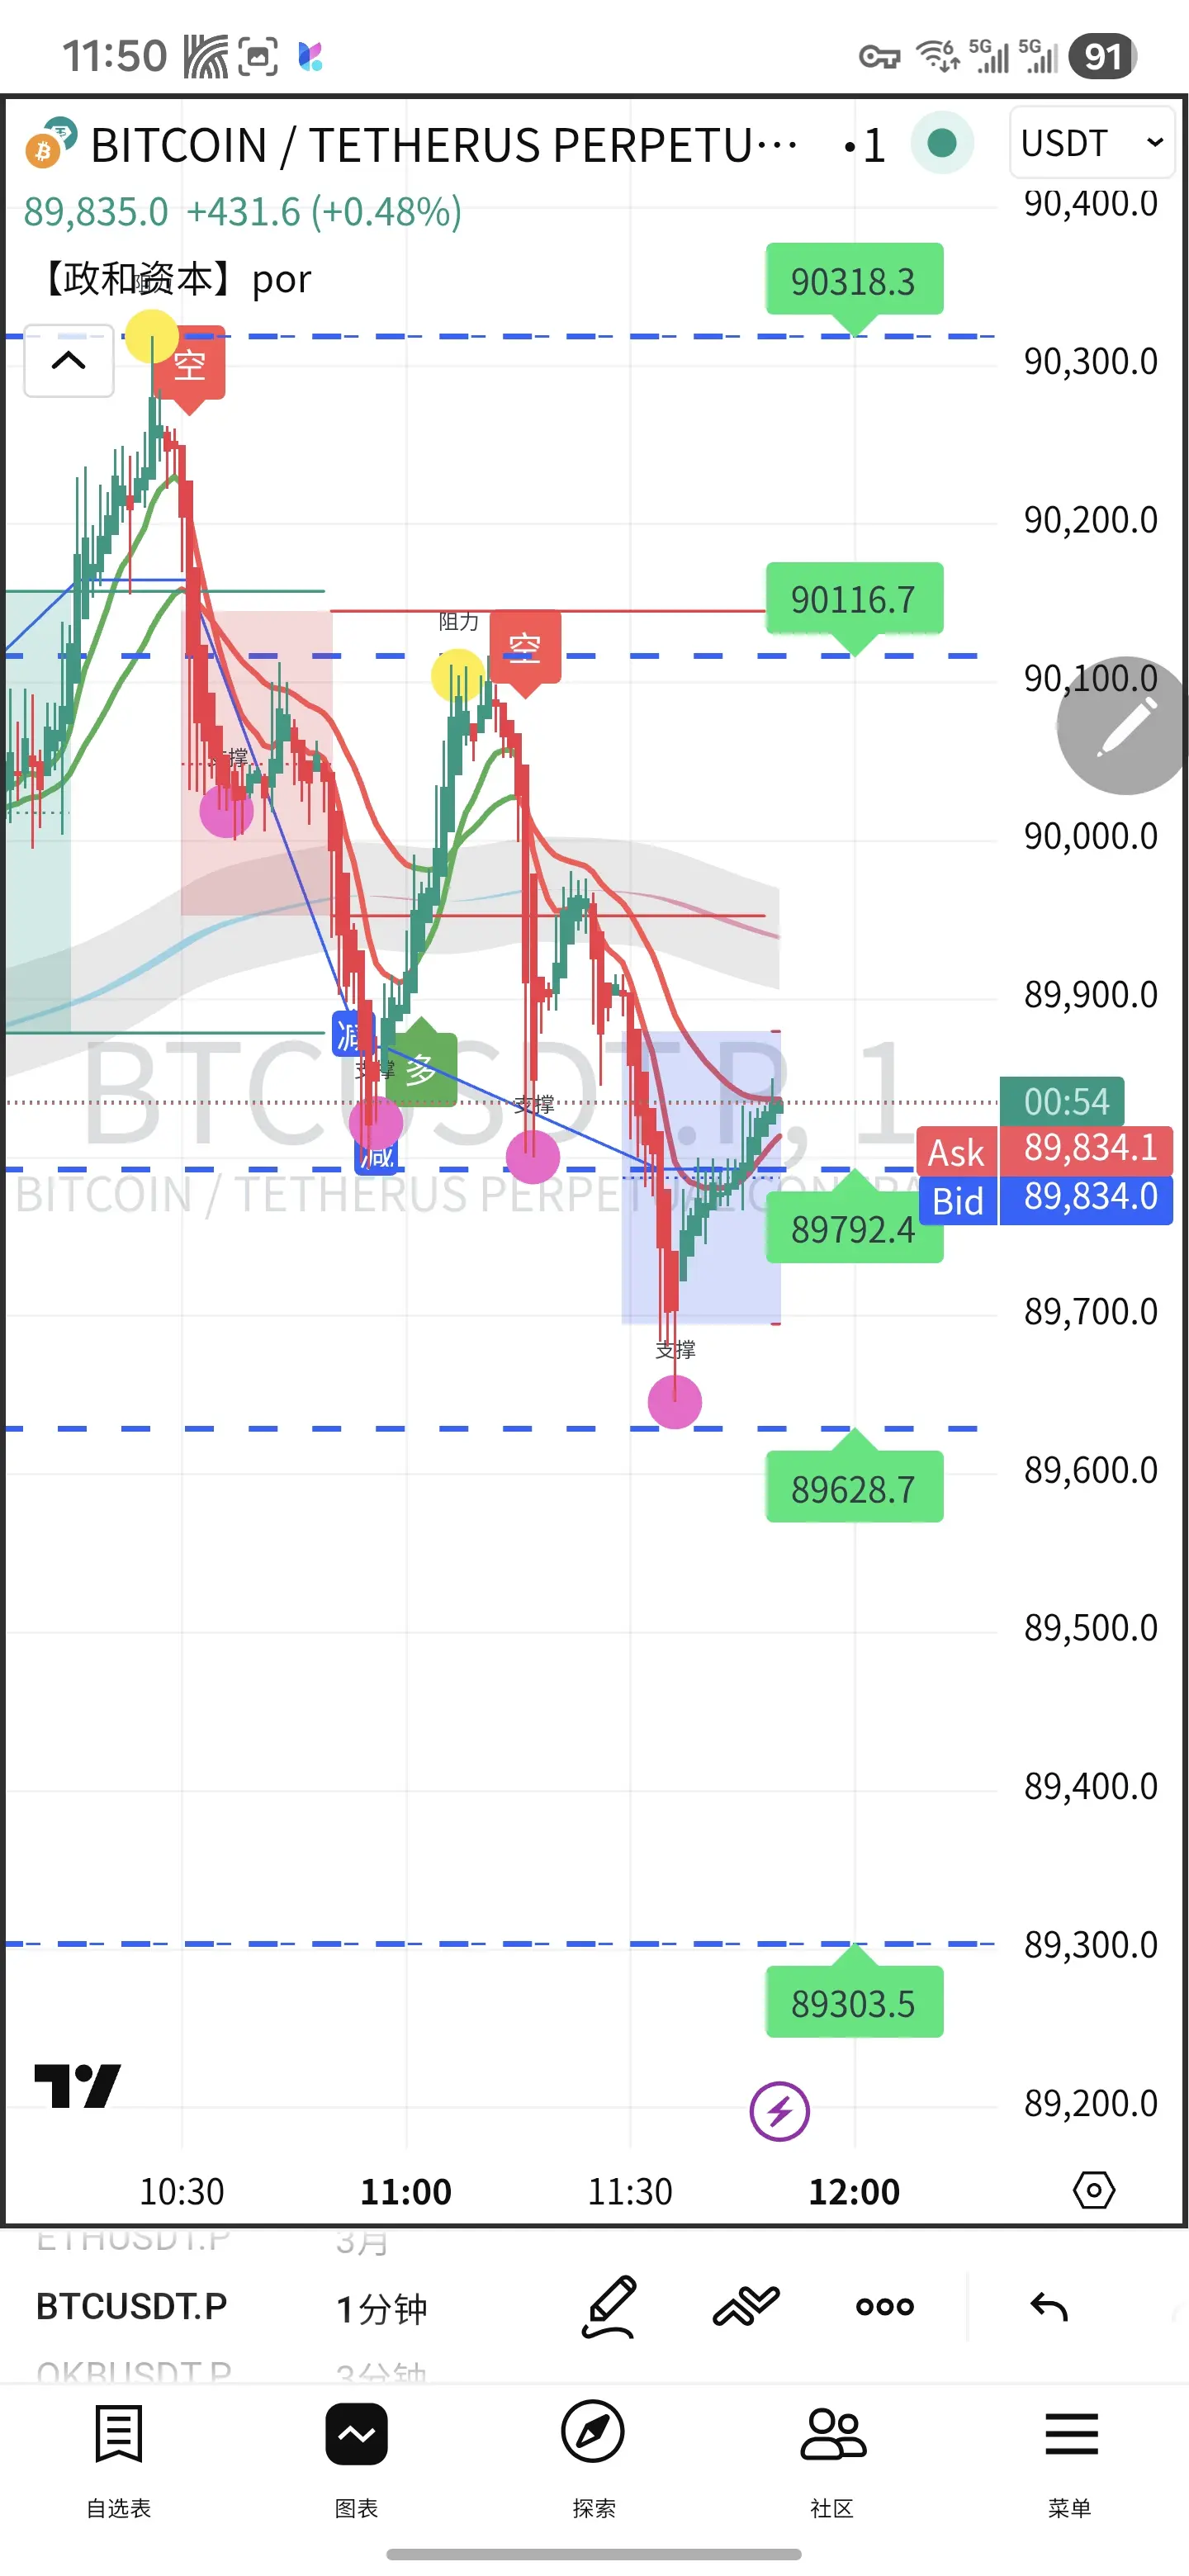
January 22 BTC Technical Overview (As of 11:50, price around 90,000)
- Conclusion: Short-term wide-range fluctuations, daily chart slightly bearish, no clear trend on 4H, wait for breakout signals to determine direction.
- Key levels: Support at 87,200-87,800, 89,000; Resistance at 90,500-91,000, 91,500-92,000.
- Strategy: Buy the dip and sell the rally, strictly control positions, follow the trend after breaking support/resistance.
Core Indicators and Patterns
- Daily chart: Consecutive bearish candles, Bollinger lower band around 87,800, RSI weak, bears dominate; rebound after holding the lo
BTC0,39%
- Reward
- 2
- Comment
- Repost
- Share
Trump's one-year anniversary in the White House, the White House released a bilingual promotional video.\n\nOne year, the old man has brought extreme prosperity and destruction to the financial markets. There are still 3 years to go. Hang in there.
View Original- Reward
- like
- Comment
- Repost
- Share
Load More
Join 40M users in our growing community
⚡️ Join 40M users in the crypto craze discussion
💬 Engage with your favorite top creators
👍 See what interests you
Trending Topics
View More43.26K Popularity
25.98K Popularity
11.78K Popularity
57.24K Popularity
344.63K Popularity
News
View MoreNikkei 225 Index rises by 2%
1 m
Byreal × Moonbirds Joint SBT Officially Opens for Claiming
2 m
Hyperliquid launches SKR perpetual contracts, supporting up to 3x leverage trading
11 m
"Former PEPE largest long position" reopens long ETH, average entry price $3006.63
12 m
U.S. Cryptocurrency Market Legislation Clears Senate Agriculture Committee, CFTC Regulatory Authority Becomes Key Focus
19 m
Pin