QBX vs NEAR: Comparing Two Blockchain Platforms for Decentralized Applications
Introduction: QBX vs NEAR Investment Comparison
In the cryptocurrency market, the comparison between QBX and NEAR has been an unavoidable topic for investors. The two not only show significant differences in market cap ranking, application scenarios, and price performance, but also represent different positioning in the crypto asset space.
QBX (QBX): Since its launch, it has gained market recognition for its focus on loyalty currencies and decentralized payment infrastructure.
NEAR (NEAR): Introduced in 2020, it has been hailed as a highly scalable protocol supporting fast DApp operations on mobile devices, becoming one of the top cryptocurrencies by global trading volume and market capitalization.
This article will comprehensively analyze the investment value comparison between QBX and NEAR, focusing on historical price trends, supply mechanisms, institutional adoption, technological ecosystems, and future predictions, attempting to answer the question most concerning to investors:
"Which is the better buy right now?"
I. Price History Comparison and Current Market Status
QBX and NEAR Historical Price Trends
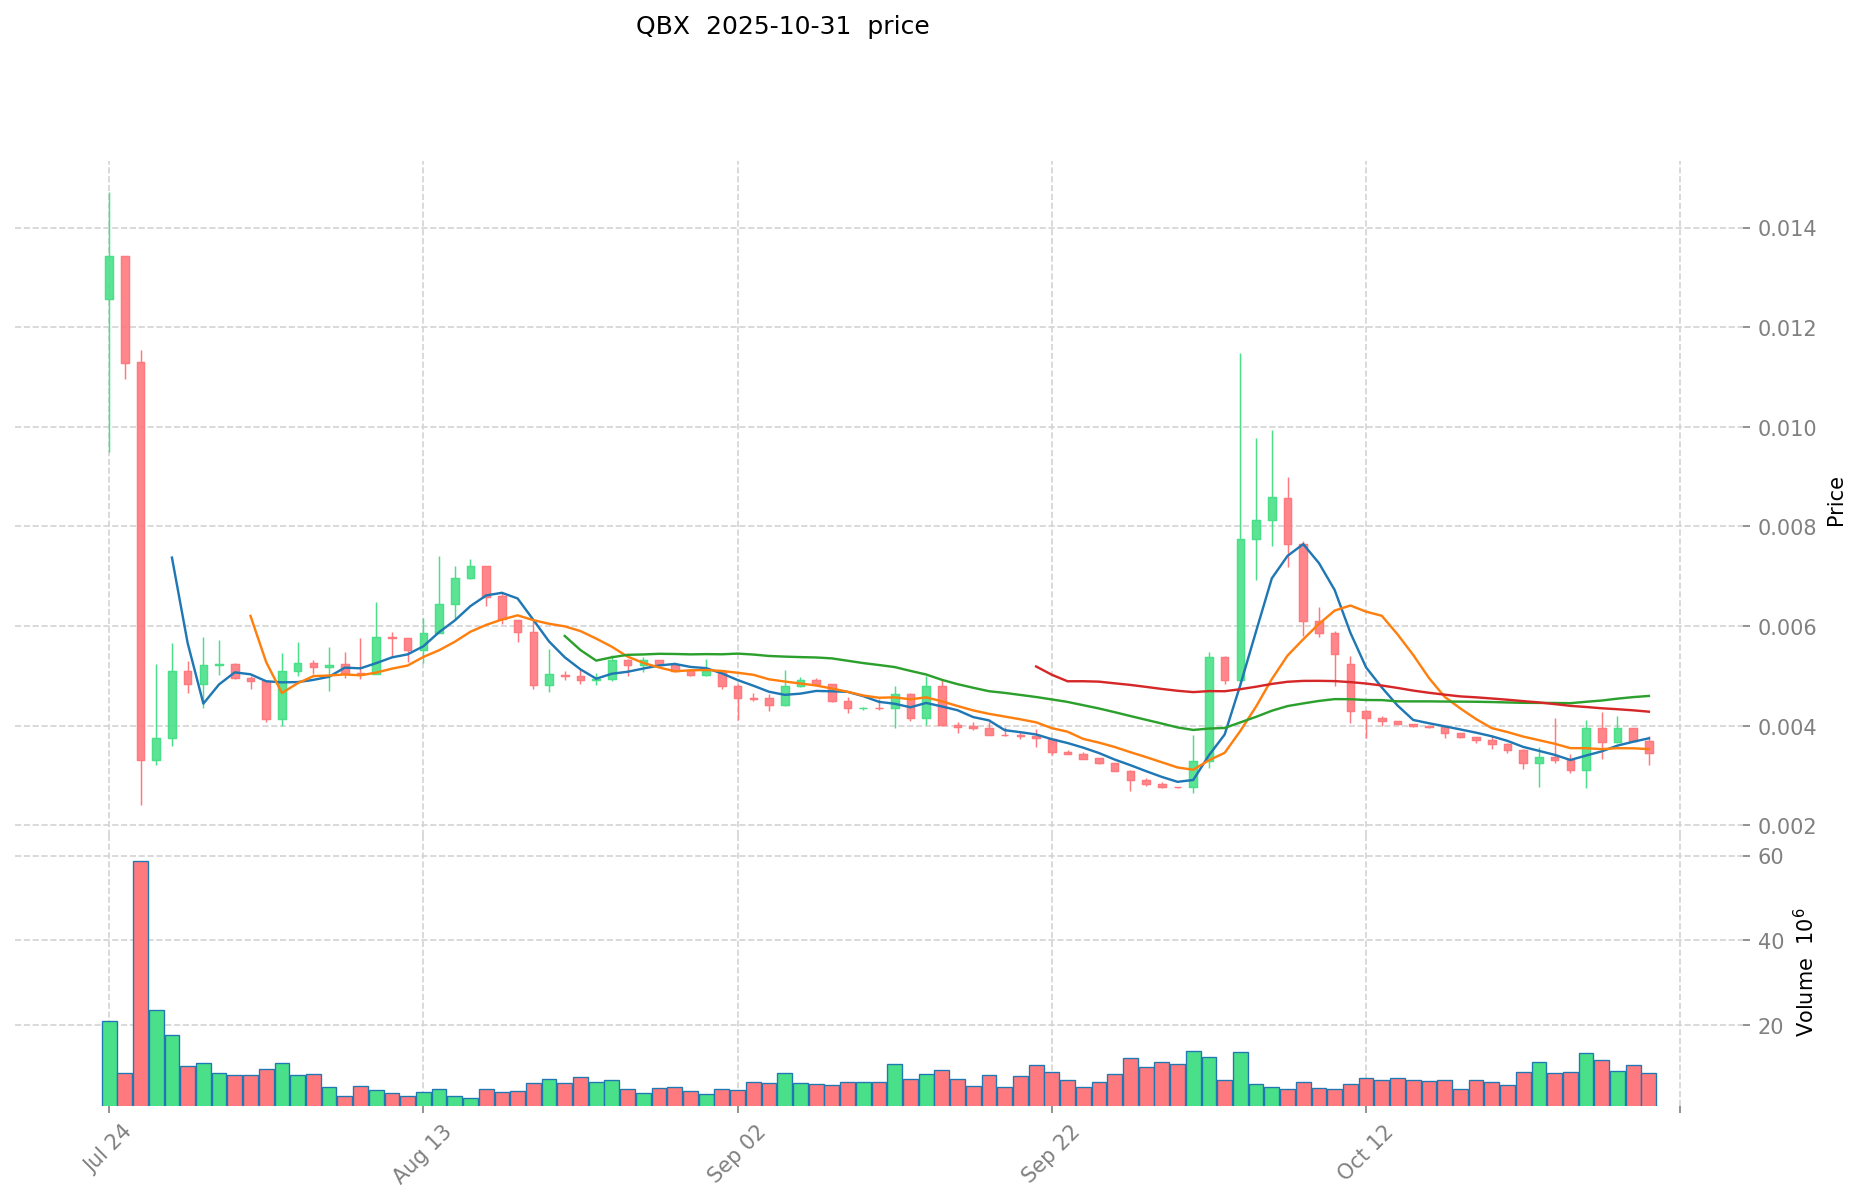
- 2024: QBX reached its all-time high of $0.14 due to increased adoption.
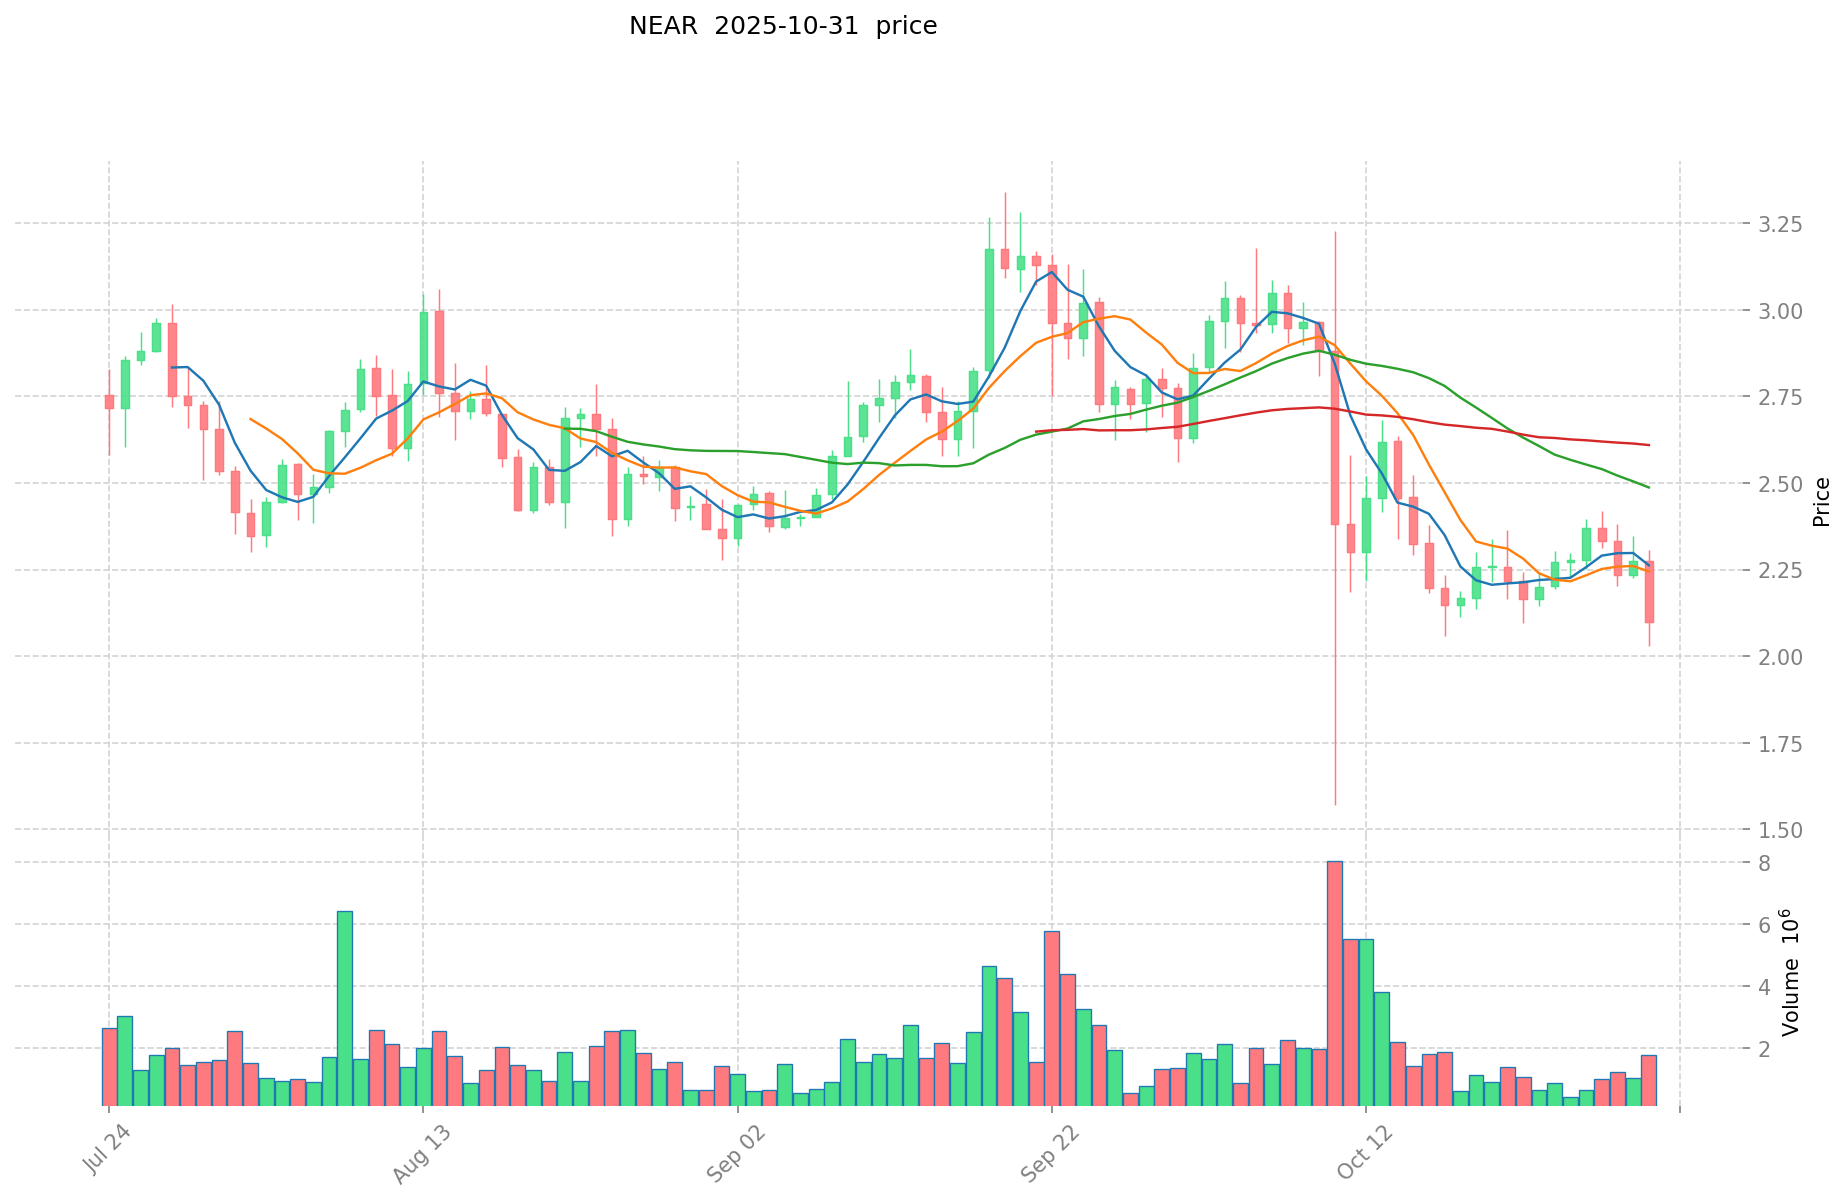
- 2022: NEAR hit its peak of $20.44, influenced by overall crypto market growth.
- Comparative analysis: In the recent market cycle, QBX dropped from $0.14 to a low of $0.0009076, while NEAR declined from $20.44 to $0.526762.
Current Market Situation (2025-10-31)
- QBX current price: $0.0033942
- NEAR current price: $2.098
- 24-hour trading volume: QBX $18,080.52 vs NEAR $3,498,584.39
- Market Sentiment Index (Fear & Greed Index): 29 (Fear)
Click to view real-time prices:
- Check QBX current price Market Price
- Check NEAR current price Market Price
II. Core Factors Affecting QBX vs NEAR Investment Value
Technical Development and Ecosystem Building
- Project Ecosystem: The true determinant of a project's value is the ecosystem's development. When an ecosystem can continuously create value, every element within it becomes increasingly valuable.
- Sustainable Value Creation: Long-term investment value depends on a project's ability to sustainably develop and grow its ecosystem over time.
- Community Development: Projects that take time to carefully build and refine their ecosystems can create interesting and valuable experiences for users and investors.
Market Adoption and Community Support
- Consensus Building: Projects like WALLX demonstrate the importance of building community consensus (e.g., through consensus laboratories engaging millions of users).
- User Adoption: Successful projects aim to have widespread user adoption with meaningful holdings (as seen in the WALLX example targeting at least $100 worth per person).
- Community Alignment: Projects need to align investors' interests with project goals, where stable price growth benefits both investors and project development.
Long-term Growth Potential
- Market Understanding: Projects led by teams that deeply understand market needs and stay at the industry forefront tend to have better investment value.
- Project Fundamentals: Long-term investment value comes from becoming a high-quality asset that can attract more investors over time.
- Regulatory Compliance: Proper regulatory compliance forms the foundation for long-term operations and sustainable development.
Economic and Value Creation Factors
- Sustainable Returns: Investment value is tied to the project's ability to provide sustainable returns to investors and community supporters.
- Value Creation Mechanisms: Projects that demonstrate clear value creation pathways for their tokens have stronger investment potential.
- Innovation Capability: The ability to innovate and adapt to changing market conditions is essential for maintaining investment value.
III. 2025-2030 Price Prediction: QBX vs NEAR
Short-term Prediction (2025)
- QBX: Conservative $0.002573 - $0.003386 | Optimistic $0.003386 - $0.003555
- NEAR: Conservative $1.407 - $2.10 | Optimistic $2.10 - $2.94
Mid-term Prediction (2027)
- QBX may enter a growth phase, with an estimated price range of $0.002754 - $0.004749
- NEAR may enter a bullish market, with an estimated price range of $2.38 - $3.64
- Key drivers: Institutional capital inflow, ETF, ecosystem development
Long-term Prediction (2030)
- QBX: Base scenario $0.006396 - $0.008059 | Optimistic scenario $0.008059+
- NEAR: Base scenario $4.27 - $4.56 | Optimistic scenario $4.56+
Disclaimer
QBX:
| 年份 | 预测最高价 | 预测平均价格 | 预测最低价 | 涨跌幅 |
|---|---|---|---|---|
| 2025 | 0.003554985 | 0.0033857 | 0.002573132 | 0 |
| 2026 | 0.00451144525 | 0.0034703425 | 0.0024986466 | 2 |
| 2027 | 0.00474916371125 | 0.003990893875 | 0.00275371677375 | 17 |
| 2028 | 0.006030639734512 | 0.004370028793125 | 0.004151527353468 | 28 |
| 2029 | 0.007592488025175 | 0.005200334263818 | 0.004472287466884 | 53 |
| 2030 | 0.008059478042066 | 0.006396411144497 | 0.006140554698717 | 88 |
NEAR:
| 年份 | 预测最高价 | 预测平均价格 | 预测最低价 | 涨跌幅 |
|---|---|---|---|---|
| 2025 | 2.94 | 2.1 | 1.407 | 0 |
| 2026 | 2.9484 | 2.52 | 1.8396 | 19 |
| 2027 | 3.636486 | 2.7342 | 2.378754 | 29 |
| 2028 | 4.71430764 | 3.185343 | 2.2297401 | 51 |
| 2029 | 4.5817973712 | 3.94982532 | 3.5943410412 | 87 |
| 2030 | 4.564418139792 | 4.2658113456 | 3.924546437952 | 102 |
IV. Investment Strategy Comparison: QBX vs NEAR
Long-term vs Short-term Investment Strategy
- QBX: Suitable for investors focused on loyalty currencies and decentralized payment infrastructure
- NEAR: Suitable for investors interested in scalable DApp platforms and mobile-first solutions
Risk Management and Asset Allocation
- Conservative investors: QBX: 30% vs NEAR: 70%
- Aggressive investors: QBX: 60% vs NEAR: 40%
- Hedging tools: Stablecoin allocation, options, cross-currency combinations
V. Potential Risk Comparison
Market Risk
- QBX: Limited market cap and trading volume may lead to higher volatility
- NEAR: Susceptible to broader crypto market trends and competition from other smart contract platforms
Technical Risk
- QBX: Scalability, network stability
- NEAR: Centralization concerns, potential security vulnerabilities
Regulatory Risk
- Global regulatory policies may impact both differently, with NEAR potentially facing more scrutiny due to its smart contract functionality
VI. Conclusion: Which Is the Better Buy?
📌 Investment Value Summary:
- QBX advantages: Focus on loyalty currencies, potential for niche market growth
- NEAR advantages: Established ecosystem, higher market cap, and trading volume
✅ Investment Advice:
- New investors: Consider a higher allocation to NEAR due to its established market position
- Experienced investors: Balanced approach with both QBX and NEAR based on risk tolerance
- Institutional investors: Focus on NEAR for liquidity and ecosystem growth, with potential small allocation to QBX for diversification
⚠️ Risk Warning: The cryptocurrency market is highly volatile. This article does not constitute investment advice. None
VII. FAQ
Q1: What are the main differences between QBX and NEAR? A: QBX focuses on loyalty currencies and decentralized payment infrastructure, while NEAR is a scalable protocol supporting fast DApp operations on mobile devices. NEAR has a higher market cap and trading volume compared to QBX.
Q2: Which cryptocurrency has shown better price performance historically? A: NEAR has shown better historical price performance, reaching an all-time high of $20.44 in 2022, compared to QBX's all-time high of $0.14 in 2024.
Q3: How do the current market situations of QBX and NEAR compare? A: As of 2025-10-31, QBX's price is $0.0033942 with a 24-hour trading volume of $18,080.52, while NEAR's price is $2.098 with a 24-hour trading volume of $3,498,584.39.
Q4: What are the long-term price predictions for QBX and NEAR by 2030? A: For QBX, the base scenario predicts a range of $0.006396 - $0.008059, with an optimistic scenario above $0.008059. For NEAR, the base scenario predicts a range of $4.27 - $4.56, with an optimistic scenario above $4.56.
Q5: How should investors allocate their assets between QBX and NEAR? A: Conservative investors might consider allocating 30% to QBX and 70% to NEAR, while aggressive investors might allocate 60% to QBX and 40% to NEAR. The exact allocation should be based on individual risk tolerance and investment goals.
Q6: What are the main risks associated with investing in QBX and NEAR? A: QBX faces risks related to limited market cap and trading volume, which may lead to higher volatility. NEAR is susceptible to broader crypto market trends and competition from other smart contract platforms. Both face potential regulatory risks, with NEAR possibly facing more scrutiny due to its smart contract functionality.
Q7: Which cryptocurrency is recommended for new investors? A: New investors might consider a higher allocation to NEAR due to its established market position, higher liquidity, and more developed ecosystem. However, individual research and risk assessment are crucial before making any investment decisions.
Share
Content
Introduction: QBX vs NEAR Investment Comparison
I. Price History Comparison and Current Market Status
II. Core Factors Affecting QBX vs NEAR Investment Value
III. 2025-2030 Price Prediction: QBX vs NEAR
IV. Investment Strategy Comparison: QBX vs NEAR
V. Potential Risk Comparison
VI. Conclusion: Which Is the Better Buy?
VII. FAQ

