2025 STND Fiyat Tahmini: Standard Protocol'un Geleceğini Belirleyen Yükseliş Trendleri ve Kritik Unsurlar

Giriş: STND'nin Piyasa Konumu ve Yatırım Değeri
Standard (STND), blokzincirler arası Web3.0 araç geliştiricisi olarak 2021'de başladığı yolculuğunda önemli bir yol kat etti. 2025 yılı itibarıyla STND’nin piyasa değeri 66.848 dolar seviyesinde; dolaşımdaki yaklaşık 90.974.950 token ile fiyatı 0,0007348 dolar civarında. “Merkeziyetsiz finans kolaylaştırıcısı” olarak bilinen bu varlık, blokzincirler arası uyumluluk ve bireysel dijital varlık yönetimi alanında giderek daha önemli bir rol üstleniyor.
Bu makalede, STND’nin 2025-2030 dönemindeki fiyat eğilimleri; tarihsel veriler, piyasa arz-talep dengesi, ekosistem gelişimi ve makroekonomik faktörler ışığında analiz edilerek, yatırımcılara profesyonel fiyat öngörüleri ve uygulamaya dönük yatırım stratejileri sunulacak.
I. STND Fiyat Geçmişi ve Güncel Piyasa Durumu
STND Tarihsel Fiyat Gelişimi
- 2021: İlk çıkış, 14 Mayıs'ta fiyat 3,06 dolar ile zirveye ulaştı
- 2023: Piyasa gerilemesi, fiyat ciddi şekilde düşüş gösterdi
- 2025: Düşüş eğilimi sürdü, 11 Ekim'de 0,0005346 dolar ile en düşük seviyeye indi
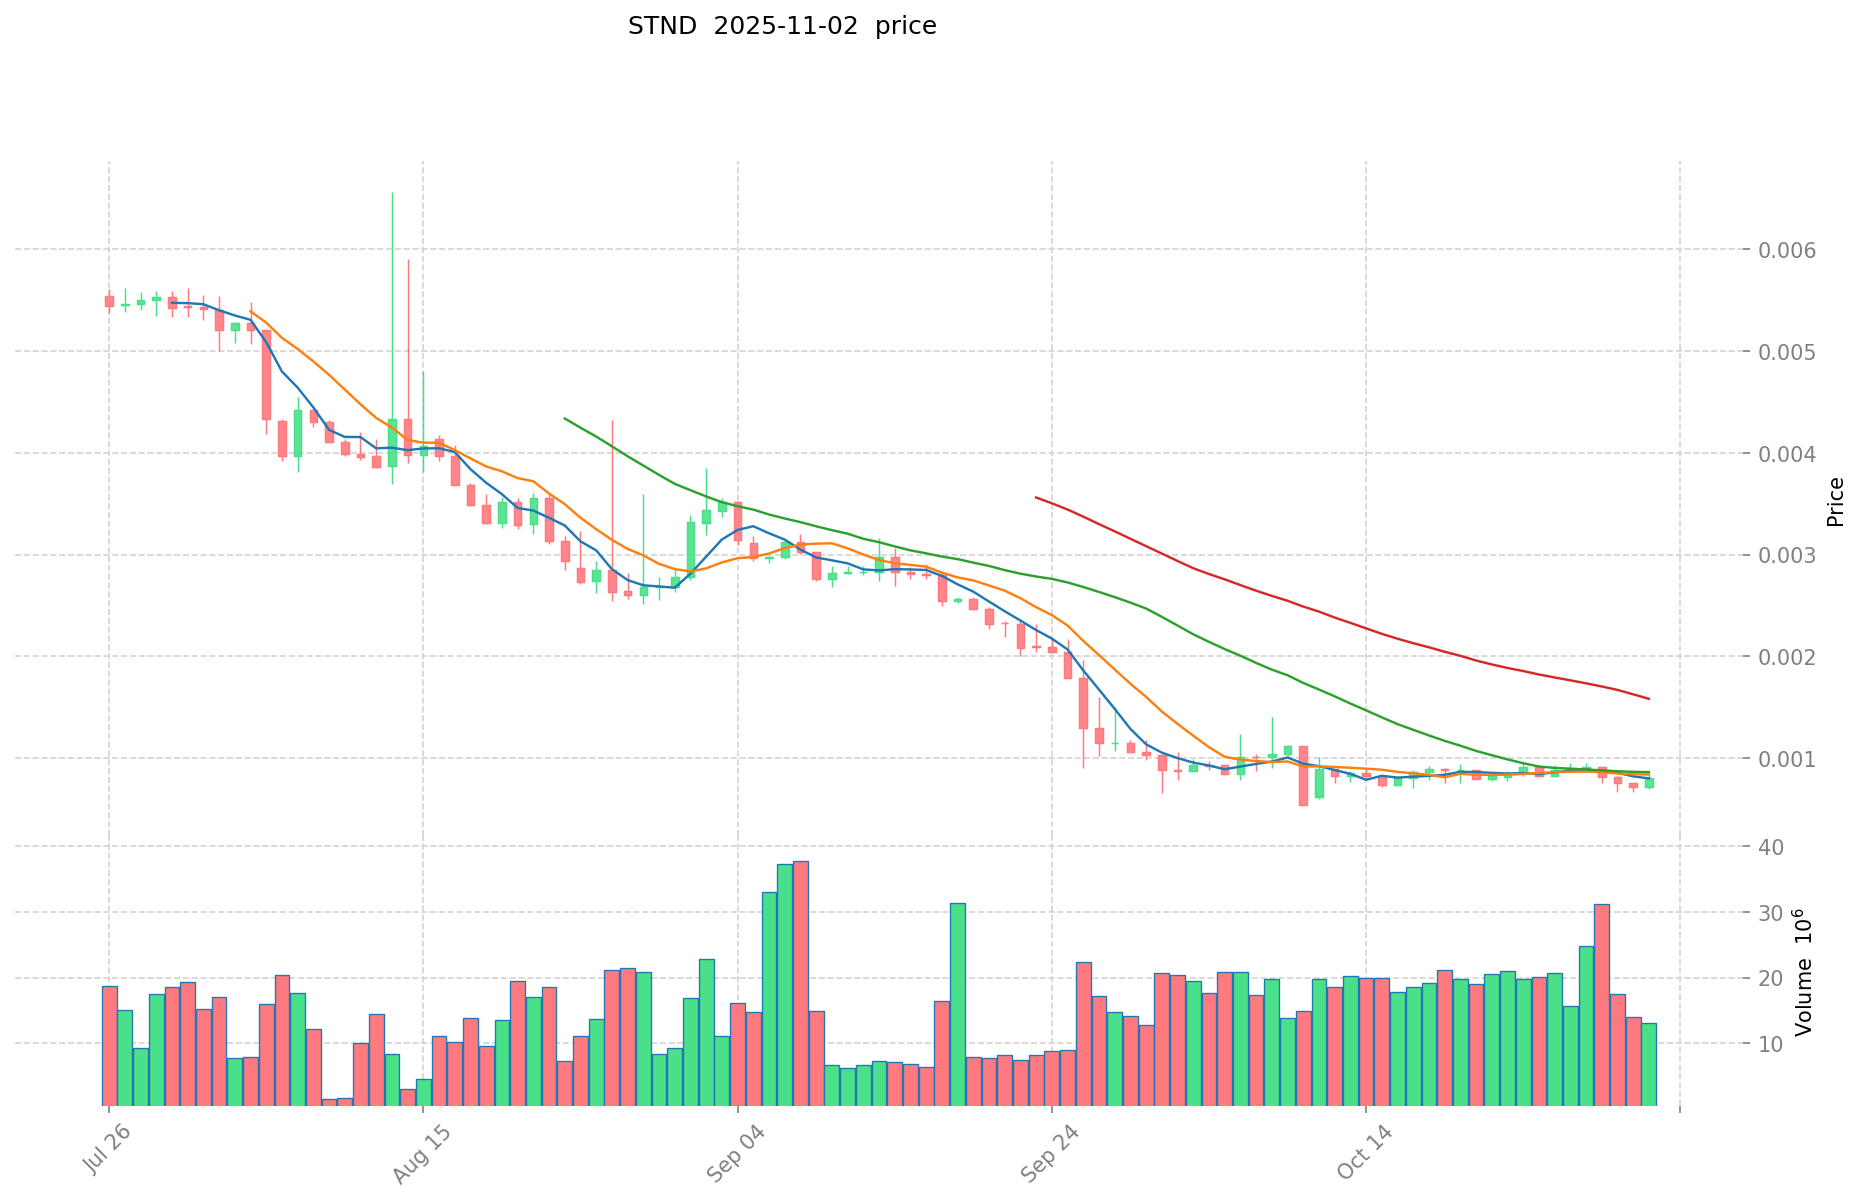
STND Güncel Piyasa Durumu
02 Kasım 2025 itibarıyla STND fiyatı 0,0007348 dolar ve bu seviye, tüm zamanların en yüksek fiyatından %99,98 oranında bir düşüş anlamına geliyor. Token, son 24 saatte %9,22 ve son bir haftada %14,64 değer kaybetti. Güncel piyasa değeri 66.848,39 dolar; dolaşımdaki miktarı ise 90.974.950 STND. 24 saatlik işlem hacmi 10.765,60 dolar olup düşük likiditeye işaret ediyor. Fiyat performansı tüm zaman dilimlerinde negatif; son 30 günde %16,41 ve son bir yılda %94,32 düşüş yaşandı.
Mevcut STND piyasa fiyatını görüntülemek için tıklayın
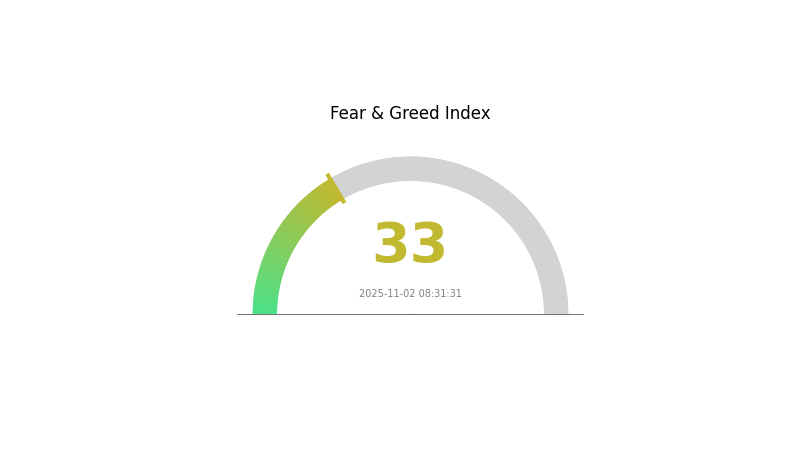
STND Piyasa Duyarlılığı Göstergesi
2025-11-02 Korku ve Açgözlülük Endeksi: 33 (Korku)
Güncel Korku & Açgözlülük Endeksi için tıklayın
Kripto piyasa duyarlılığı, Korku ve Açgözlülük Endeksi'nin 33 seviyesinde seyretmesiyle temkinli bir görünüm sergiliyor ve piyasada korku hakim. Bu, yatırımcıların çekimser kaldığını ve yeni alım fırsatları aradığını gösteriyor. Korku, birikim için fırsat sunabilir; ancak kapsamlı araştırma yapmak ve risk toleransınızı gözden geçirmek şarttır. Piyasa hissiyatı hızlı değişebilir; güncel kalın ve portföyünüzü çeşitlendirin. Gate.com, bu piyasa koşullarında etkin hareket edebilmeniz için çeşitli araçlar sunar.
STND Token Dağılımı
Adres bazlı dağılım verileri, STND tokenlarının büyük bölümünün az sayıda cüzdanda toplandığını gösteriyor. En büyük beş adres, toplam arzın %56,68’ini kontrol ediyor; ilk iki adresin her biri %15’in üzerinde paya sahip. Bu yoğunlaşma, olası piyasa manipülasyonu ve fiyat oynaklığı riskini artırıyor.
Bu yapı, görece merkeziyetçi bir sahiplik modeline işaret ediyor ve piyasa dinamiklerini etkileyebilir. Beş cüzdanda yaklaşık %57’lik pay olması, büyük satış veya koordineli işlem riskini yükseltiyor. Buna karşın, tokenların %43,32’sinin diğer adreslerde olması yaygın katılıma işaret ediyor.
Token yoğunlaşması, STND’nin zincir üzerindeki istikrarı ve merkeziyetsizlik hedeflerini etkileyebilir. Daha geniş bir dağılım, daha dirençli piyasa yapısı için ideal olsa da, mevcut tablo genç veya sıkı kontrol edilen bir ekosistem gösteriyor. Zaman içindeki dağılım değişimlerini takip etmek, STND’nin olgunlaşma ve merkeziyetsizlik sürecini değerlendirmek için önemlidir.
Mevcut STND Token Dağılımını incelemek için tıklayın
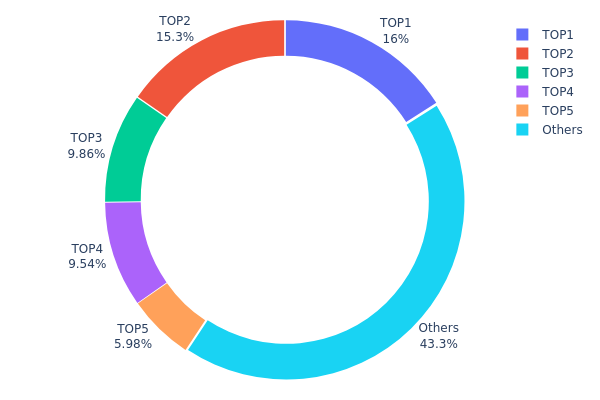
| En Üst | Adres | Token Miktarı | Pay (%) |
|---|---|---|---|
| 1 | 0x58ed...a36a51 | 15.126,13K | 15,98% |
| 2 | 0x44ee...b24a21 | 14.504,95K | 15,33% |
| 3 | 0x9642...2f5d4e | 9.328,96K | 9,86% |
| 4 | 0xa486...c3a1df | 9.025,05K | 9,54% |
| 5 | 0x0d07...b492fe | 5.652,49K | 5,97% |
| - | Diğerleri | 40.962,41K | 43,32% |
II. Gelecek STND Fiyatını Etkileyecek Temel Faktörler
Arz Mekanizması
- Piyasa Arz ve Talep: Arz ve talepteki değişimler, STND fiyatını doğrudan etkiler. Arz azalır veya talep artarsa fiyat yükselir; arz fazlaysa ve talep düşerse fiyat geriler.
Makroekonomik Ortam
- Enflasyon Karşıtı Özellikler: Enflasyonist ortamlarda STND’nin performansı, yatırımcıların değer koruma arayışı nedeniyle fiyat üzerinde etkili olabilir.
- Jeopolitik Faktörler: Uluslararası gelişmeler, STND fiyatını etkileyebilir; küresel ekonomik ve politik belirsizlikler kripto piyasalarını doğrudan etkiler.
Teknik Gelişim ve Ekosistem Oluşturma
- Teknik Analiz: Hareketli ortalamalar, RSI ve MACD gibi araçlarla geçmiş fiyat ve hacim verileri üzerinden gelecekteki fiyat eğilimleri tahmin edilir.
- Ekosistem Uygulamaları: STND’ye dair DApp ve ekosistem projeleri, benimsenmeyi ve dolayısıyla fiyatı artırabilir.
III. 2025-2030 STND Fiyat Tahmini
2025 Görünümü
- Temkinli tahmin: 0,00043 - 0,00063 dolar
- Tarafsız tahmin: 0,00063 - 0,00083 dolar
- İyimser tahmin: 0,00083 - 0,00098 dolar (olumlu piyasa hissiyatı gerektirir)
2027-2028 Görünümü
- Piyasa aşaması beklentisi: Potansiyel büyüme dönemi
- Fiyat aralığı öngörüsü:
- 2027: 0,00070 - 0,00105 dolar
- 2028: 0,00084 - 0,00145 dolar
- Temel katalizörler: Artan benimsenme ve teknolojik gelişmeler
2029-2030 Uzun Vadeli Görünüm
- Temel senaryo: 0,00086 - 0,00133 dolar (istikrarlı büyüme varsayımıyla)
- İyimser senaryo: 0,00133 - 0,00166 dolar (güçlü boğa trendleri varsayımıyla)
- Dönüştürücü senaryo: 0,00166+ dolar (son derece olumlu piyasa şartlarında)
- 2030-12-31: STND 0,00127 dolar (öngörülen ortalama fiyat)
| Yıl | En Yüksek Tahmini Fiyat | Ortalama Tahmini Fiyat | En Düşük Tahmini Fiyat | Değişim (%) |
|---|---|---|---|---|
| 2025 | 0,00098 | 0,00073 | 0,00043 | 0 |
| 2026 | 0,00098 | 0,00086 | 0,00064 | 17 |
| 2027 | 0,00105 | 0,00092 | 0,0007 | 25 |
| 2028 | 0,00145 | 0,00098 | 0,00084 | 33 |
| 2029 | 0,00133 | 0,00122 | 0,00086 | 65 |
| 2030 | 0,00166 | 0,00127 | 0,00099 | 72 |
IV. STND İçin Profesyonel Yatırım Stratejileri ve Risk Yönetimi
STND Yatırım Yöntemi
(1) Uzun Vadeli Tutma Stratejisi
- Uygun olanlar: Uzun vadeli bakış açısına sahip, risk toleransı yüksek yatırımcılar
- Operasyon önerileri:
- Piyasa düşüşlerinde STND biriktirin
- Kısmi kar almak için fiyat hedefleri koyun
- Tokenları güvenli, saklama hizmeti bulunmayan cüzdanlarda saklayın
(2) Aktif Alım-Satım Stratejisi
- Teknik analiz araçları:
- Hareketli Ortalamalar: Trend ve destek/direnç seviyeleri için
- RSI (Göreli Güç Endeksi): Aşırı alım/aşırı satım takibi için
- Dalgalı alım-satımda ana noktalar:
- Destek ve direnç seviyelerini belirleyin
- Trend onayı için işlem hacmini izleyin
STND Risk Yönetimi Çerçevesi
(1) Varlık Dağılımı İlkeleri
- Temkinli yatırımcı: Kripto portföyünün %1-3’ü
- Aggresif yatırımcı: Kripto portföyünün %5-10’u
- Profesyonel yatırımcı: Kripto portföyünün %15’ine kadar
(2) Riskten Korunma Çözümleri
- Çeşitlendirme: Birden fazla kripto varlığına yatırım yapın
- Zarar durdur emirleri: Potansiyel kayıplara karşı önceden çıkış noktaları belirleyin
(3) Güvenli Saklama Çözümleri
- Sıcak cüzdan önerisi: Gate Web3 Wallet
- Soğuk saklama: Uzun vadeli tutma için donanım cüzdanı
- Güvenlik: İki faktörlü doğrulama etkinleştirin, güçlü şifreler kullanın
V. STND İçin Olası Riskler ve Zorluklar
STND Piyasa Riskleri
- Yüksek oynaklık: STND fiyatı büyük dalgalanmalara açık
- Düşük likidite: Zayıf işlem hacmi, giriş-çıkışları etkileyebilir
- Piyasa hissiyatı: Genel kripto trendlerine duyarlı
STND Düzenleyici Riskler
- Belirsiz düzenleyici ortam: STND’yi etkileyebilecek yeni mevzuatlar ihtimali
- Sınır ötesi kısıtlamalar: Farklı ülkelerde değişen yasal statü
- Uyum zorlukları: DeFi projeleri için gelişen KYC/AML gereksinimleri
STND Teknik Riskler
- Akıllı sözleşme açıkları: Temel kodda olası istismar riski
- Ölçeklenebilirlik sorunları: Desteklenen zincirlerde ağ tıkanıklığı ihtimali
- Birlikte çalışabilirlik zorlukları: Zincirler arası fonksiyon riskleri
VI. Sonuç ve Eylem Önerileri
STND Yatırım Değeri Değerlendirmesi
STND yenilikçi Web3 araçları sunarken, önemli piyasa, düzenleyici ve teknik risklerle karşı karşıya. DeFi alanında uzun vadeli potansiyel bulunsa da, kısa vadede oynaklık ve benimseme zorlukları devam ediyor.
STND Yatırım Tavsiyeleri
✅ Yeni başlayanlar: Maruziyeti sınırlayın, eğitime odaklanın ve küçük deneme işlemleri yapın ✅ Deneyimli yatırımcılar: Çeşitlendirilmiş kripto portföyünün bir parçası olarak değerlendirin ✅ Kurumsal yatırımcılar: Kapsamlı inceleme yapın ve mevzuat gelişmelerini takip edin
STND Alım-Satım Katılım Yolları
- Spot işlem: Gate.com üzerinden STND token alımı
- DeFi etkileşimleri: Standard’ın merkeziyetsiz finans ürünlerine katılım
- Staking: Varsa staking fırsatlarını değerlendirin
Kripto para yatırımları son derece yüksek risk taşır; bu makale yatırım tavsiyesi değildir. Yatırımcılar kararlarını kendi risk toleranslarına göre vermeli ve profesyonel finans danışmanlarına başvurmalıdır. Asla kaybetmeyi göze alabileceğinizden fazla yatırım yapmayın.
SSS
Hamster Kombat coin 1 dolara ulaşır mı?
Hamster Kombat coin, blokzincir oyunlarının büyümesi ve piyasa trendleriyle 2028’e kadar 1 dolara ulaşabilir. Mevcut veriler, bu seviyeye ulaşıldığını gösteriyor.
Sand 10 dolara ulaşabilir mi?
SAND’ın büyüme potansiyeli var, ancak yakın dönemde 10 dolara ulaşması beklenmiyor. Tahminler, 2029’da en fazla 0,5740 dolara çıkabileceğini; 2033’e kadar büyüme potansiyelinin devam edeceğini ancak 10 dolara ulaşamayacağını öngörüyor.
Solana 2025’te 1000 dolara ulaşır mı?
Solana, yüksek performanslı blokzinciri ve büyüyen ekosistemiyle 2025’te 1000 dolara ulaşabilir. Ancak bu hedef iddialı olup, güçlü piyasa benimsemesi ve olumlu koşullar gerektirir.
Shiba 2040’ta 1 dolara ulaşır mı?
Bu çok düşük olasılıktır. Shiba Inu'nun 1 dolara ulaşması için 589,53 trilyon dolarlık bir piyasa değerine ihtiyacı var ki bu mümkün görünmüyor. Tahminler, 2025’te 0,0000998 ile 0,0005674 dolar arasında olacağını gösteriyor.
Share
Content
Giriş: STND'nin Piyasa Konumu ve Yatırım Değeri
I. STND Fiyat Geçmişi ve Güncel Piyasa Durumu
II. Gelecek STND Fiyatını Etkileyecek Temel Faktörler
III. 2025-2030 STND Fiyat Tahmini
IV. STND İçin Profesyonel Yatırım Stratejileri ve Risk Yönetimi
V. STND İçin Olası Riskler ve Zorluklar
VI. Sonuç ve Eylem Önerileri
SSS
How to Buy Cryptocurrency


Trending Cryptocurrencies


Aster'in yeni nesil DEX vizyonu

2025 PACK Fiyat Tahmini: Piyasa Trendleri ve Olası Büyüme Faktörlerinin Analizi

2025 KAR Fiyat Tahmini: Karura’nın Piyasa Trendleri ve Potansiyel Büyümesi Üzerine Analiz
DFYN Nedir: Çoklu Zincirli DEX Protokolüne Kapsamlı Rehber

2025 HOT Fiyat Tahmini: Holo'nun yerel token'ı için piyasa trendlerini ve olası büyüme faktörlerini analiz etmek

2025 KIM Fiyat Tahmini: Piyasa Trendleri ve Potansiyel Büyüme Faktörlerinin Analizi

AERO Token Fiyat Tahmini ve Piyasa Görünümü: Derinlemesine Bir Analiz
Vethereum (VETH) ile Tanışın: Solana'nın Kendine Özgü Meme Coin'ine Dair Analizler

2025 Yılında İdeal Dijital Varlık Cüzdanı Seçimi için Başlangıç Rehberi

2025 yılında en güncel Kripto Cüzdan uzantısını mobil ve masaüstü cihazlara indirip kurma rehberi