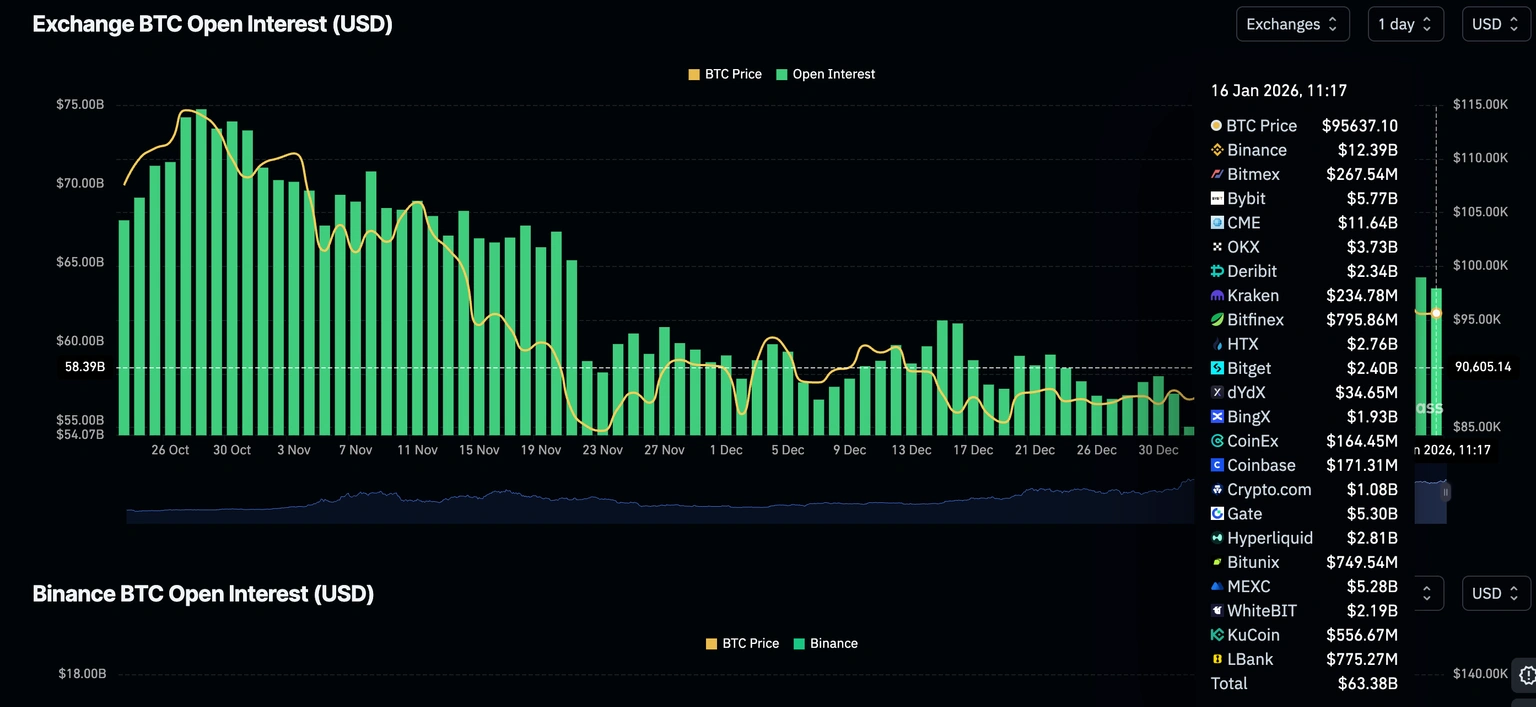
Bitcoin is struggling to break above the 95,000-dollar resistance level.
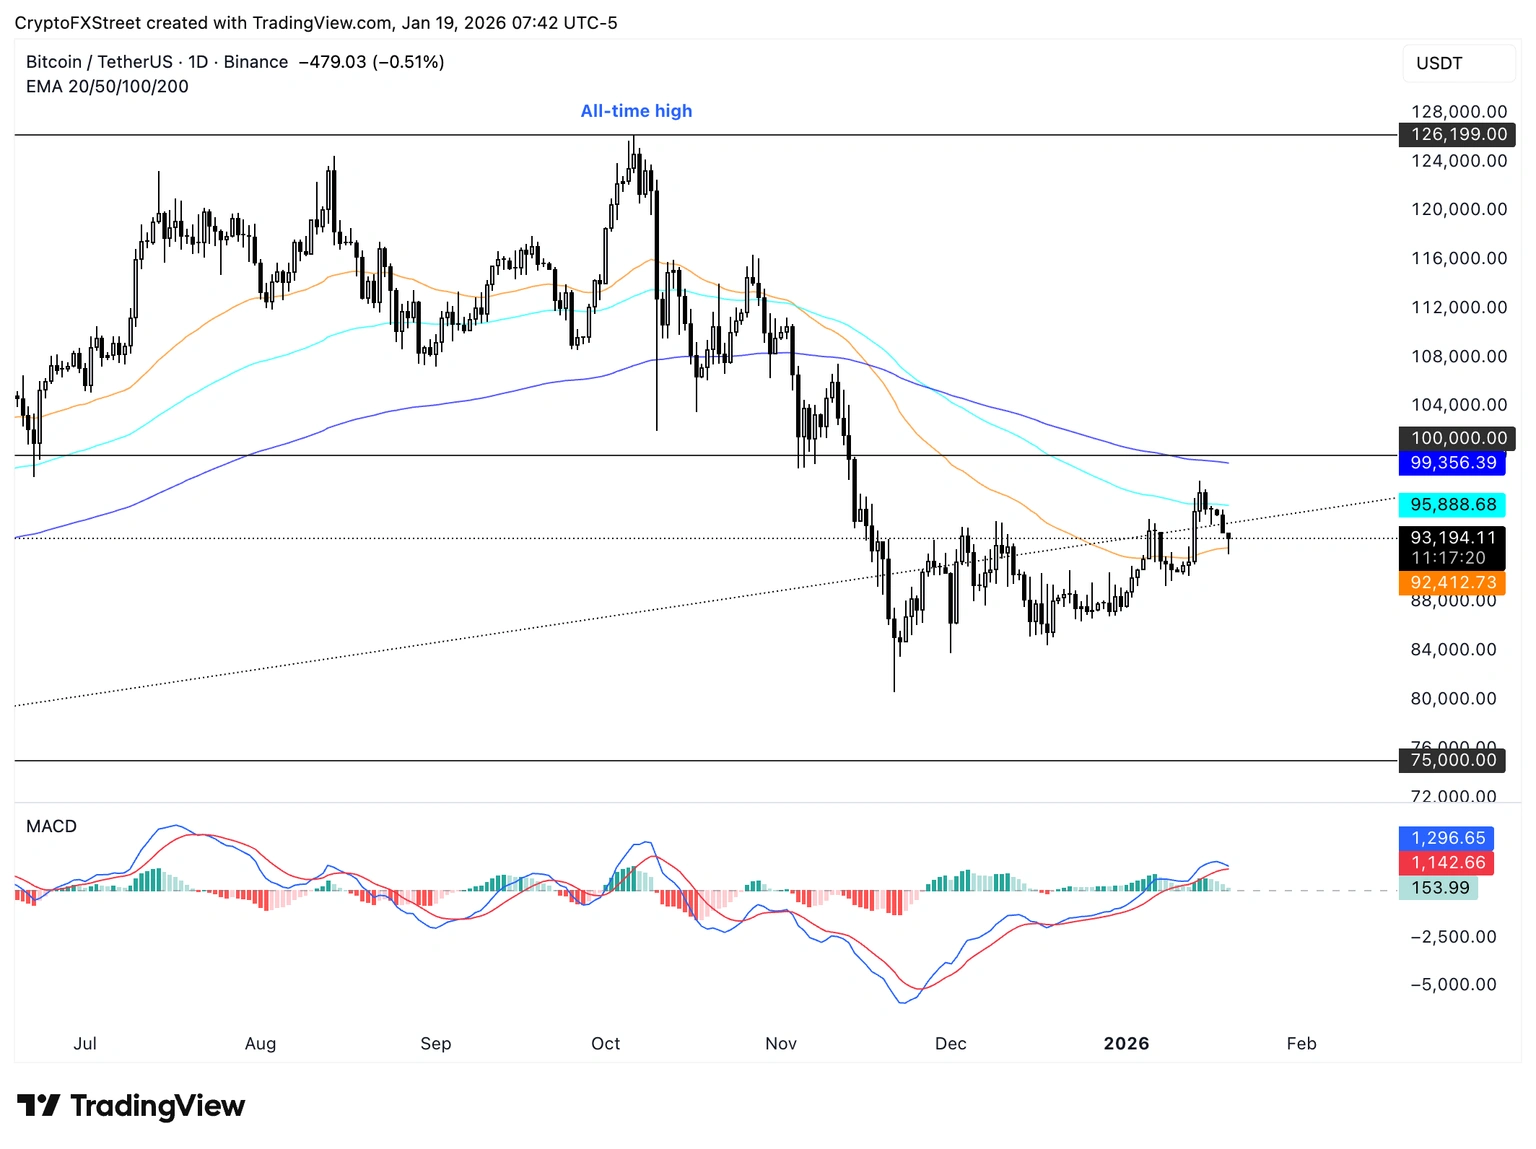
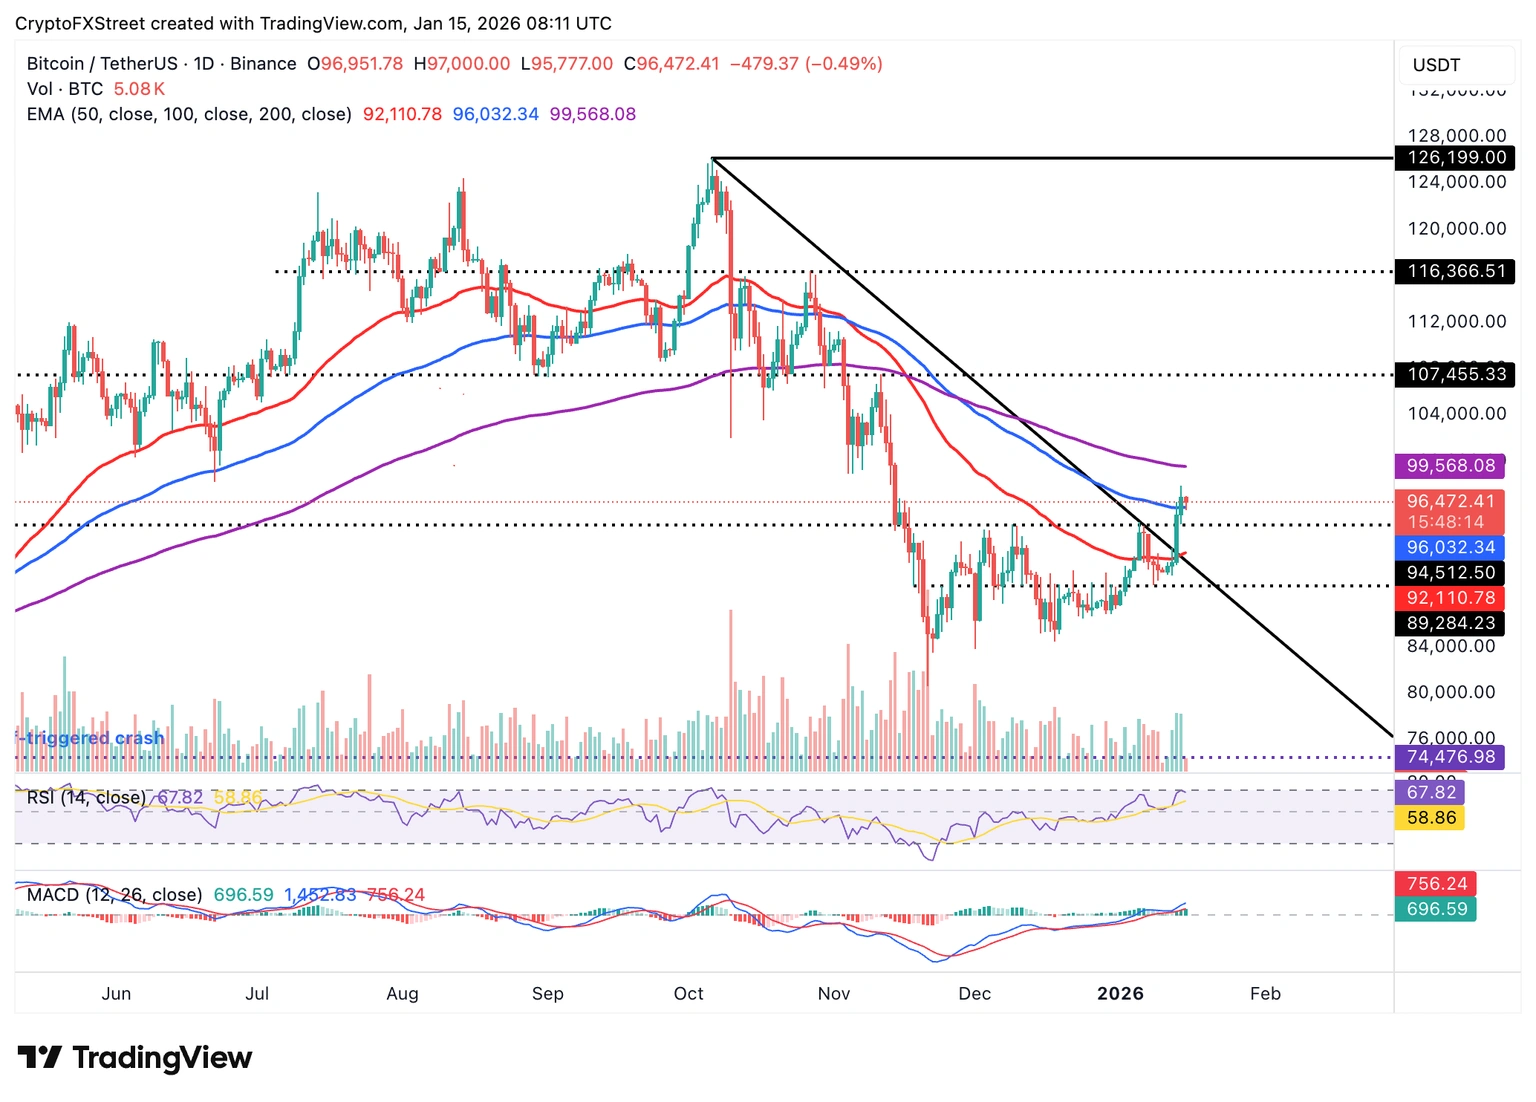
The price of Bitcoin fell below the 95,000-dollar level last Friday. Since then, this leading digital currency has been struggling to recover, reaching a low of $91,910 on Monday. The movement of Bitcoin's price within a defined range indicates two main levels, which are $95,889 and $92,412, both major exponential moving averages (EMA) as shown in the daily price chart.
The resistance level of $93,000 is critical on Monday, as the price has remained nearly steady over the past 24 hours.
The momentum indicator, which is a Moving Average Convergence Divergence (MACD) indicator, shows shorter green bars above the neutral line, indicating a slowdown in positive momentum in the Bitcoin price trend.
The lower boundary of the price range, at $92,412, may serve as a key support level. A daily Japanese candlestick close below this level could indicate the potential for further price correction this week.
Bitcoin/USD daily price chart