As of Thursday, Hyperliquid (HYPE) has retreated below the 50-day Exponential Moving Average (EMA) around the $28.85 mark, extending its correction of nearly 10% since the beginning of the week. Notably, buying pressure in the derivatives market is showing clear signs of weakening, allowing short positions to increase and dominate.
In this context, the 50-day EMA is considered an important technical “line of defense,” playing a key role in determining HYPE’s short-term trend in the near future.
Bears tighten retail investor sentiment on HYPE
Hyperliquid (HYPE) – the token of a decentralized exchange (DEX) specializing in perpetual contracts – is showing signs of losing momentum as demand from retail investors weakens significantly. According to CoinGlass data, the open interest (OI) of HYPE futures has decreased by about 2% in 24 hours, down to $1.34 billion. This indicates that many traders are actively closing positions, possibly due to forced liquidation pressures or a trend of reducing leverage amid unfavorable market conditions.
Alongside the decline in OI, the total value of long positions liquidated during the same period has reached $3.07 million, far exceeding the $228,950 of short positions. This large discrepancy clearly reflects a market phenomenon where traders are “hunting” for long positions in the HYPE derivatives market. The liquidation pressure heavily favors the bulls, causing the long/short ratio to drop to 0.9037, below the equilibrium level of 1, indicating that bears are gradually gaining the upper hand and market sentiment continues to lean toward caution.
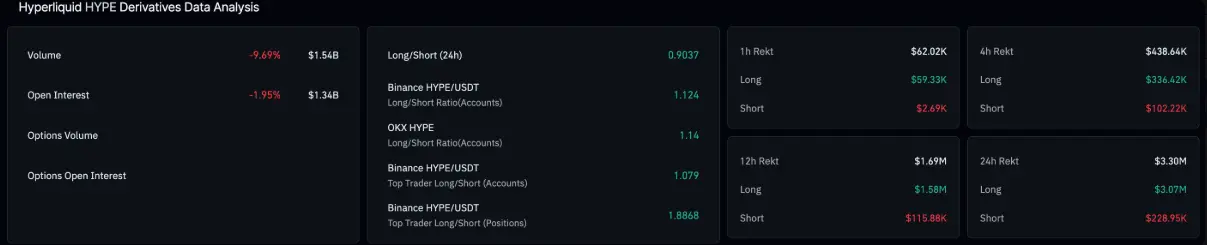 HYPE Derivatives Data | Source: CoinGlass## Will HYPE hold the 50-day EMA?
As of Thursday, Hyperliquid has lost a critical support level by falling below the 50-day EMA at $28.85, recording nearly a 1% decline during the session. Breaking through this short-term moving average — while it remains below the 200-day EMA at $32.75 — signals that the trend structure is firmly tilted toward the bearish side.
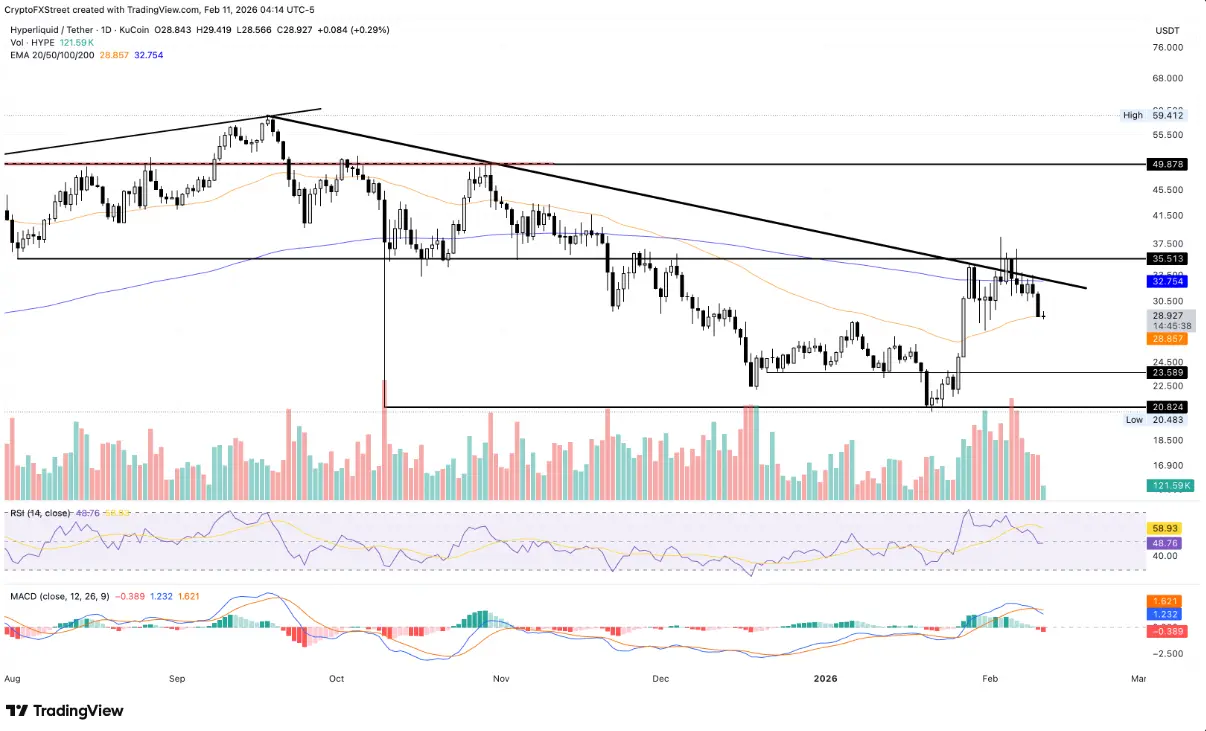 Daily HYPE/USDT Chart | Source: TradingView If the daily close remains below $28.85, the breakdown scenario will be confirmed, opening the risk of a deeper plunge toward the support zone at $23.58, the low set on December 21. If selling pressure increases, the $20.82 level — the October 10 low — will serve as the next strong defensive line for the market.
Technical indicators also reinforce the negative outlook. The daily MACD has reversed downward and formed a bearish crossover earlier this week, with the histogram continuing to expand in the negative, reflecting a weakening momentum. Meanwhile, the RSI has fallen back to 48 and dropped below the neutral threshold after leaving the overbought zone, indicating that selling still dominates and room for further decline remains.
However, if HYPE can recover and close above the 50-day EMA at $28.85, short-term downward pressure will ease, creating an opportunity for the price to rebound and challenge the 200-day EMA at $32.75.
Disclaimer: The information on this page may come from third parties and does not represent the views or opinions of Gate. The content displayed on this page is for reference only and does not constitute any financial, investment, or legal advice. Gate does not guarantee the accuracy or completeness of the information and shall not be liable for any losses arising from the use of this information. Virtual asset investments carry high risks and are subject to significant price volatility. You may lose all of your invested principal. Please fully understand the relevant risks and make prudent decisions based on your own financial situation and risk tolerance. For details, please refer to
Disclaimer.
Related Articles
The RWA Yield Infrastructure Trade
The essay highlights challenges in direct RWA token exposure, emphasizes the potential in leverage opportunities amid settlement delays, critiques Morpho's governance token structure, and presents Fluid as a more effective token model with stablecoin links.
CoinDesk16m ago
ETH drops 0.74% in 15 minutes: spot net outflows and fear sentiment converge to trigger selling pressure
2026-04-05 06:00 to 06:15 (UTC), ETH price oscillated in the range of 2031.63 to 2049.03 USDT, with the return rate recording -0.74% and the 15-minute amplitude at 0.85%. During this period, market attention increased, volatility intensified, and short-term capital became active.
The main driver behind this unusual move was large-scale net outflows of spot funds, with 24-hour cumulative net outflows totaling $126 million. On-chain, the number of active addresses rose to a daily high of 1.2 million, and transaction volume exceeded 1.5 million, reflecting that large holders or institutional entities accelerated asset transfers or selling during this period. The market sells
GateNews21m ago
Grayscale says 5 altcoins are at the "buy" price levels
Grayscale Investments emphasizes the potential of Sui (SUI), highlighting its programming model as suitable for organizational deployment. They see current altcoin prices, including SUI, as attractive for accumulation, signaling possible recovery as institutional demand rises.
TapChiBitcoin3h ago
ADA Price Weakens Under Resistance While Large Wallets Accumulate
Key Insights:
Cardano trades below all major moving averages, reinforcing bearish pressure while price struggles to reclaim even short-term resistance levels across multiple timeframes.
Whale wallets holding large ADA balances have steadily accumulated since February, reaching their
CryptoNewsLand10h ago
Dogecoin Holds Near $0.09 as April Pattern Shapes Outlook
Key Insights
Dogecoin maintains stability above the $0.09 support, with buyers defending the level despite consistent selling pressure that limits strong upward momentum in early April trading sessions.
April performance remains historically mixed, with past rallies and declines shaping
CryptoNewsLand11h ago
SHIB Holds Weak Range as Burn Rate Drops and Pressure Builds
Key Insights
SHIB remains within a long-standing descending channel, with price stuck in the lower range and unable to break persistent resistance levels.
The burn rate dropped sharply, removing a short-term support factor and reducing retail-driven momentum seen earlier during increased
CryptoNewsLand11h ago
