Key Notes
- Avalanche recently recorded a new peak for daily active addresses.
- The network became 43 times more cost-efficient over the past year.
- AVAX fell sharply on Jan.
- 19 during a wider crypto market drop.
Avalanche
AVAX
$12.79
24h volatility:
6.2%
Market cap:
$5.51 B
Vol. 24h:
$410.27 M
has recently seen a sharp spike in network use. On Jan. 19, daily active addresses on Avalanche C Chain reached 1.71 million, the highest level ever recorded. Before this, daily addresses stayed mostly around 300,000-600,000.
The move points to renewed use across apps, transfers, and on-chain actions. Over the past year, Avalanche has become 43 times more cost-efficient.
Related article: Ethereum User Retention Doubles, Daily Transactions Hit Record 2.8MIn 2025, daily transactions increased 153.6% year over year to an average of 4.2 million. Daily active addresses climbed 379.6% year over year to 380,000. Total transactions reached 1.45 billion, up 152.9% from 2024.
Avalanche continues to post fast finality of about two seconds, low fees, and throughput above 4,500 transactions per second.
AVX Price Drops Despite Network Strength
Despite the growing on-chain activity, the Avalanche token (AVAX) continues to struggle. On Jan. 19, AVAX saw a major price drop amid a broader crypto market downturn. At the time of writing, AVAX is trading around $12.59, down by 7.5% over the past day.
Notably, AVAX has been trending lower after surging above $35 in September last year. Since then, the token’s market cap has fallen by about $9.44 billion and currently sits near $5.43 billion. AVAX is now ranked 20th by market cap.
Sharp Move Ahead?
Momentum readings show AVAX at its weakest level since the 2022-2023 bear market low. Historically, such periods lead to late-stage sell pressure and a potential sharp move if risk conditions turn.
On the daily chart, AVAX is trading below the mid Bollinger Band (20-day SMA). Price recently tagged the lower band near $12, a zone where short-term selling pressure surges. If the token fails to hold $12, it could risk a drop toward $10.50.
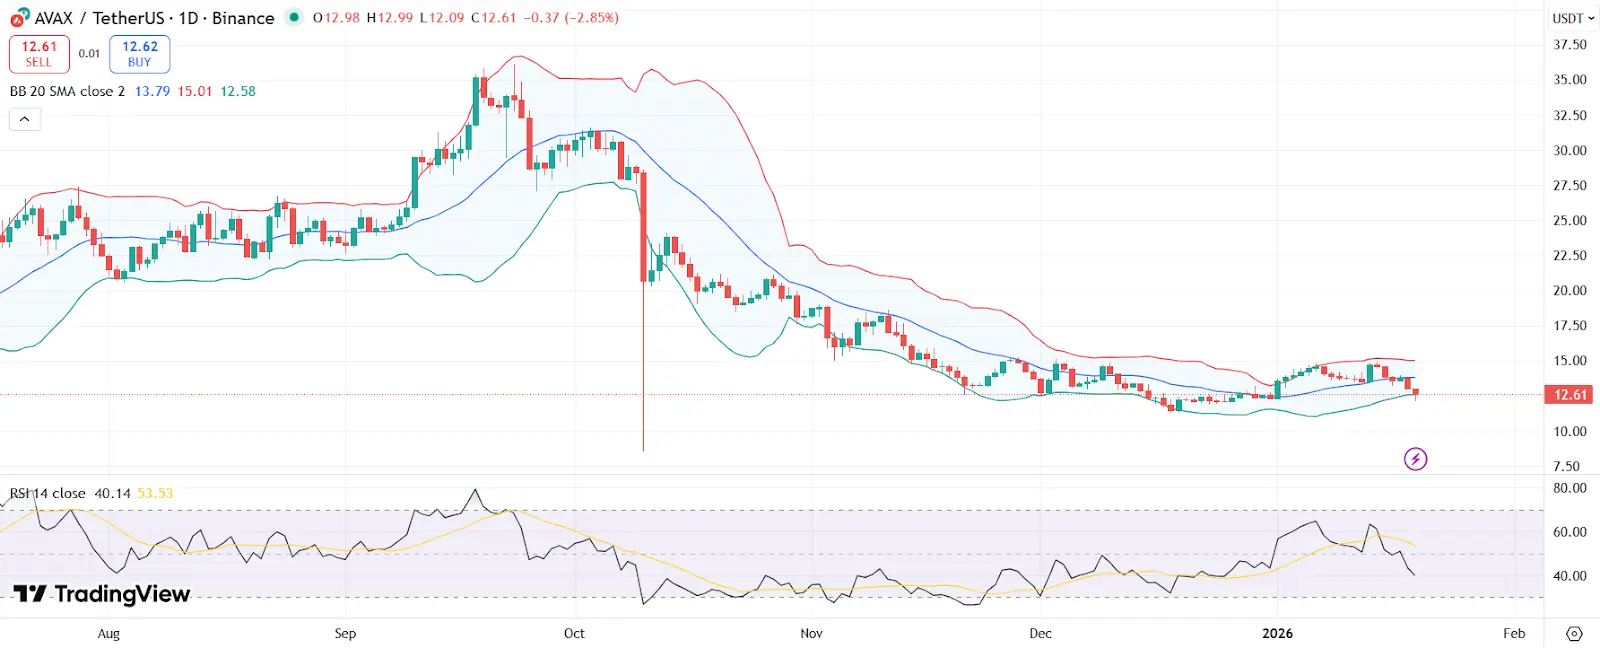 AVAX price chart with RSI and Bollinger Bands | Source: TradingView
Meanwhile, RSI is below neutral but not yet extreme. A price increase above $13.80 could lead the token to the upper Bollinger Band around $15. If AVAX manages to close above $16, it would confirm a trend reversal and potential price rally.
nextDisclaimer: Coinspeaker is committed to providing unbiased and transparent reporting. This article aims to deliver accurate and timely information but should not be taken as financial or investment advice. Since market conditions can change rapidly, we encourage you to verify information on your own and consult with a professional before making any decisions based on this content.
Disclaimer: The information on this page may come from third parties and does not represent the views or opinions of Gate. The content displayed on this page is for reference only and does not constitute any financial, investment, or legal advice. Gate does not guarantee the accuracy or completeness of the information and shall not be liable for any losses arising from the use of this information. Virtual asset investments carry high risks and are subject to significant price volatility. You may lose all of your invested principal. Please fully understand the relevant risks and make prudent decisions based on your own financial situation and risk tolerance. For details, please refer to
Disclaimer.
Related Articles
Pi Network mainnet migration triggers CEX deposits, bulls defend the 0.1736 USDT support line to the death
After Pi Network’s second mainnet migration, about 119,000 users completed KYC verification, resulting in more than 1.12 million PI tokens flowing into centralized exchanges and creating short-term selling pressure. Technical analysis shows that $0.1736 is a key support level, and the Protocol 21 upgrade on April 6 will affect token stability and application expansion.
MarketWhisper54m ago
The PI bulls remain steadfast at the critical support level that marks the decisive point between the second phase of the migration wave
Pi Network saw a 2% rise on Tuesday, maintaining key support amid US-Iran tensions. The second mainnet migration led to increased PI deposits on exchanges, highlighting ecosystem challenges. Technical indicators show potential recovery, but resistance remains at $0.1872.
TapChiBitcoin1h ago
Bitcoin Greed Index hits the bottom: retail investors panic, but long-term holders quietly accumulate coins
The Bitcoin Fear and Greed Index recorded a score of 8 on March 30, indicating extreme pessimism in the market. Maintaining this state for 59 days, it is the longest fear period since the 2022 FTX collapse. Despite subdued retail sentiment, long-term holders have moved Bitcoin to self-custody accounts for protection, with no sign of selling pressure—showing behavior consistent with historical bottom characteristics. With the current market influenced by multiple macro factors and lacking a clear rebound catalyst, the timeline for recovery remains difficult to predict.
MarketWhisper1h ago
Michael Saylor “Laser Eyes” post surpasses 1 million views, billionaires follow up by buying crypto
MicroStrategy Executive Chairman Saylor has restarted the laser eyes symbol, expressing his bullish conviction in Bitcoin, and contrasting it with the current market’s fear sentiment. MicroStrategy holds 761,068 Bitcoins and plans to increase that to 1,000,000 by 2026. Real estate billionaire Grant Cardone has also announced additional Bitcoin purchases, strengthening market confidence and signaling a long-term hold.
MarketWhisper2h ago
Hyperliquid whale puts on a short position in Bitcoin worth 53 million, the market is wary of downside risk
On the decentralized sustainable derivatives exchange Hyperliquid, a whale trader opened a leveraged short Bitcoin position worth $53.0 million, with a liquidation price of $80,630. At the same time, the trader also holds short positions in silver and multiple altcoins, as well as a long position in Brent crude oil, reflecting its bearish outlook on the current market. Geopolitics, regulatory uncertainty, and the upcoming employment data make up the threefold pressure weighing on this week’s market.
MarketWhisper2h ago
BTC 15-minute surge 0.80%: spot incremental buy orders and changes in the order book structure drive a price breakout
From 2026-03-31 01:15 to 2026-03-31 01:30 (UTC), BTC showed a clear breakout move. The candlestick data indicates a return rate of +0.80%, with the price ranging between 67,241.1 and 67,884.3 USDT, and a recorded amplitude of 0.96%. During this period, trading activity in the market was active, risk appetite rebounded, and short-term bullish sentiment dominated, driving the price to break through local resistance.
The main driving forces behind this breakout were the synchronized rise in trading volume across the spot and derivatives (futures/perpetual) markets, along with a significant net inflow of funds into exchanges. The spot trading volume surged sharply compared with the average value of the previous hour.
GateNews2h ago
